
|
|||||
|
 | |
| |
| |
| |
| |
| |
|
Gene: SCAI |
Gene summary for SCAI |
| Gene information | Species | Human | Gene symbol | SCAI | Gene ID | 286205 |
| Gene name | suppressor of cancer cell invasion | |
| Gene Alias | C9orf126 | |
| Cytomap | 9q33.3 | |
| Gene Type | protein-coding | GO ID | GO:0006139 | UniProtAcc | Q8N9R8 |
Top |
Malignant transformation analysis |
| Identification of the aberrant gene expression in precancerous and cancerous lesions by comparing the gene expression of stem-like cells in diseased tissues with normal stem cells |
| Entrez ID | Symbol | Replicates | Species | Organ | Tissue | Adj P-value | Log2FC | Malignancy |
| 286205 | SCAI | CCI_2 | Human | Cervix | CC | 2.15e-09 | 9.87e-01 | 0.5249 |
| 286205 | SCAI | CCI_3 | Human | Cervix | CC | 2.91e-10 | 7.27e-01 | 0.516 |
| 286205 | SCAI | HTA11_3410_2000001011 | Human | Colorectum | AD | 2.14e-02 | -2.82e-01 | 0.0155 |
| 286205 | SCAI | F007 | Human | Colorectum | FAP | 4.61e-04 | -4.16e-01 | 0.1176 |
| 286205 | SCAI | A001-C-207 | Human | Colorectum | FAP | 1.81e-08 | -4.74e-01 | 0.1278 |
| 286205 | SCAI | A015-C-203 | Human | Colorectum | FAP | 9.78e-18 | -2.86e-01 | -0.1294 |
| 286205 | SCAI | A015-C-204 | Human | Colorectum | FAP | 3.42e-02 | -2.15e-01 | -0.0228 |
| 286205 | SCAI | A014-C-040 | Human | Colorectum | FAP | 1.09e-03 | -5.21e-01 | -0.1184 |
| 286205 | SCAI | A002-C-201 | Human | Colorectum | FAP | 3.72e-10 | -3.36e-01 | 0.0324 |
| 286205 | SCAI | A001-C-119 | Human | Colorectum | FAP | 8.72e-03 | -1.77e-01 | -0.1557 |
| 286205 | SCAI | A001-C-108 | Human | Colorectum | FAP | 5.50e-10 | -2.56e-01 | -0.0272 |
| 286205 | SCAI | A002-C-205 | Human | Colorectum | FAP | 2.82e-14 | -2.92e-01 | -0.1236 |
| 286205 | SCAI | A001-C-104 | Human | Colorectum | FAP | 6.80e-03 | -1.90e-01 | 0.0184 |
| 286205 | SCAI | A015-C-005 | Human | Colorectum | FAP | 3.76e-02 | -2.59e-01 | -0.0336 |
| 286205 | SCAI | A015-C-006 | Human | Colorectum | FAP | 3.22e-09 | -3.78e-01 | -0.0994 |
| 286205 | SCAI | A015-C-106 | Human | Colorectum | FAP | 1.60e-04 | -2.22e-01 | -0.0511 |
| 286205 | SCAI | A002-C-114 | Human | Colorectum | FAP | 1.99e-12 | -3.69e-01 | -0.1561 |
| 286205 | SCAI | A015-C-104 | Human | Colorectum | FAP | 4.10e-20 | -3.68e-01 | -0.1899 |
| 286205 | SCAI | A001-C-014 | Human | Colorectum | FAP | 3.93e-10 | -3.13e-01 | 0.0135 |
| 286205 | SCAI | A002-C-016 | Human | Colorectum | FAP | 3.60e-12 | -3.58e-01 | 0.0521 |
| Page: 1 2 |
| Tissue | Expression Dynamics | Abbreviation |
| Cervix | 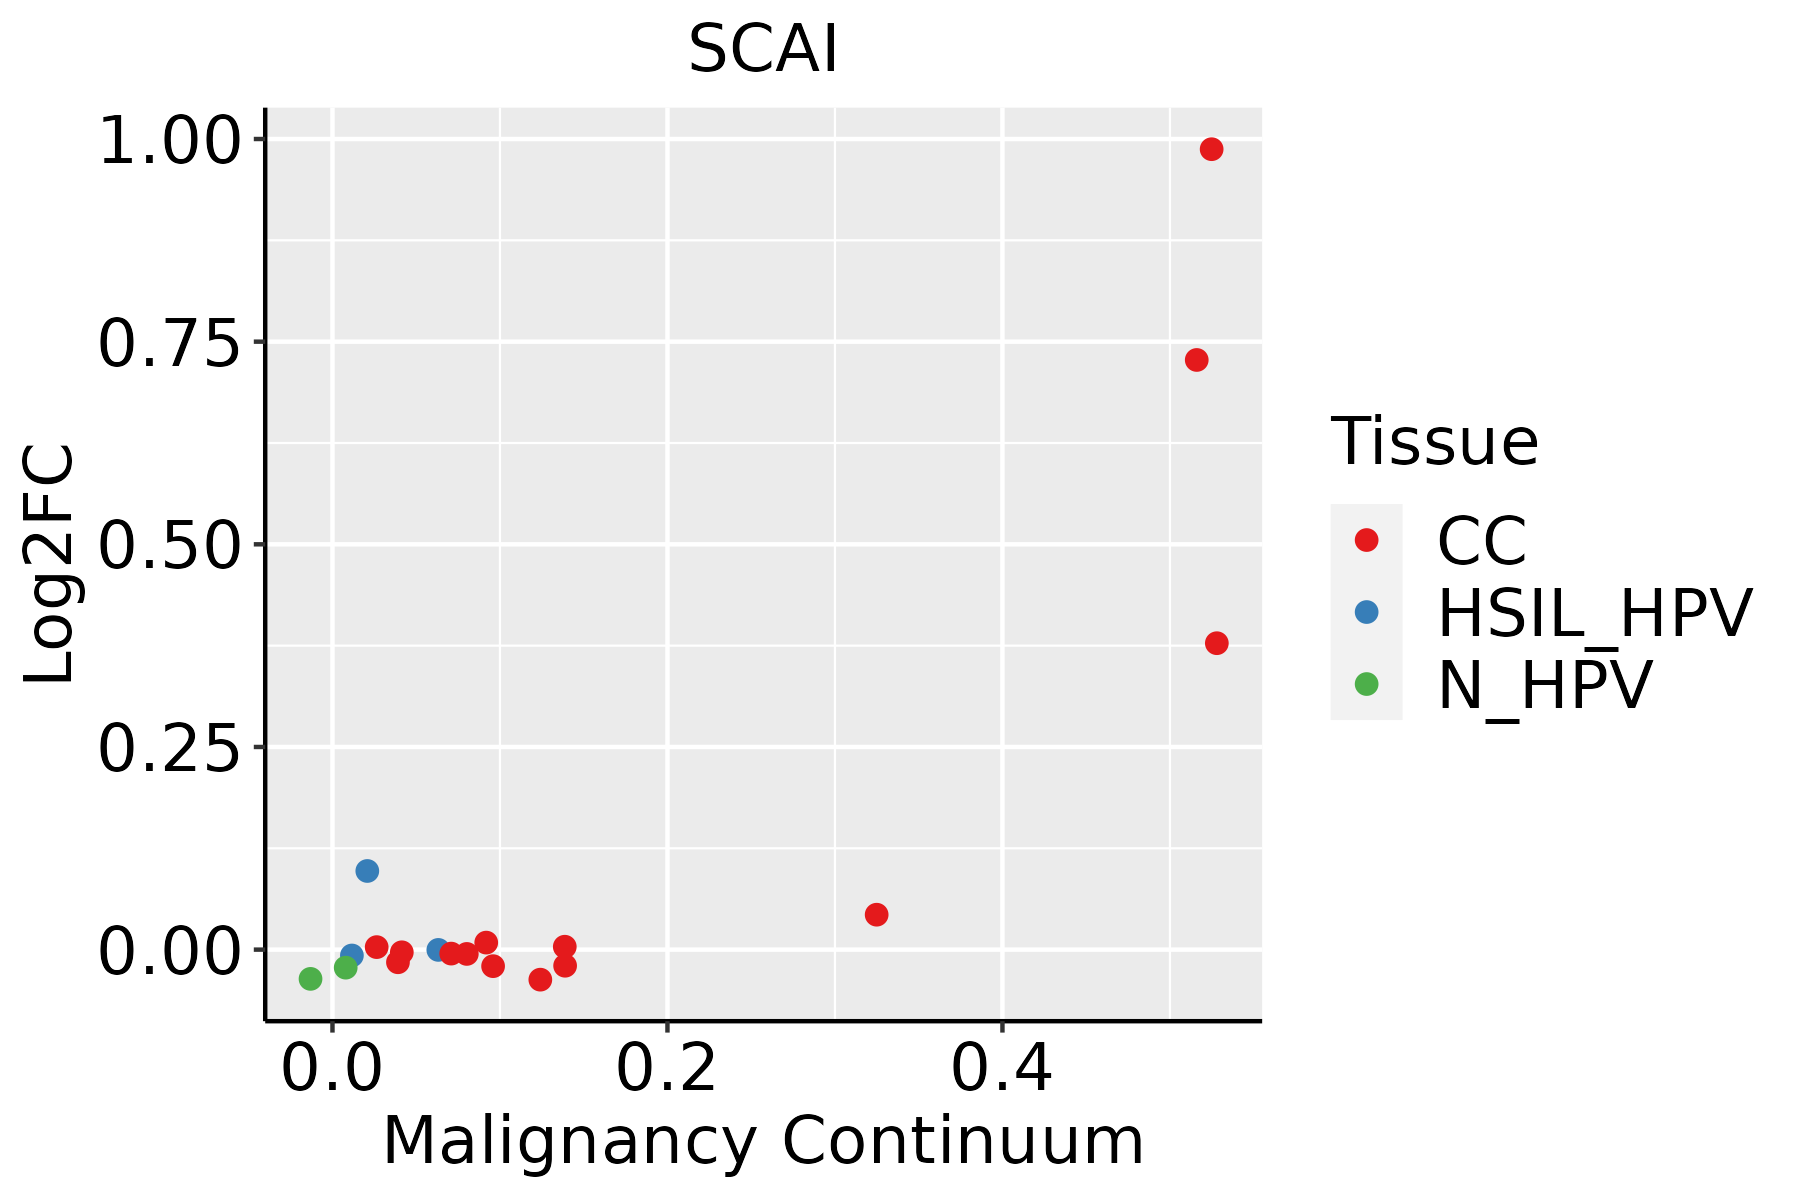 | CC: Cervix cancer |
| HSIL_HPV: HPV-infected high-grade squamous intraepithelial lesions | ||
| N_HPV: HPV-infected normal cervix | ||
| Colorectum (GSE201348) |  | FAP: Familial adenomatous polyposis |
| CRC: Colorectal cancer | ||
| Colorectum (HTA11) |  | AD: Adenomas |
| SER: Sessile serrated lesions | ||
| MSI-H: Microsatellite-high colorectal cancer | ||
| MSS: Microsatellite stable colorectal cancer | ||
| Endometrium | 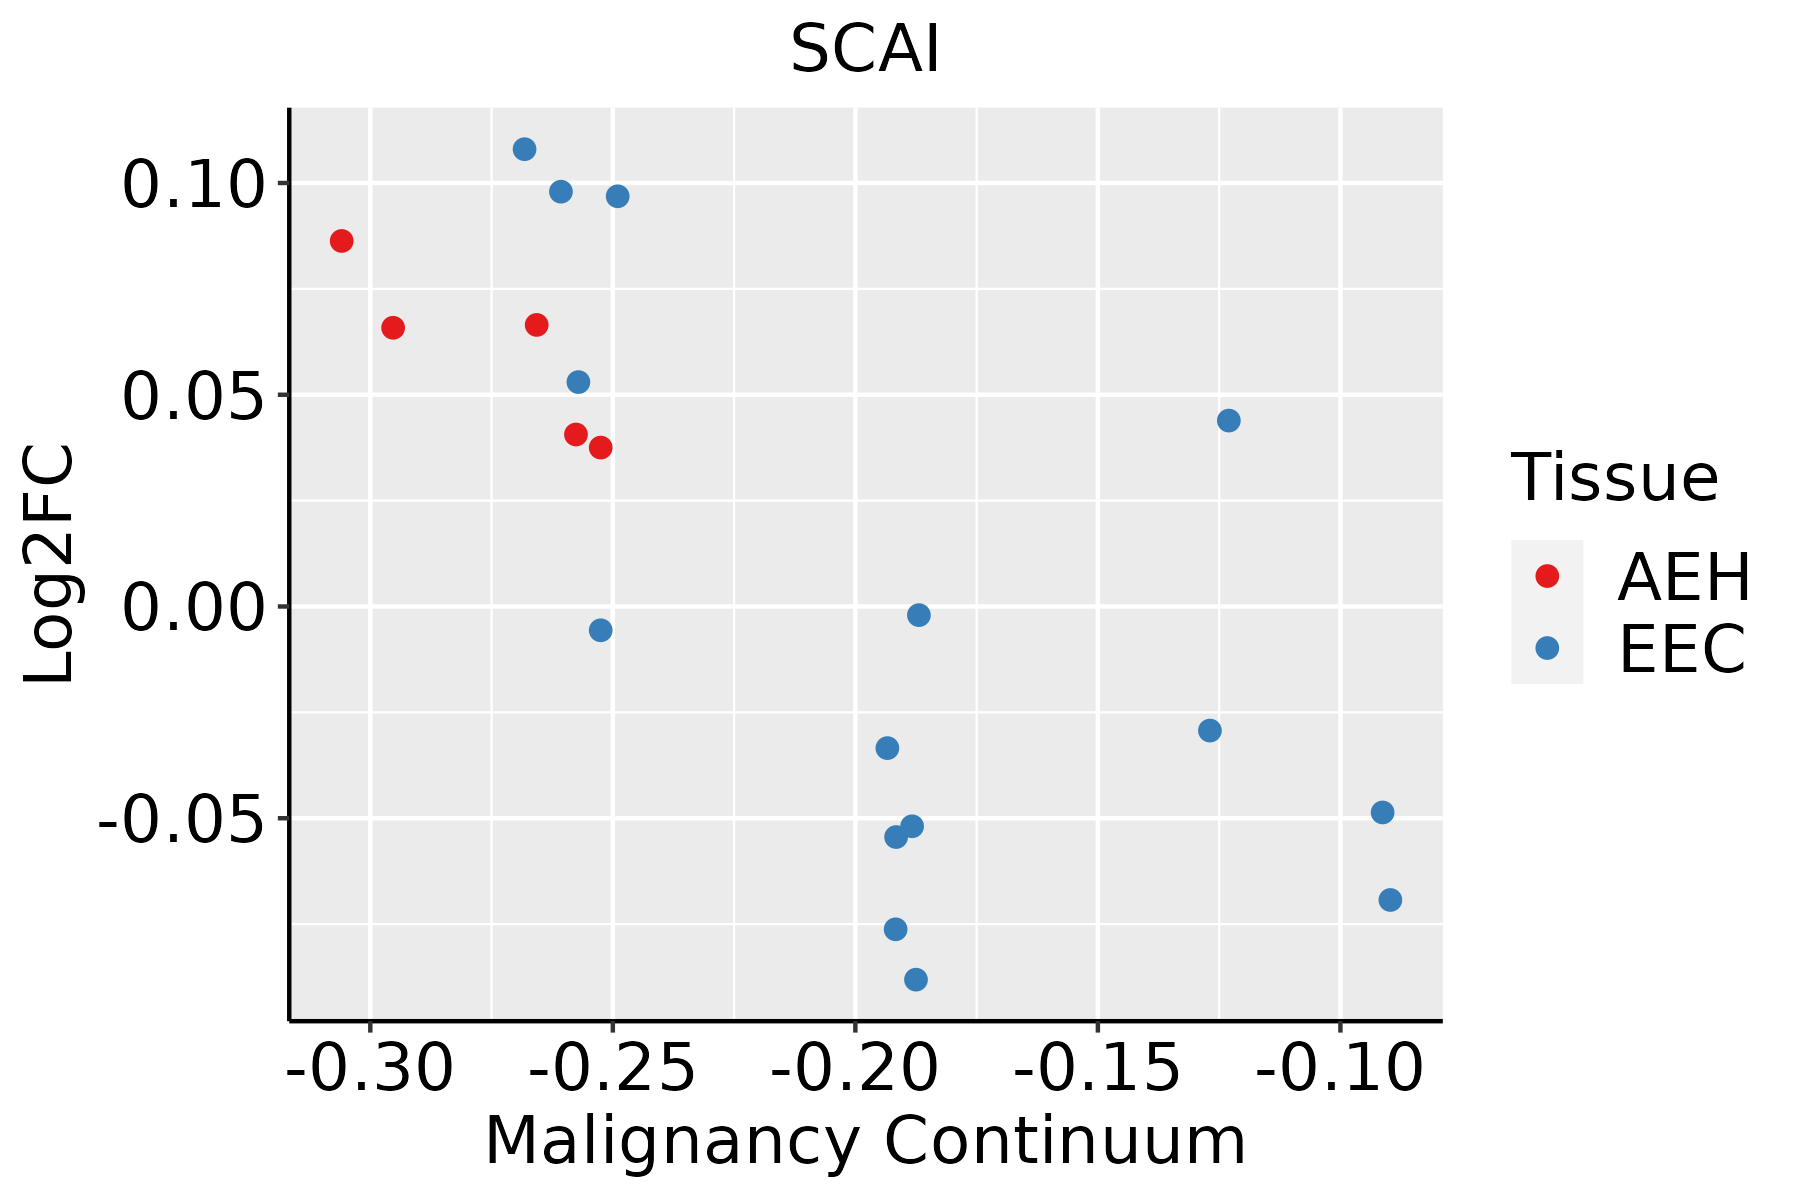 | AEH: Atypical endometrial hyperplasia |
| EEC: Endometrioid Cancer |
| ∗log2FC in expression of this searched gene in stem-like cells from each diseased tissue sample relative to stem-like cells in normal samples in each tissue plotted against the malignancy continuum. Samples are colored based on if they are from different disease stage. |
Top |
Malignant transformation related pathway analysis |
| Find out the enriched GO biological processes and KEGG pathways involved in transition from healthy to precancer to cancer |
| Tissue | Disease Stage | Enriched GO biological Processes |
| Colorectum | AD |  |
| Colorectum | SER |  |
| Colorectum | MSS |  |
| Colorectum | MSI-H |  |
| Colorectum | FAP |  |
| ∗Top 15 enriched GO BP terms are showed in the bar plot of each disease state in each tissue. Each row represents a significant GO biological process which is colored according to the -log10(p.adjust). |
| Page: 1 2 3 4 5 6 7 8 9 |
| GO ID | Tissue | Disease Stage | Description | Gene Ratio | Bg Ratio | pvalue | p.adjust | Count |
| GO:00510566 | Cervix | CC | regulation of small GTPase mediated signal transduction | 75/2311 | 302/18723 | 1.54e-09 | 1.74e-07 | 75 |
| GO:00072656 | Cervix | CC | Ras protein signal transduction | 79/2311 | 337/18723 | 9.49e-09 | 7.77e-07 | 79 |
| GO:00072666 | Cervix | CC | Rho protein signal transduction | 35/2311 | 137/18723 | 1.77e-05 | 3.33e-04 | 35 |
| GO:00465785 | Cervix | CC | regulation of Ras protein signal transduction | 44/2311 | 189/18723 | 2.05e-05 | 3.73e-04 | 44 |
| GO:00512713 | Cervix | CC | negative regulation of cellular component movement | 73/2311 | 367/18723 | 2.22e-05 | 3.95e-04 | 73 |
| GO:00400133 | Cervix | CC | negative regulation of locomotion | 76/2311 | 391/18723 | 3.47e-05 | 5.60e-04 | 76 |
| GO:20001463 | Cervix | CC | negative regulation of cell motility | 71/2311 | 359/18723 | 3.47e-05 | 5.60e-04 | 71 |
| GO:00303363 | Cervix | CC | negative regulation of cell migration | 68/2311 | 344/18723 | 5.11e-05 | 7.70e-04 | 68 |
| GO:00350235 | Cervix | CC | regulation of Rho protein signal transduction | 22/2311 | 86/18723 | 5.93e-04 | 5.60e-03 | 22 |
| GO:00510585 | Cervix | CC | negative regulation of small GTPase mediated signal transduction | 15/2311 | 56/18723 | 2.60e-03 | 1.80e-02 | 15 |
| GO:00350244 | Cervix | CC | negative regulation of Rho protein signal transduction | 8/2311 | 22/18723 | 3.43e-03 | 2.22e-02 | 8 |
| GO:00465804 | Cervix | CC | negative regulation of Ras protein signal transduction | 13/2311 | 49/18723 | 5.34e-03 | 3.10e-02 | 13 |
| GO:0007265 | Colorectum | AD | Ras protein signal transduction | 104/3918 | 337/18723 | 1.01e-05 | 2.35e-04 | 104 |
| GO:0051056 | Colorectum | AD | regulation of small GTPase mediated signal transduction | 94/3918 | 302/18723 | 1.81e-05 | 3.76e-04 | 94 |
| GO:0046578 | Colorectum | AD | regulation of Ras protein signal transduction | 56/3918 | 189/18723 | 2.85e-03 | 2.14e-02 | 56 |
| GO:0051058 | Colorectum | AD | negative regulation of small GTPase mediated signal transduction | 21/3918 | 56/18723 | 3.26e-03 | 2.39e-02 | 21 |
| GO:0007266 | Colorectum | AD | Rho protein signal transduction | 42/3918 | 137/18723 | 4.64e-03 | 3.16e-02 | 42 |
| GO:00510562 | Colorectum | FAP | regulation of small GTPase mediated signal transduction | 78/2622 | 302/18723 | 3.25e-08 | 2.85e-06 | 78 |
| GO:00072652 | Colorectum | FAP | Ras protein signal transduction | 80/2622 | 337/18723 | 9.61e-07 | 4.33e-05 | 80 |
| GO:00465781 | Colorectum | FAP | regulation of Ras protein signal transduction | 47/2622 | 189/18723 | 4.67e-05 | 9.60e-04 | 47 |
| Page: 1 2 |
| Pathway ID | Tissue | Disease Stage | Description | Gene Ratio | Bg Ratio | pvalue | p.adjust | qvalue | Count |
| Page: 1 |
Top |
Cell-cell communication analysis |
| Identification of potential cell-cell interactions between two cell types and their ligand-receptor pairs for different disease states |
| Ligand | Receptor | LRpair | Pathway | Tissue | Disease Stage |
| Page: 1 |
Top |
Single-cell gene regulatory network inference analysis |
| Find out the significant the regulons (TFs) and the target genes of each regulon across cell types for different disease states |
| TF | Cell Type | Tissue | Disease Stage | Target Gene | RSS | Regulon Activity |
| ∗The dot plots of a searched regulon are shown for all cell subpopulations in each disease state of each tissue based on the regulon specific score inferred using pySCENIC and by calculating the average expression. |
| Page: 1 |
Top |
Somatic mutation of malignant transformation related genes |
| Annotation of somatic variants for genes involved in malignant transformation |
| Hugo Symbol | Variant Class | Variant Classification | dbSNP RS | HGVSc | HGVSp | HGVSp Short | SWISSPROT | BIOTYPE | SIFT | PolyPhen | Tumor Sample Barcode | Tissue | Histology | Sex | Age | Stage | Therapy Types | Drugs | Outcome |
| SCAI | SNV | Missense_Mutation | c.156T>G | p.His52Gln | p.H52Q | Q8N9R8 | protein_coding | deleterious_low_confidence(0) | benign(0.402) | TCGA-AN-A0AK-01 | Breast | breast invasive carcinoma | Female | >=65 | I/II | Unknown | Unknown | SD | |
| SCAI | SNV | Missense_Mutation | rs369558159 | c.901G>A | p.Ala301Thr | p.A301T | Q8N9R8 | protein_coding | deleterious(0.05) | possibly_damaging(0.561) | TCGA-AO-A128-01 | Breast | breast invasive carcinoma | Female | <65 | I/II | Chemotherapy | doxorubicin | SD |
| SCAI | SNV | Missense_Mutation | c.400N>A | p.Val134Ile | p.V134I | Q8N9R8 | protein_coding | tolerated(0.59) | possibly_damaging(0.872) | TCGA-BH-A0HF-01 | Breast | breast invasive carcinoma | Female | >=65 | I/II | Hormone Therapy | arimidex | SD | |
| SCAI | SNV | Missense_Mutation | c.833G>A | p.Arg278His | p.R278H | Q8N9R8 | protein_coding | deleterious(0) | probably_damaging(0.989) | TCGA-E2-A15A-06 | Breast | breast invasive carcinoma | Female | <65 | III/IV | Chemotherapy | cyclophosphamide | SD | |
| SCAI | SNV | Missense_Mutation | rs761266346 | c.1555N>T | p.Arg519Cys | p.R519C | Q8N9R8 | protein_coding | deleterious(0.03) | possibly_damaging(0.809) | TCGA-2W-A8YY-01 | Cervix | cervical & endocervical cancer | Female | <65 | I/II | Chemotherapy | cisplatin | CR |
| SCAI | SNV | Missense_Mutation | c.1453N>G | p.Pro485Ala | p.P485A | Q8N9R8 | protein_coding | deleterious(0.01) | probably_damaging(0.987) | TCGA-EK-A2IP-01 | Cervix | cervical & endocervical cancer | Female | <65 | I/II | Unknown | Unknown | SD | |
| SCAI | SNV | Missense_Mutation | c.1060N>C | p.Glu354Gln | p.E354Q | Q8N9R8 | protein_coding | tolerated(0.17) | probably_damaging(0.986) | TCGA-EK-A2RK-01 | Cervix | cervical & endocervical cancer | Female | >=65 | I/II | Unknown | Unknown | SD | |
| SCAI | SNV | Missense_Mutation | c.1508A>G | p.Asn503Ser | p.N503S | Q8N9R8 | protein_coding | deleterious(0.03) | benign(0.199) | TCGA-FU-A3HZ-01 | Cervix | cervical & endocervical cancer | Female | <65 | I/II | Chemotherapy | cisplatin | CR | |
| SCAI | SNV | Missense_Mutation | novel | c.892N>A | p.Leu298Met | p.L298M | Q8N9R8 | protein_coding | deleterious(0) | probably_damaging(0.991) | TCGA-VS-A959-01 | Cervix | cervical & endocervical cancer | Female | >=65 | I/II | Unknown | Unknown | SD |
| SCAI | SNV | Missense_Mutation | novel | c.890N>T | p.Ser297Phe | p.S297F | Q8N9R8 | protein_coding | deleterious(0.02) | benign(0.023) | TCGA-VS-A959-01 | Cervix | cervical & endocervical cancer | Female | >=65 | I/II | Unknown | Unknown | SD |
| Page: 1 2 3 4 5 6 7 8 |
Top |
Related drugs of malignant transformation related genes |
| Identification of chemicals and drugs interact with genes involved in malignant transfromation |
| (DGIdb 4.0) |
| Entrez ID | Symbol | Category | Interaction Types | Drug Claim Name | Drug Name | PMIDs |
| Page: 1 |

Copyright 2023-Present -The University of Texas Health Science Center at Houston |