Schematic overview of the cellular and molecular mechanisms involved in the cancer progression, including the proposed cellular and molecular mechanisms in cancer cells trajectory. AT1: alveolar type 1 cells; AT2: alveolar type 2 cells; AAH: atypical adenomatous hyperplasia; AIS: adenocarcinoma in situ; MIA: minimally invasive adenocarcinoma; IA: invasive adenocarcinoma; EMT: epithelial-mesenchymal transition

Home

Download

Statistics

Help

Contact

Center for Computational Systems Medicine
leaf

Gene summary

leaf

Malignant transformation analysis

leaf

Malignant transformation related pathway analysis

leaf

Cell-cell communication analysis

leaf

Single-cell gene regulatory network inference analysis

leaf

Somatic mutation of malignant transformation related genes

leaf

Related drugs of malignant transformation related genes

Gene: SCAF8

Gene summary for SCAF8

check button Gene summary.

Gene informationSpeciesHuman
Gene symbol

SCAF8

Gene ID

22828

Gene nameSR-related CTD associated factor 8
Gene AliasRBM16
Cytomap6q25.2
Gene Typeprotein-coding
GO ID

GO:0000122

UniProtAcc

A0A0A0MT33


Top

Malignant transformation analysis

check button Identification of the aberrant gene expression in precancerous and cancerous lesions by comparing the gene expression of stem-like cells in diseased tissues with normal stem cells
check button Malignant transformation involving gene list.
Entrez IDSymbolReplicatesSpeciesOrganTissueAdj P-valueLog2FCMalignancy
22828SCAF8CCI_1HumanCervixCC4.46e-024.49e-010.528
22828SCAF8CCI_2HumanCervixCC8.61e-097.49e-010.5249
22828SCAF8CCI_3HumanCervixCC2.93e-118.40e-010.516
22828SCAF8HTA11_3410_2000001011HumanColorectumAD9.57e-06-3.54e-010.0155
22828SCAF8HTA11_347_2000001011HumanColorectumAD2.48e-023.57e-01-0.1954
22828SCAF8HTA11_7696_3000711011HumanColorectumAD4.17e-03-3.78e-010.0674
22828SCAF8HTA11_99999970781_79442HumanColorectumMSS5.56e-034.12e-010.294
22828SCAF8HTA11_99999974143_84620HumanColorectumMSS3.99e-13-5.46e-010.3005
22828SCAF8A002-C-010HumanColorectumFAP1.36e-03-1.73e-010.242
22828SCAF8A015-C-203HumanColorectumFAP4.37e-28-5.43e-01-0.1294
22828SCAF8A015-C-204HumanColorectumFAP2.70e-07-4.14e-01-0.0228
22828SCAF8A014-C-040HumanColorectumFAP1.94e-08-7.48e-01-0.1184
22828SCAF8A002-C-201HumanColorectumFAP1.30e-15-4.27e-010.0324
22828SCAF8A002-C-203HumanColorectumFAP3.46e-04-2.53e-010.2786
22828SCAF8A001-C-119HumanColorectumFAP7.07e-12-5.93e-01-0.1557
22828SCAF8A001-C-108HumanColorectumFAP1.37e-16-4.15e-01-0.0272
22828SCAF8A002-C-205HumanColorectumFAP1.82e-28-6.35e-01-0.1236
22828SCAF8A001-C-104HumanColorectumFAP2.73e-05-3.54e-010.0184
22828SCAF8A015-C-005HumanColorectumFAP1.10e-04-3.22e-01-0.0336
22828SCAF8A015-C-006HumanColorectumFAP1.64e-18-5.65e-01-0.0994
Page: 1 2 3 4 5 6 7 8 

check button Transcriptomic changes along malignancy continuum.
TissueExpression DynamicsAbbreviation
CervixThe image shows the transcriptomic changes along malignancy continuum.log2FC in expression of this searched gene in stem-like cells from each diseased tissue sample relative to stem-like cells in normal samples in each tissue plotted against the malignancy continuum. Samples are colored based on if they are from different disease stage.CC: Cervix cancer
HSIL_HPV: HPV-infected high-grade squamous intraepithelial lesions
N_HPV: HPV-infected normal cervix
Colorectum (GSE201348)The image shows the transcriptomic changes along malignancy continuum.log2FC in expression of this searched gene in stem-like cells from each diseased tissue sample relative to stem-like cells in normal samples in each tissue plotted against the malignancy continuum. Samples are colored based on if they are from different disease stage.FAP: Familial adenomatous polyposis
CRC: Colorectal cancer
Colorectum (HTA11)The image shows the transcriptomic changes along malignancy continuum.log2FC in expression of this searched gene in stem-like cells from each diseased tissue sample relative to stem-like cells in normal samples in each tissue plotted against the malignancy continuum. Samples are colored based on if they are from different disease stage.AD: Adenomas
SER: Sessile serrated lesions
MSI-H: Microsatellite-high colorectal cancer
MSS: Microsatellite stable colorectal cancer
EndometriumThe image shows the transcriptomic changes along malignancy continuum.log2FC in expression of this searched gene in stem-like cells from each diseased tissue sample relative to stem-like cells in normal samples in each tissue plotted against the malignancy continuum. Samples are colored based on if they are from different disease stage.
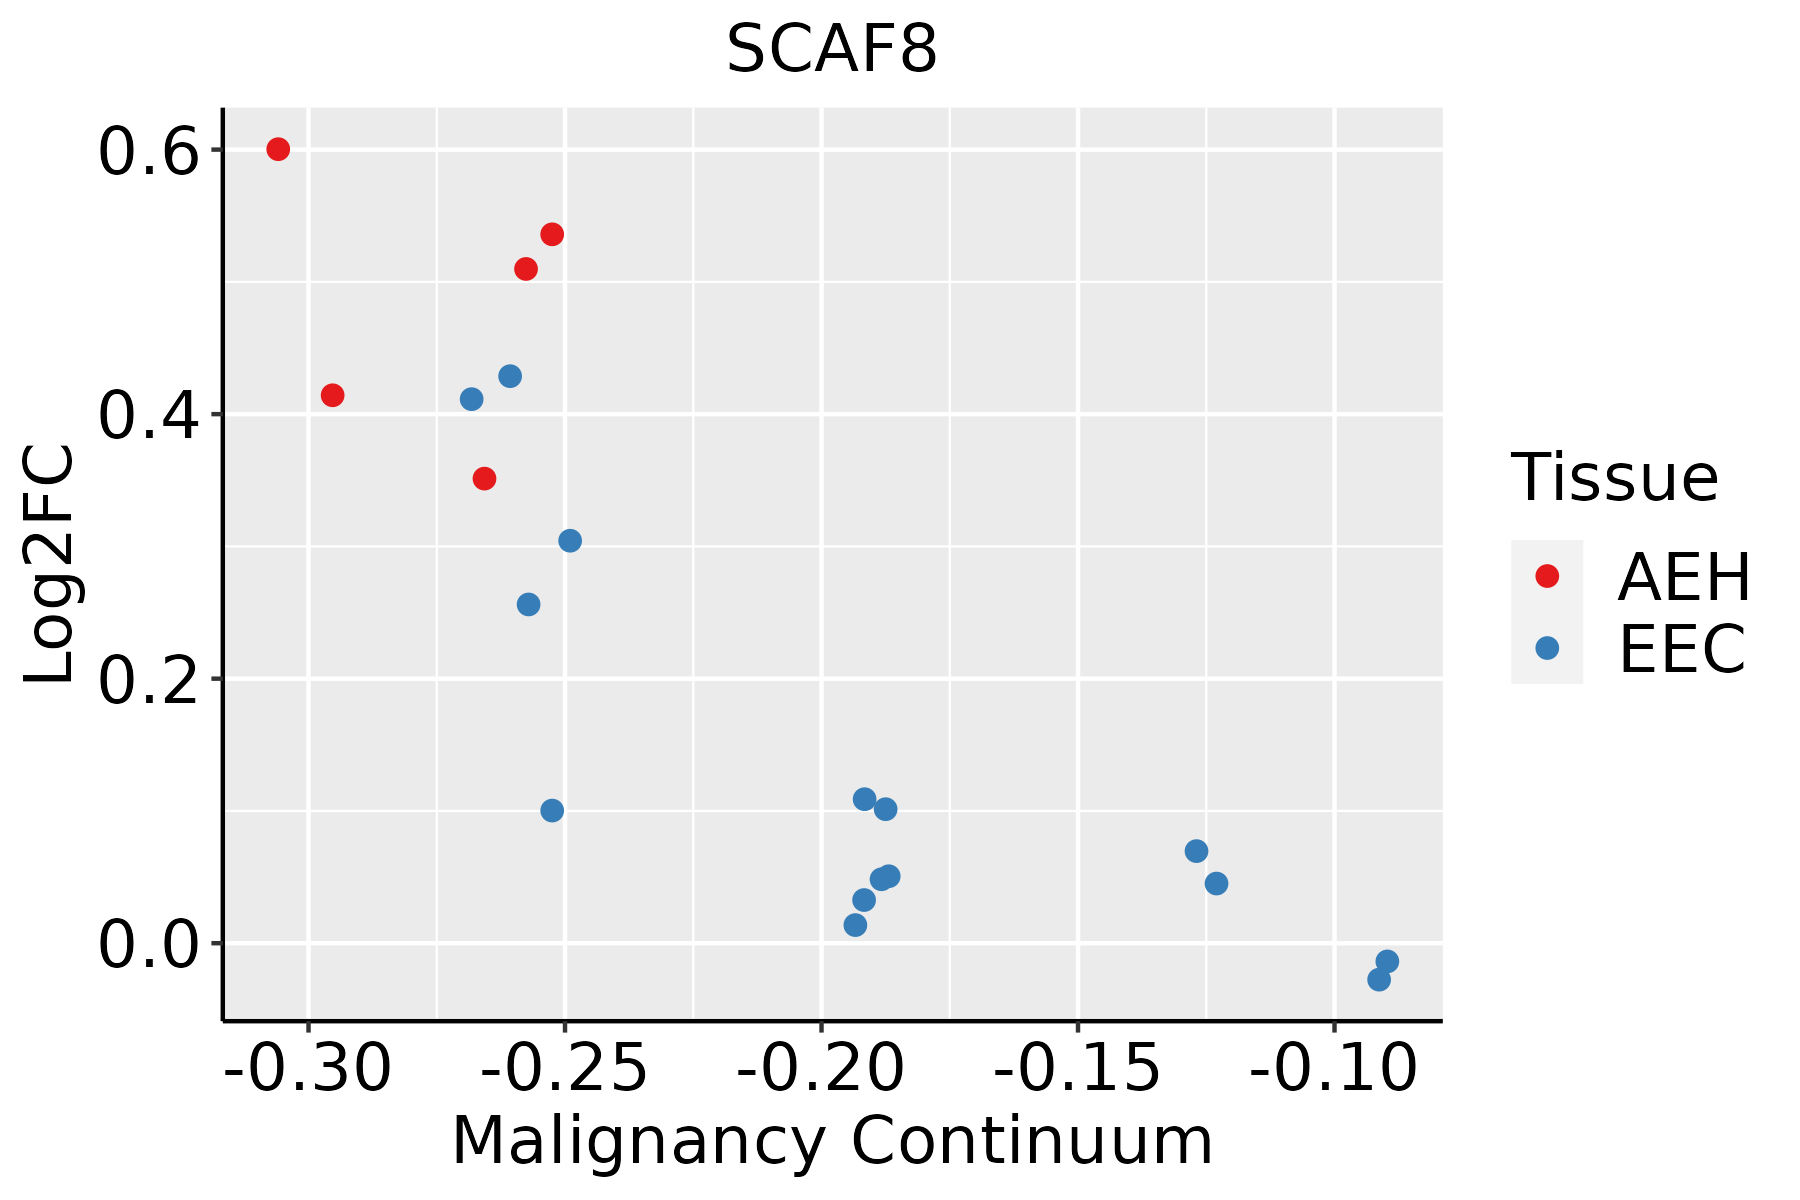
AEH: Atypical endometrial hyperplasia
EEC: Endometrioid Cancer
EsophagusThe image shows the transcriptomic changes along malignancy continuum.log2FC in expression of this searched gene in stem-like cells from each diseased tissue sample relative to stem-like cells in normal samples in each tissue plotted against the malignancy continuum. Samples are colored based on if they are from different disease stage.
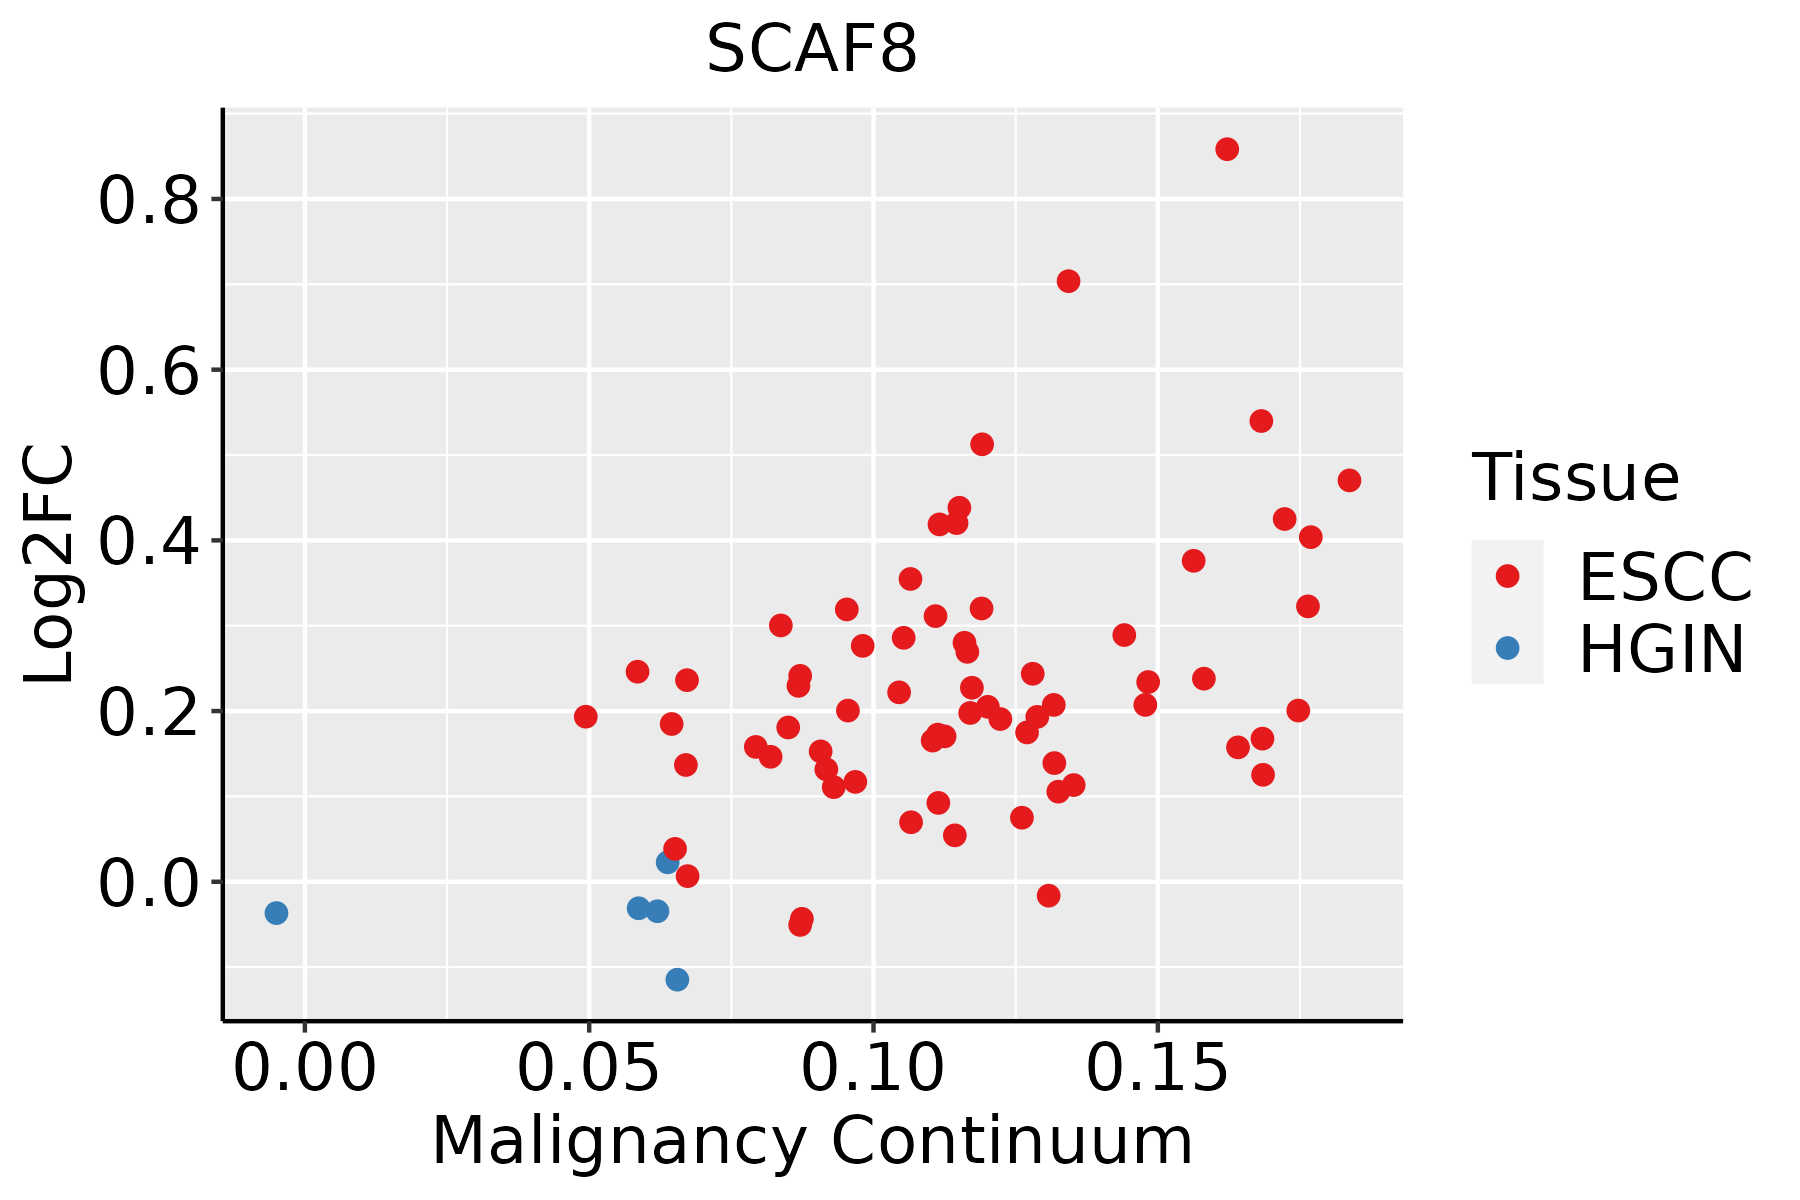
ESCC: Esophageal squamous cell carcinoma
HGIN: High-grade intraepithelial neoplasias
LGIN: Low-grade intraepithelial neoplasias
LiverThe image shows the transcriptomic changes along malignancy continuum.log2FC in expression of this searched gene in stem-like cells from each diseased tissue sample relative to stem-like cells in normal samples in each tissue plotted against the malignancy continuum. Samples are colored based on if they are from different disease stage.
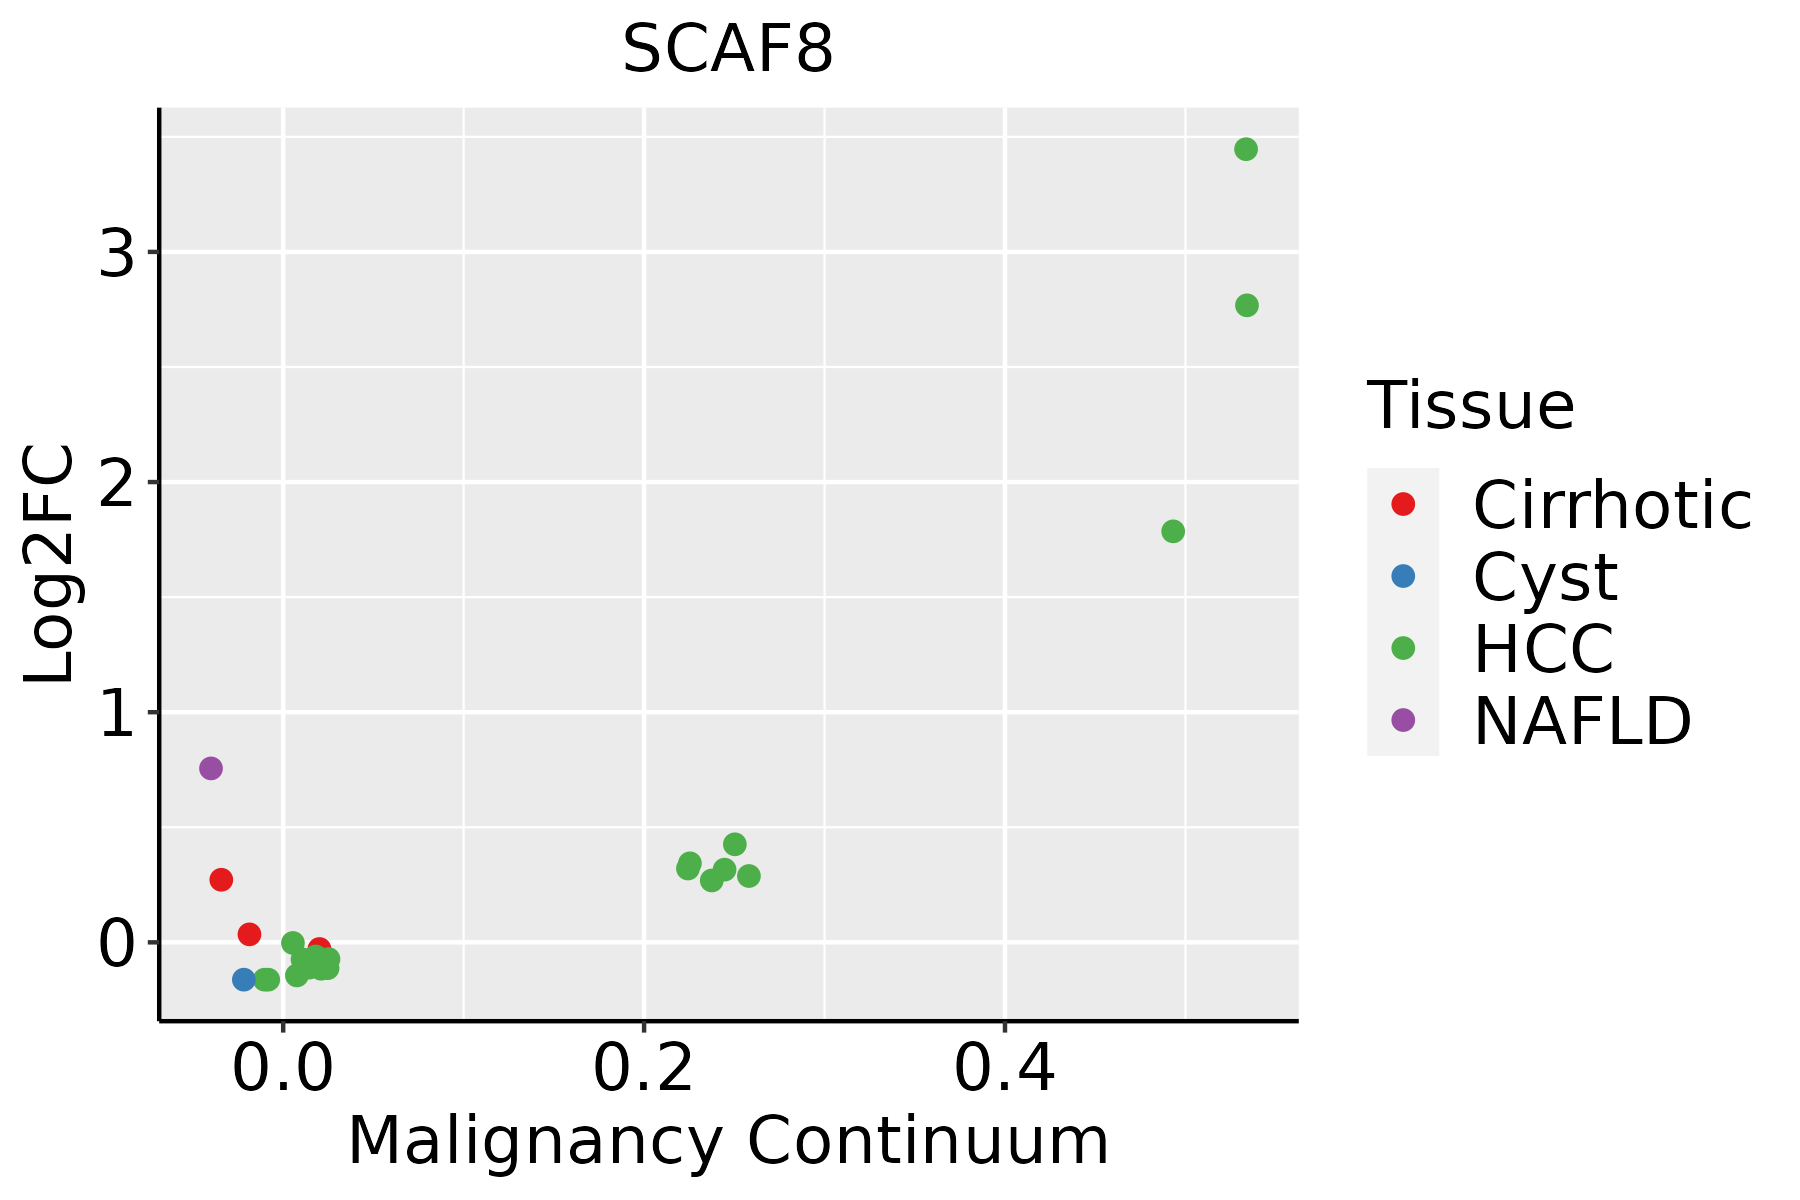
HCC: Hepatocellular carcinoma
NAFLD: Non-alcoholic fatty liver disease
LungThe image shows the transcriptomic changes along malignancy continuum.log2FC in expression of this searched gene in stem-like cells from each diseased tissue sample relative to stem-like cells in normal samples in each tissue plotted against the malignancy continuum. Samples are colored based on if they are from different disease stage.
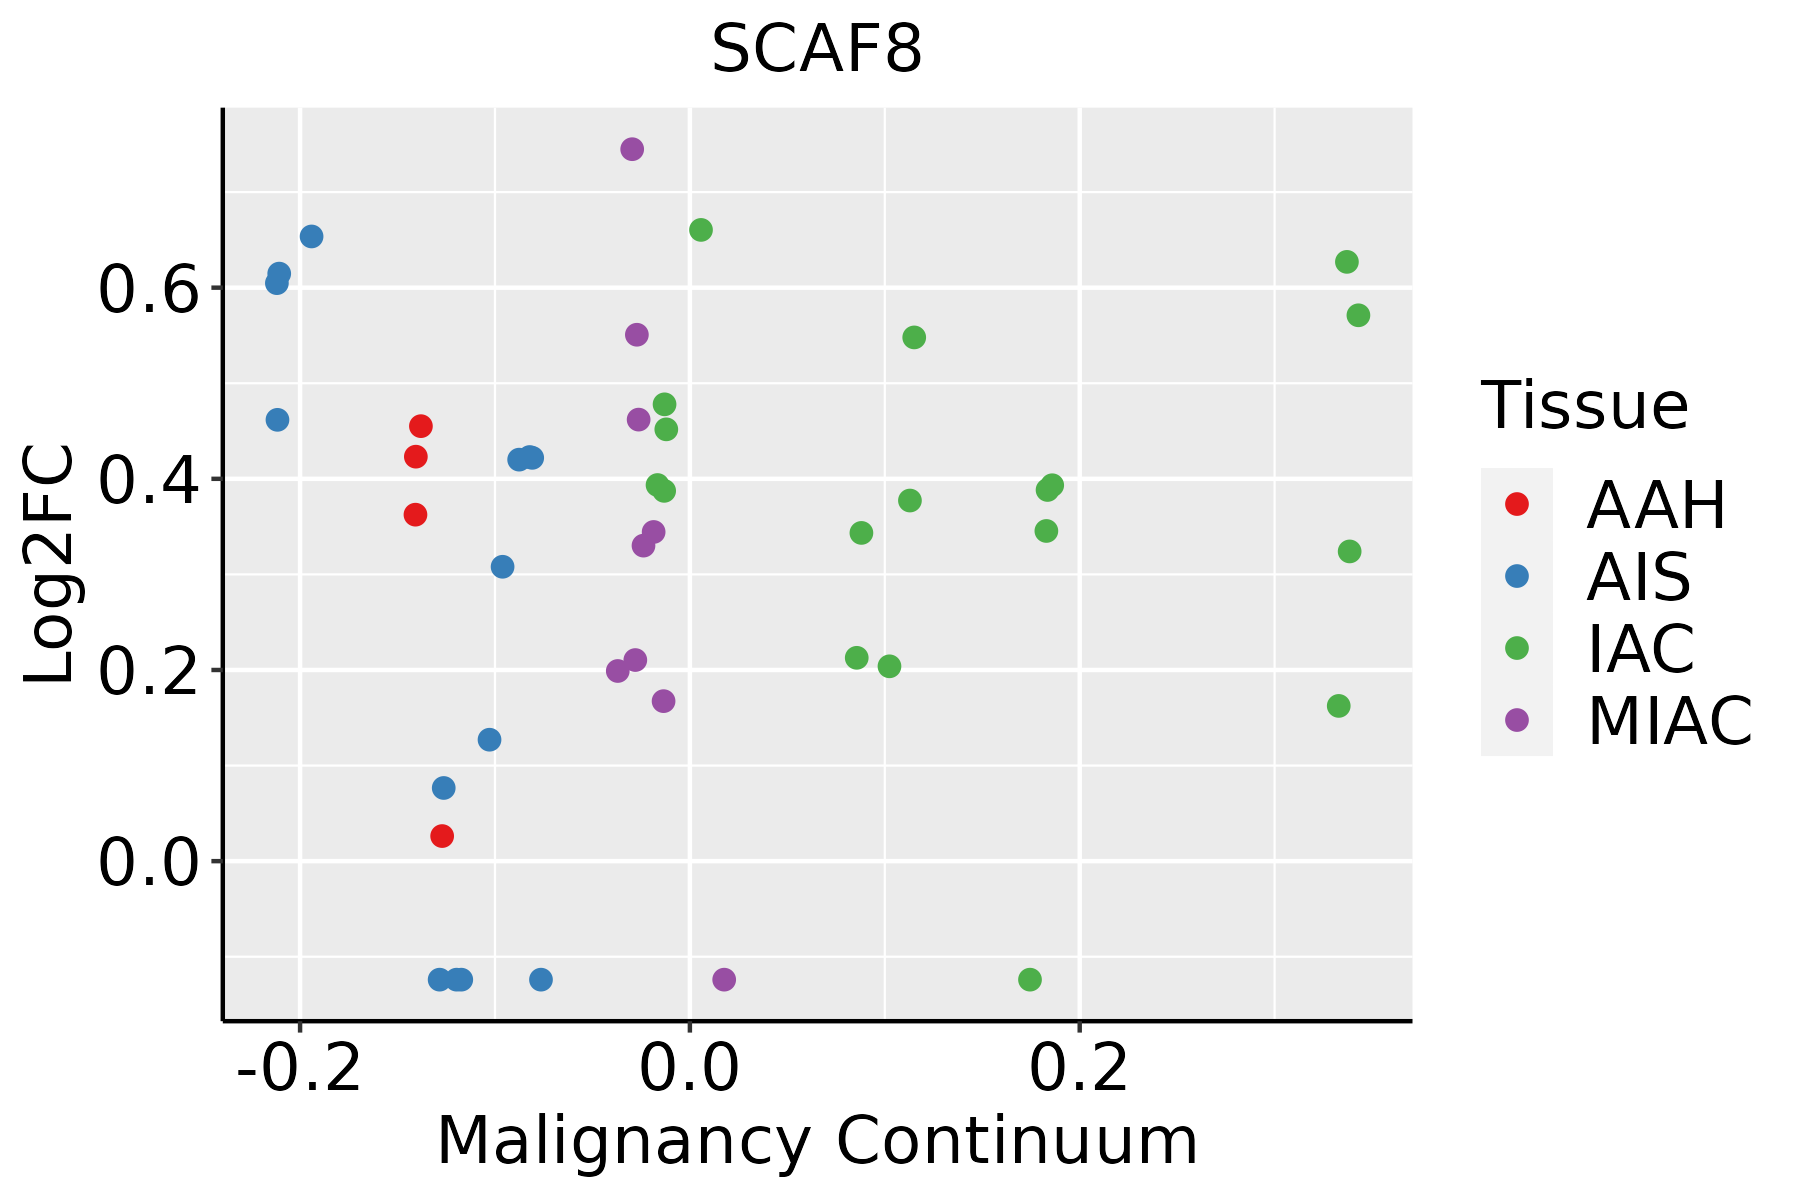
AAH: Atypical adenomatous hyperplasia
AIS: Adenocarcinoma in situ
IAC: Invasive lung adenocarcinoma
MIA: Minimally invasive adenocarcinoma
ProstateThe image shows the transcriptomic changes along malignancy continuum.log2FC in expression of this searched gene in stem-like cells from each diseased tissue sample relative to stem-like cells in normal samples in each tissue plotted against the malignancy continuum. Samples are colored based on if they are from different disease stage.BPH: Benign Prostatic Hyperplasia
∗log2FC in expression of this searched gene in stem-like cells from each diseased tissue sample relative to stem-like cells in normal samples in each tissue plotted against the malignancy continuum. Samples are colored based on if they are from different disease stage.

Top

Malignant transformation related pathway analysis

check buttonFind out the enriched GO biological processes and KEGG pathways involved in transition from healthy to precancer to cancer
check button Figure of enriched GO biological processes.
TissueDisease StageEnriched GO biological Processes
ColorectumADGO analysis - Figure of enriched GO biological processes: Top 15 enriched GO BP terms are showed in the bar plot of each disease state in each tissue. Each row represents a significant GO biological process which is colored according to the -log10(p.adjust).
ColorectumSERGO analysis - Figure of enriched GO biological processes: Top 15 enriched GO BP terms are showed in the bar plot of each disease state in each tissue. Each row represents a significant GO biological process which is colored according to the -log10(p.adjust).
ColorectumMSSGO analysis - Figure of enriched GO biological processes: Top 15 enriched GO BP terms are showed in the bar plot of each disease state in each tissue. Each row represents a significant GO biological process which is colored according to the -log10(p.adjust).
ColorectumMSI-HGO analysis - Figure of enriched GO biological processes: Top 15 enriched GO BP terms are showed in the bar plot of each disease state in each tissue. Each row represents a significant GO biological process which is colored according to the -log10(p.adjust).
ColorectumFAPGO analysis - Figure of enriched GO biological processes: Top 15 enriched GO BP terms are showed in the bar plot of each disease state in each tissue. Each row represents a significant GO biological process which is colored according to the -log10(p.adjust).
∗Top 15 enriched GO BP terms are showed in the bar plot of each disease state in each tissue. Each row represents a significant GO biological process which is colored according to the -log10(p.adjust).
Page: 1 2 3 4 5 6 7 8 9 

check button Enriched GO biological processes.
GO IDTissueDisease StageDescriptionGene RatioBg Ratiopvaluep.adjustCount
GO:002241110CervixCCcellular component disassembly83/2311443/187236.04e-058.68e-0483
GO:00329847CervixCCprotein-containing complex disassembly41/2311224/187236.13e-033.48e-0241
GO:00063545CervixCCDNA-templated transcription, elongation20/231191/187236.88e-033.74e-0220
GO:0022411ColorectumADcellular component disassembly147/3918443/187238.53e-106.76e-08147
GO:0032984ColorectumADprotein-containing complex disassembly81/3918224/187239.41e-084.65e-0681
GO:0043244ColorectumADregulation of protein-containing complex disassembly41/3918121/187236.22e-046.48e-0341
GO:0032786ColorectumADpositive regulation of DNA-templated transcription, elongation13/391827/187231.47e-031.25e-0213
GO:0043242ColorectumADnegative regulation of protein-containing complex disassembly29/391882/187231.76e-031.45e-0229
GO:0006354ColorectumADDNA-templated transcription, elongation31/391891/187232.46e-031.90e-0231
GO:00224112ColorectumMSScellular component disassembly130/3467443/187231.44e-088.46e-07130
GO:00329842ColorectumMSSprotein-containing complex disassembly69/3467224/187235.61e-061.50e-0469
GO:00063541ColorectumMSSDNA-templated transcription, elongation29/346791/187231.52e-031.39e-0229
GO:00327861ColorectumMSSpositive regulation of DNA-templated transcription, elongation12/346727/187231.74e-031.55e-0212
GO:00224114ColorectumFAPcellular component disassembly97/2622443/187233.44e-061.23e-0497
GO:00329844ColorectumFAPprotein-containing complex disassembly54/2622224/187233.37e-057.48e-0454
GO:00327862ColorectumFAPpositive regulation of DNA-templated transcription, elongation11/262227/187235.93e-046.58e-0311
GO:00063542ColorectumFAPDNA-templated transcription, elongation24/262291/187231.32e-031.22e-0224
GO:00432442ColorectumFAPregulation of protein-containing complex disassembly28/2622121/187234.50e-033.06e-0228
GO:00432421ColorectumFAPnegative regulation of protein-containing complex disassembly20/262282/187238.23e-034.82e-0220
GO:00329845ColorectumCRCprotein-containing complex disassembly46/2078224/187232.61e-057.18e-0446
Page: 1 2 3 4 

check button Enriched KEGG pathways.
Pathway IDTissueDisease StageDescriptionGene RatioBg Ratiopvaluep.adjustqvalueCount
Page: 1 

Top

Cell-cell communication analysis

check buttonIdentification of potential cell-cell interactions between two cell types and their ligand-receptor pairs for different disease states
LigandReceptorLRpairPathwayTissueDisease Stage
Page: 1 

Top

Single-cell gene regulatory network inference analysis

check buttonFind out the significant the regulons (TFs) and the target genes of each regulon across cell types for different disease states
TFCell TypeTissueDisease StageTarget GeneRSSRegulon Activity
∗The dot plots of a searched regulon are shown for all cell subpopulations in each disease state of each tissue based on the regulon specific score inferred using pySCENIC and by calculating the average expression.
Page: 1 

Top

Somatic mutation of malignant transformation related genes

check buttonAnnotation of somatic variants for genes involved in malignant transformation
Hugo SymbolVariant ClassVariant ClassificationdbSNP RSHGVScHGVSpHGVSp ShortSWISSPROTBIOTYPESIFTPolyPhenTumor Sample BarcodeTissueHistologySexAgeStageTherapy TypesDrugsOutcome
SCAF8SNVMissense_Mutationc.1592G>Ap.Arg531Lysp.R531Kprotein_codingtolerated(0.06)probably_damaging(0.913)TCGA-AC-A23H-01Breastbreast invasive carcinomaFemale>=65I/IIUnknownUnknownPD
SCAF8SNVMissense_Mutationrs754810889c.3604N>Tp.Arg1202Trpp.R1202Wprotein_codingdeleterious_low_confidence(0.02)probably_damaging(0.999)TCGA-AC-A6IW-01Breastbreast invasive carcinomaFemale>=65I/IIUnknownUnknownSD
SCAF8SNVMissense_Mutationrs200535713c.1448G>Ap.Arg483Glnp.R483Qprotein_codingtolerated_low_confidence(0.06)benign(0.007)TCGA-AN-A046-01Breastbreast invasive carcinomaFemale>=65I/IIUnknownUnknownSD
SCAF8SNVMissense_Mutationrs769802562c.3815G>Ap.Arg1272Glnp.R1272Qprotein_codingtolerated_low_confidence(0.25)probably_damaging(0.997)TCGA-AN-A046-01Breastbreast invasive carcinomaFemale>=65I/IIUnknownUnknownSD
SCAF8SNVMissense_Mutationc.3932N>Tp.Asp1311Valp.D1311Vprotein_codingdeleterious_low_confidence(0)probably_damaging(0.969)TCGA-AN-A0AM-01Breastbreast invasive carcinomaFemale<65I/IIUnknownUnknownSD
SCAF8SNVMissense_Mutationc.2075C>Gp.Thr692Argp.T692Rprotein_codingtolerated(0.05)probably_damaging(0.962)TCGA-D8-A1JJ-01Breastbreast invasive carcinomaFemale<65I/IIChemotherapydoxorubicineSD
SCAF8SNVMissense_Mutationc.1091N>Tp.Ser364Leup.S364Lprotein_codingdeleterious(0)benign(0.196)TCGA-GM-A2DH-01Breastbreast invasive carcinomaFemale<65I/IIChemotherapytaxolCR
SCAF8SNVMissense_Mutationnovelc.3047N>Ap.Arg1016Lysp.R1016Kprotein_codingdeleterious_low_confidence(0)possibly_damaging(0.839)TCGA-OL-A66K-01Breastbreast invasive carcinomaFemale>=65I/IIUnknownUnknownSD
SCAF8insertionNonsense_Mutationnovelc.1690_1691insCCATGCCCGGCCAGTATTTTAGACTAATATTATTACTGGTCATCATTTp.Lys564delinsThrMetProGlyGlnTyrPheArgLeuIleLeuLeuLeuValIleIleTerp.K564delinsTMPGQYFRLILLLVII*protein_codingTCGA-B6-A0X1-01Breastbreast invasive carcinomaFemale<65I/IIUnknownUnknownPD
SCAF8deletionFrame_Shift_Delnovelc.2832_2845delNNNNNNNNNNNNNNp.Gly945AlafsTer7p.G945Afs*7protein_codingTCGA-B6-A400-01Breastbreast invasive carcinomaFemale<65III/IVUnknownUnknownSD
Page: 1 2 3 4 5 6 7 8 9 10 11 12 13 14 15 

Top

Related drugs of malignant transformation related genes

check buttonIdentification of chemicals and drugs interact with genes involved in malignant transfromation
(DGIdb 4.0)
Entrez IDSymbolCategoryInteraction TypesDrug Claim NameDrug NamePMIDs
Page: 1