
|
|||||
|
 | |
| |
| |
| |
| |
| |
|
Gene: SCAF4 |
Gene summary for SCAF4 |
| Gene information | Species | Human | Gene symbol | SCAF4 | Gene ID | 57466 |
| Gene name | SR-related CTD associated factor 4 | |
| Gene Alias | SFRS15 | |
| Cytomap | 21q22.11 | |
| Gene Type | protein-coding | GO ID | GO:0000122 | UniProtAcc | O95104 |
Top |
Malignant transformation analysis |
| Identification of the aberrant gene expression in precancerous and cancerous lesions by comparing the gene expression of stem-like cells in diseased tissues with normal stem cells |
| Entrez ID | Symbol | Replicates | Species | Organ | Tissue | Adj P-value | Log2FC | Malignancy |
| 57466 | SCAF4 | LZE4T | Human | Esophagus | ESCC | 4.39e-10 | 1.59e-01 | 0.0811 |
| 57466 | SCAF4 | LZE22T | Human | Esophagus | ESCC | 4.86e-03 | 1.68e-01 | 0.068 |
| 57466 | SCAF4 | LZE24T | Human | Esophagus | ESCC | 1.69e-07 | 1.13e-01 | 0.0596 |
| 57466 | SCAF4 | LZE21T | Human | Esophagus | ESCC | 3.08e-02 | 2.04e-01 | 0.0655 |
| 57466 | SCAF4 | P1T-E | Human | Esophagus | ESCC | 8.23e-05 | 2.25e-01 | 0.0875 |
| 57466 | SCAF4 | P2T-E | Human | Esophagus | ESCC | 6.06e-24 | 4.51e-01 | 0.1177 |
| 57466 | SCAF4 | P4T-E | Human | Esophagus | ESCC | 6.73e-13 | 3.41e-01 | 0.1323 |
| 57466 | SCAF4 | P5T-E | Human | Esophagus | ESCC | 2.49e-15 | 2.20e-01 | 0.1327 |
| 57466 | SCAF4 | P8T-E | Human | Esophagus | ESCC | 3.51e-20 | 1.66e-01 | 0.0889 |
| 57466 | SCAF4 | P9T-E | Human | Esophagus | ESCC | 1.36e-06 | 1.07e-01 | 0.1131 |
| 57466 | SCAF4 | P10T-E | Human | Esophagus | ESCC | 9.54e-25 | 4.26e-01 | 0.116 |
| 57466 | SCAF4 | P11T-E | Human | Esophagus | ESCC | 1.97e-13 | 4.34e-01 | 0.1426 |
| 57466 | SCAF4 | P12T-E | Human | Esophagus | ESCC | 1.61e-21 | 3.50e-01 | 0.1122 |
| 57466 | SCAF4 | P15T-E | Human | Esophagus | ESCC | 3.61e-16 | 2.46e-01 | 0.1149 |
| 57466 | SCAF4 | P16T-E | Human | Esophagus | ESCC | 3.39e-18 | 3.57e-01 | 0.1153 |
| 57466 | SCAF4 | P17T-E | Human | Esophagus | ESCC | 1.62e-02 | 2.04e-01 | 0.1278 |
| 57466 | SCAF4 | P19T-E | Human | Esophagus | ESCC | 8.44e-06 | 2.05e-01 | 0.1662 |
| 57466 | SCAF4 | P20T-E | Human | Esophagus | ESCC | 6.49e-16 | 2.07e-01 | 0.1124 |
| 57466 | SCAF4 | P21T-E | Human | Esophagus | ESCC | 8.12e-17 | 2.48e-01 | 0.1617 |
| 57466 | SCAF4 | P22T-E | Human | Esophagus | ESCC | 1.44e-20 | 2.11e-01 | 0.1236 |
| Page: 1 2 3 4 5 |
| Tissue | Expression Dynamics | Abbreviation |
| Esophagus | 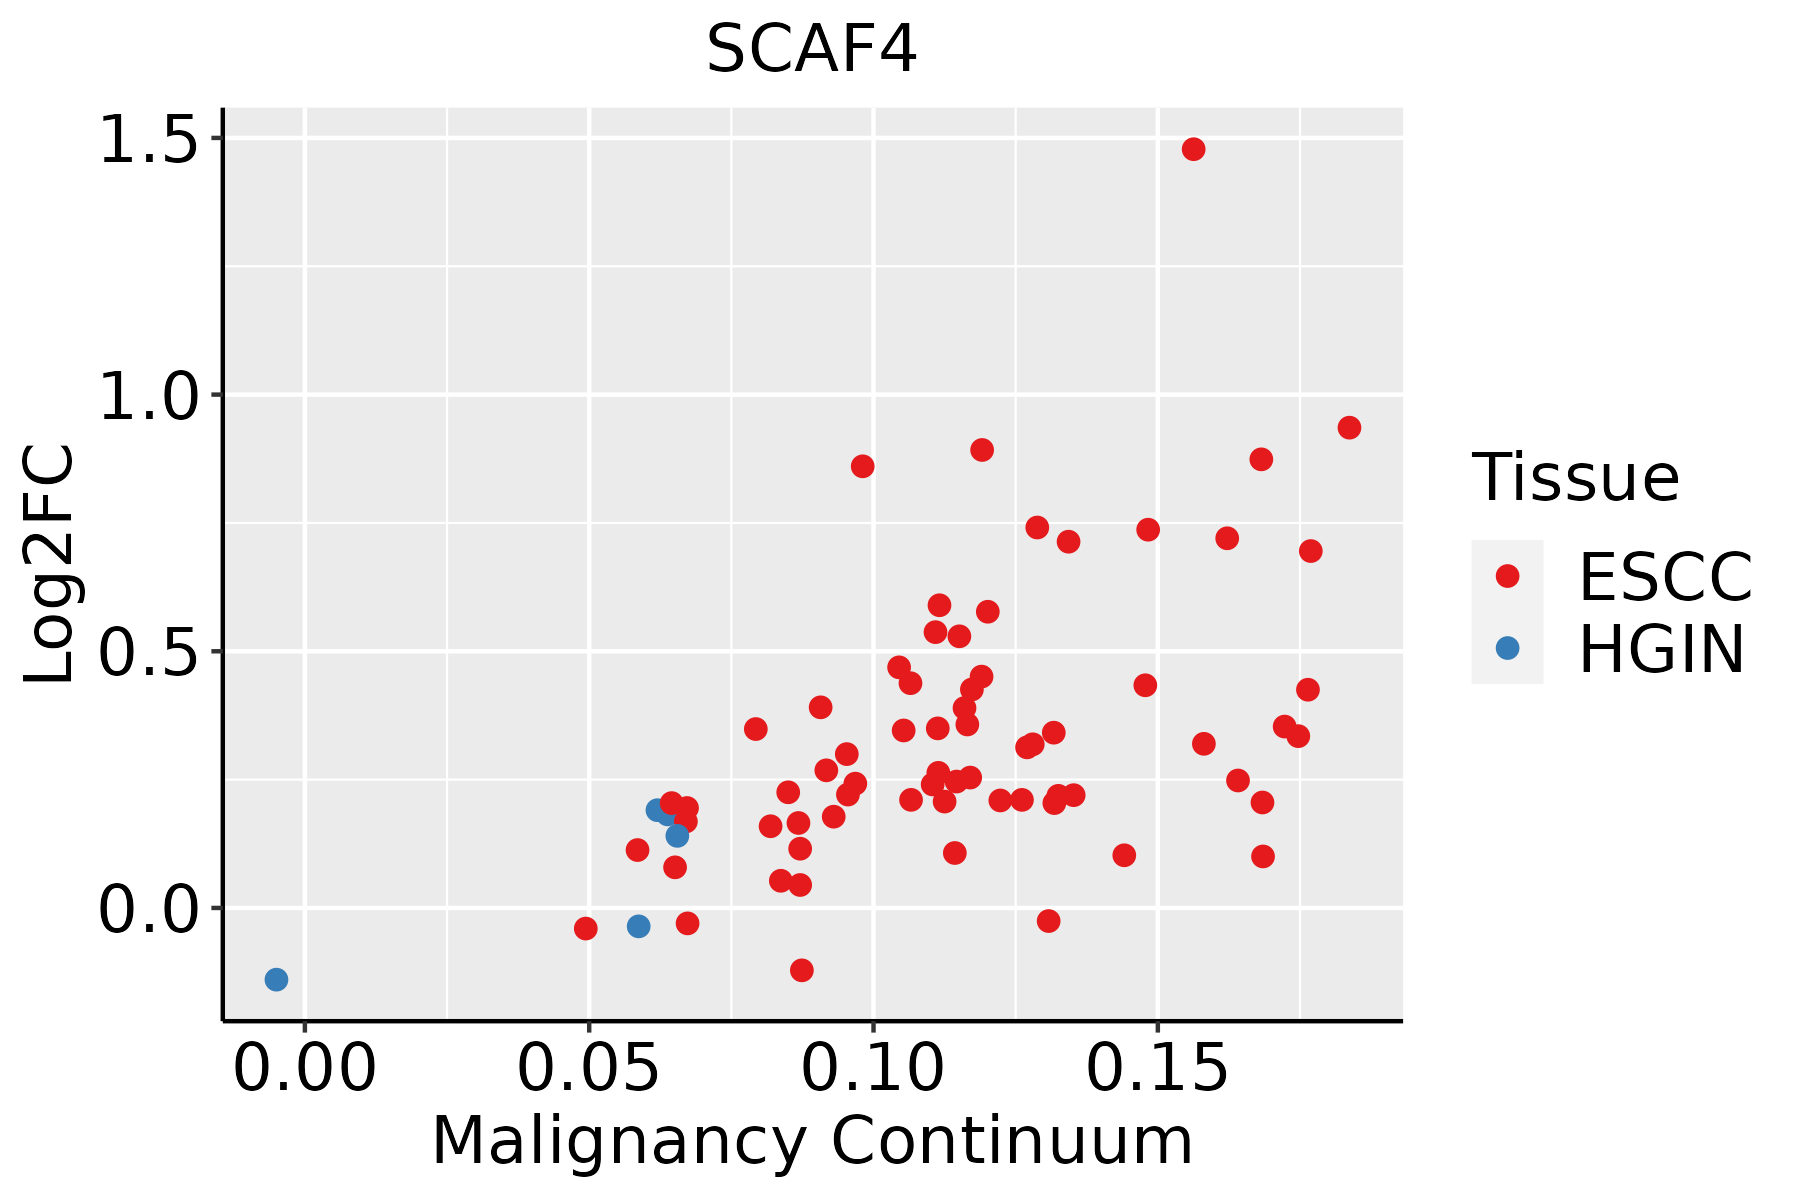 | ESCC: Esophageal squamous cell carcinoma |
| HGIN: High-grade intraepithelial neoplasias | ||
| LGIN: Low-grade intraepithelial neoplasias | ||
| Lung | 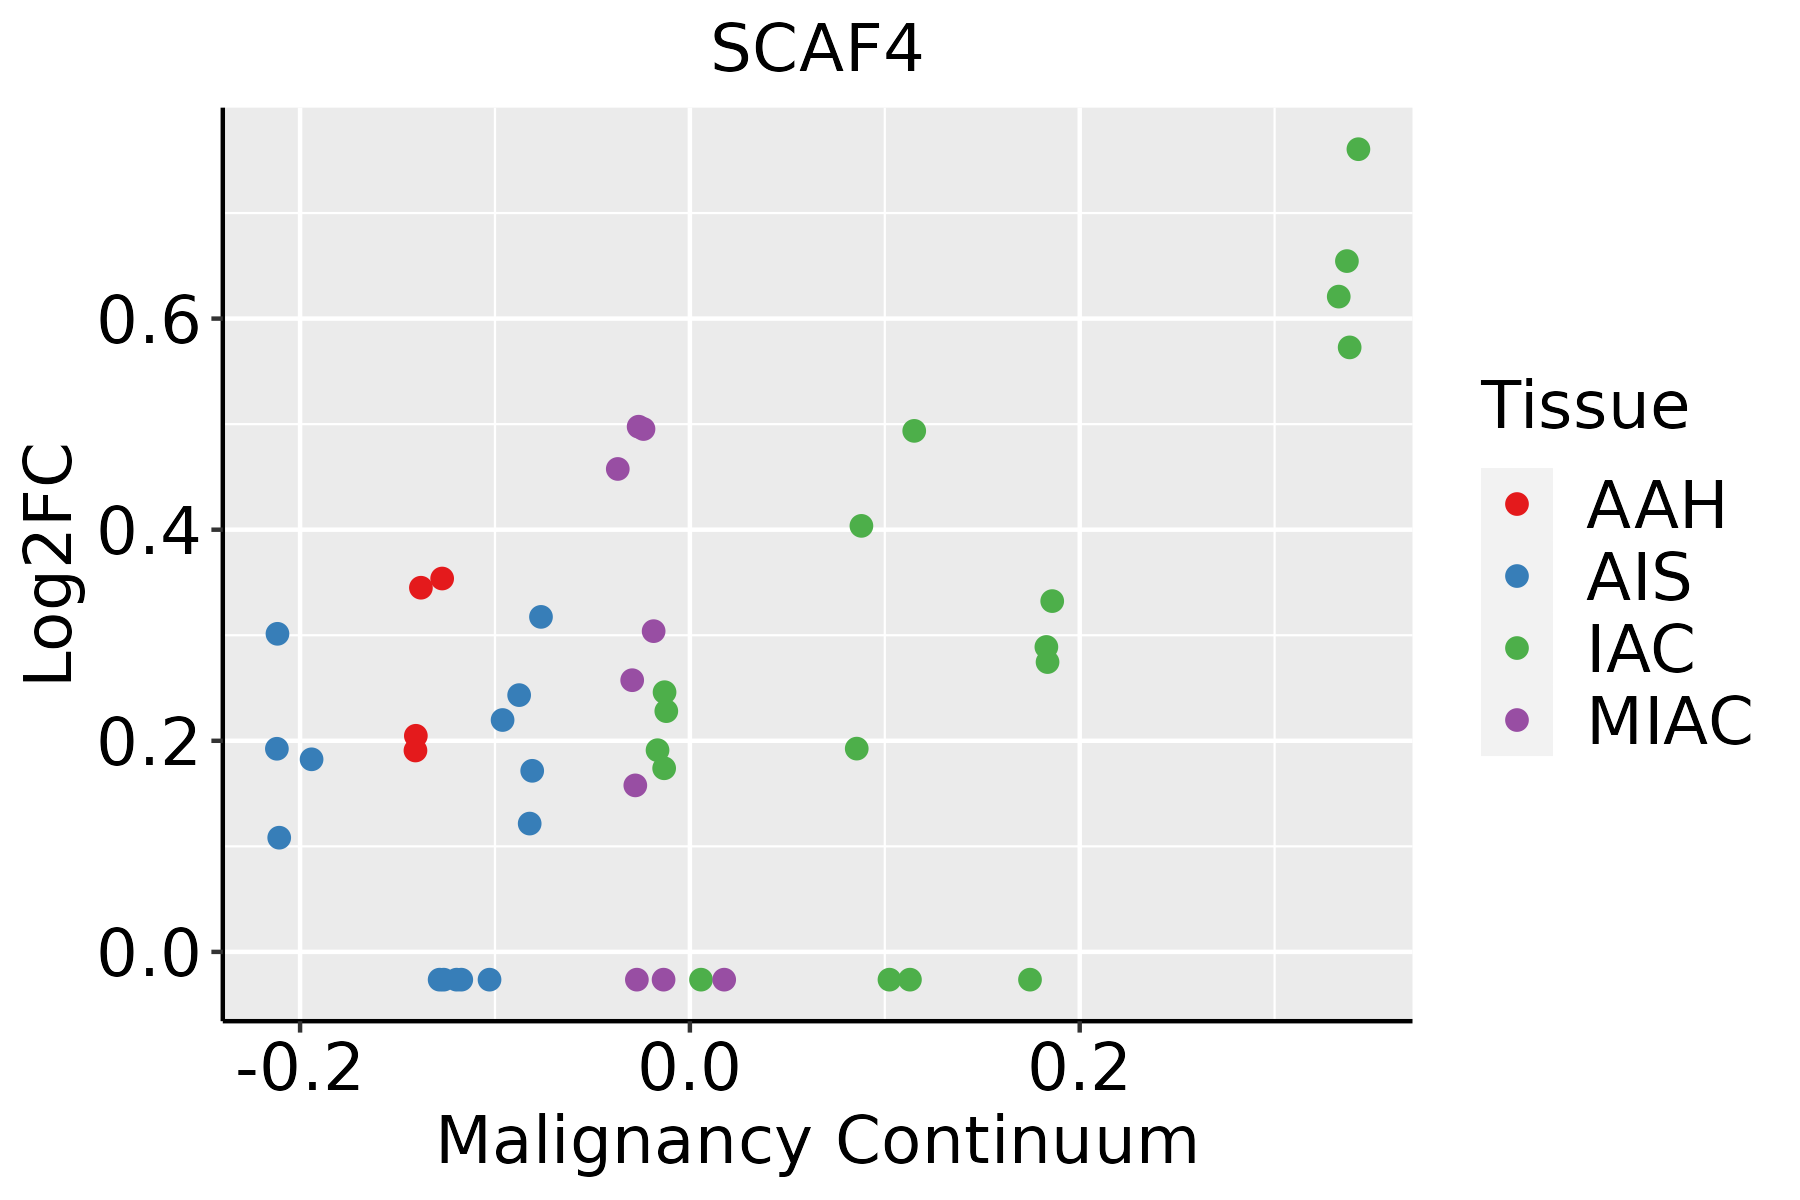 | AAH: Atypical adenomatous hyperplasia |
| AIS: Adenocarcinoma in situ | ||
| IAC: Invasive lung adenocarcinoma | ||
| MIA: Minimally invasive adenocarcinoma | ||
| Oral Cavity | 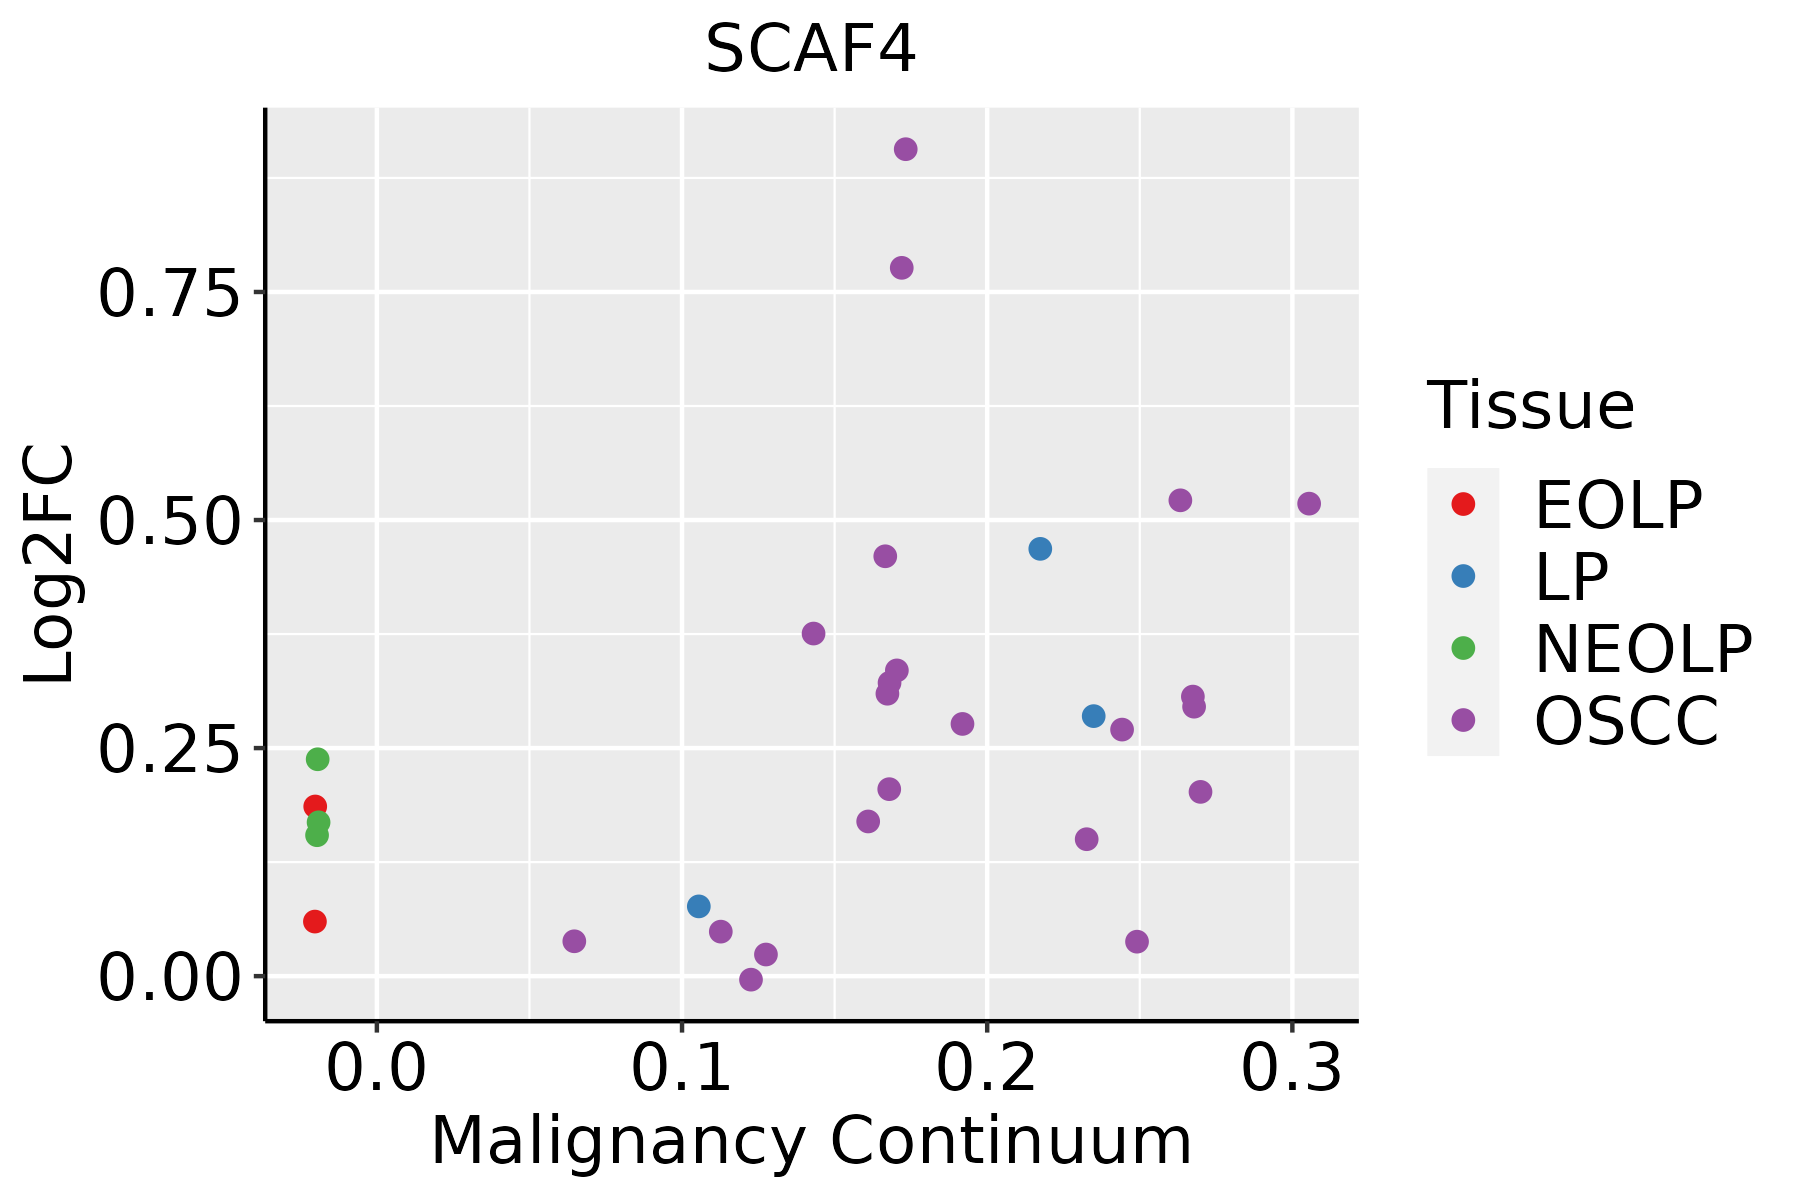 | EOLP: Erosive Oral lichen planus |
| LP: leukoplakia | ||
| NEOLP: Non-erosive oral lichen planus | ||
| OSCC: Oral squamous cell carcinoma |
| ∗log2FC in expression of this searched gene in stem-like cells from each diseased tissue sample relative to stem-like cells in normal samples in each tissue plotted against the malignancy continuum. Samples are colored based on if they are from different disease stage. |
Top |
Malignant transformation related pathway analysis |
| Find out the enriched GO biological processes and KEGG pathways involved in transition from healthy to precancer to cancer |
| Tissue | Disease Stage | Enriched GO biological Processes |
| Colorectum | AD |  |
| Colorectum | SER |  |
| Colorectum | MSS |  |
| Colorectum | MSI-H |  |
| Colorectum | FAP |  |
| ∗Top 15 enriched GO BP terms are showed in the bar plot of each disease state in each tissue. Each row represents a significant GO biological process which is colored according to the -log10(p.adjust). |
| Page: 1 2 3 4 5 6 7 8 9 |
| GO ID | Tissue | Disease Stage | Description | Gene Ratio | Bg Ratio | pvalue | p.adjust | Count |
| GO:0022411111 | Esophagus | ESCC | cellular component disassembly | 305/8552 | 443/18723 | 1.94e-23 | 4.57e-21 | 305 |
| GO:003298416 | Esophagus | ESCC | protein-containing complex disassembly | 151/8552 | 224/18723 | 3.45e-11 | 1.15e-09 | 151 |
| GO:00432446 | Esophagus | ESCC | regulation of protein-containing complex disassembly | 75/8552 | 121/18723 | 2.17e-04 | 1.36e-03 | 75 |
| GO:00063532 | Esophagus | ESCC | DNA-templated transcription, termination | 15/8552 | 21/18723 | 1.54e-02 | 4.96e-02 | 15 |
| GO:00432422 | Lung | IAC | negative regulation of protein-containing complex disassembly | 19/2061 | 82/18723 | 1.23e-03 | 1.42e-02 | 19 |
| GO:00224118 | Lung | IAC | cellular component disassembly | 68/2061 | 443/18723 | 2.89e-03 | 2.60e-02 | 68 |
| GO:002241119 | Oral cavity | OSCC | cellular component disassembly | 283/7305 | 443/18723 | 9.57e-27 | 3.37e-24 | 283 |
| GO:003298410 | Oral cavity | OSCC | protein-containing complex disassembly | 136/7305 | 224/18723 | 3.42e-11 | 1.13e-09 | 136 |
| GO:00432445 | Oral cavity | OSCC | regulation of protein-containing complex disassembly | 65/7305 | 121/18723 | 7.08e-04 | 3.90e-03 | 65 |
| GO:002241121 | Oral cavity | EOLP | cellular component disassembly | 94/2218 | 443/18723 | 1.00e-08 | 4.89e-07 | 94 |
| GO:003298421 | Oral cavity | EOLP | protein-containing complex disassembly | 48/2218 | 224/18723 | 3.01e-05 | 4.30e-04 | 48 |
| GO:004324411 | Oral cavity | EOLP | regulation of protein-containing complex disassembly | 24/2218 | 121/18723 | 7.53e-03 | 3.62e-02 | 24 |
| GO:002241131 | Oral cavity | NEOLP | cellular component disassembly | 87/2005 | 443/18723 | 1.39e-08 | 6.46e-07 | 87 |
| GO:004324421 | Oral cavity | NEOLP | regulation of protein-containing complex disassembly | 29/2005 | 121/18723 | 2.33e-05 | 3.72e-04 | 29 |
| GO:003298431 | Oral cavity | NEOLP | protein-containing complex disassembly | 45/2005 | 224/18723 | 2.33e-05 | 3.72e-04 | 45 |
| GO:00432423 | Oral cavity | NEOLP | negative regulation of protein-containing complex disassembly | 18/2005 | 82/18723 | 2.28e-03 | 1.47e-02 | 18 |
| Page: 1 |
| Pathway ID | Tissue | Disease Stage | Description | Gene Ratio | Bg Ratio | pvalue | p.adjust | qvalue | Count |
| Page: 1 |
Top |
Cell-cell communication analysis |
| Identification of potential cell-cell interactions between two cell types and their ligand-receptor pairs for different disease states |
| Ligand | Receptor | LRpair | Pathway | Tissue | Disease Stage |
| Page: 1 |
Top |
Single-cell gene regulatory network inference analysis |
| Find out the significant the regulons (TFs) and the target genes of each regulon across cell types for different disease states |
| TF | Cell Type | Tissue | Disease Stage | Target Gene | RSS | Regulon Activity |
| ∗The dot plots of a searched regulon are shown for all cell subpopulations in each disease state of each tissue based on the regulon specific score inferred using pySCENIC and by calculating the average expression. |
| Page: 1 |
Top |
Somatic mutation of malignant transformation related genes |
| Annotation of somatic variants for genes involved in malignant transformation |
| Hugo Symbol | Variant Class | Variant Classification | dbSNP RS | HGVSc | HGVSp | HGVSp Short | SWISSPROT | BIOTYPE | SIFT | PolyPhen | Tumor Sample Barcode | Tissue | Histology | Sex | Age | Stage | Therapy Types | Drugs | Outcome |
| SCAF4 | SNV | Missense_Mutation | novel | c.261N>C | p.Arg87Ser | p.R87S | O95104 | protein_coding | deleterious(0) | probably_damaging(0.998) | TCGA-AN-A046-01 | Breast | breast invasive carcinoma | Female | >=65 | I/II | Unknown | Unknown | SD |
| SCAF4 | SNV | Missense_Mutation | novel | c.1169N>C | p.Val390Ala | p.V390A | O95104 | protein_coding | deleterious_low_confidence(0.03) | benign(0.022) | TCGA-AO-A0J9-01 | Breast | breast invasive carcinoma | Female | <65 | III/IV | Chemotherapy | cyclophosphamide | PD |
| SCAF4 | SNV | Missense_Mutation | c.212N>A | p.Arg71Gln | p.R71Q | O95104 | protein_coding | deleterious(0) | probably_damaging(0.995) | TCGA-BH-A0C3-01 | Breast | breast invasive carcinoma | Female | <65 | I/II | Chemotherapy | adriamycin | PD | |
| SCAF4 | SNV | Missense_Mutation | c.814G>A | p.Glu272Lys | p.E272K | O95104 | protein_coding | deleterious(0) | possibly_damaging(0.787) | TCGA-BH-A18U-01 | Breast | breast invasive carcinoma | Female | >=65 | III/IV | Unknown | Unknown | SD | |
| SCAF4 | SNV | Missense_Mutation | c.82N>G | p.Leu28Val | p.L28V | O95104 | protein_coding | tolerated(0.07) | benign(0.444) | TCGA-C8-A26Y-01 | Breast | breast invasive carcinoma | Female | >=65 | I/II | Unknown | Unknown | SD | |
| SCAF4 | SNV | Missense_Mutation | c.2810N>A | p.Arg937Lys | p.R937K | O95104 | protein_coding | tolerated_low_confidence(0.11) | benign(0.262) | TCGA-D8-A27G-01 | Breast | breast invasive carcinoma | Female | >=65 | I/II | Unknown | Unknown | SD | |
| SCAF4 | SNV | Missense_Mutation | novel | c.1406G>C | p.Arg469Thr | p.R469T | O95104 | protein_coding | deleterious_low_confidence(0) | probably_damaging(0.991) | TCGA-OL-A5D7-01 | Breast | breast invasive carcinoma | Female | >=65 | I/II | Chemotherapy | cytoxan | CR |
| SCAF4 | insertion | Frame_Shift_Ins | novel | c.3432_3433insAG | p.Ala1145ArgfsTer10 | p.A1145Rfs*10 | O95104 | protein_coding | TCGA-A2-A0SY-01 | Breast | breast invasive carcinoma | Female | <65 | III/IV | Hormone Therapy | arimidex | SD | ||
| SCAF4 | insertion | Frame_Shift_Ins | novel | c.1328_1329insTCAAGAAAGACGGGATCGAGAAAAAGAGAGAGAACGTCGACAAAAA | p.Lys444GlnfsTer21 | p.K444Qfs*21 | O95104 | protein_coding | TCGA-A8-A09N-01 | Breast | breast invasive carcinoma | Female | <65 | III/IV | Unknown | Unknown | SD | ||
| SCAF4 | insertion | Frame_Shift_Ins | novel | c.213_214insGGGTT | p.Gln72GlyfsTer23 | p.Q72Gfs*23 | O95104 | protein_coding | TCGA-B6-A0IB-01 | Breast | breast invasive carcinoma | Female | <65 | III/IV | Unknown | Unknown | PD |
| Page: 1 2 3 4 5 6 7 8 9 10 11 12 13 14 15 16 17 18 19 |
Top |
Related drugs of malignant transformation related genes |
| Identification of chemicals and drugs interact with genes involved in malignant transfromation |
| (DGIdb 4.0) |
| Entrez ID | Symbol | Category | Interaction Types | Drug Claim Name | Drug Name | PMIDs |
| Page: 1 |

Copyright 2023-Present -The University of Texas Health Science Center at Houston |