Schematic overview of the cellular and molecular mechanisms involved in the cancer progression, including the proposed cellular and molecular mechanisms in cancer cells trajectory. AT1: alveolar type 1 cells; AT2: alveolar type 2 cells; AAH: atypical adenomatous hyperplasia; AIS: adenocarcinoma in situ; MIA: minimally invasive adenocarcinoma; IA: invasive adenocarcinoma; EMT: epithelial-mesenchymal transition

Home

Download

Statistics

Help

Contact

Center for Computational Systems Medicine
leaf

Gene summary

leaf

Malignant transformation analysis

leaf

Malignant transformation related pathway analysis

leaf

Cell-cell communication analysis

leaf

Single-cell gene regulatory network inference analysis

leaf

Somatic mutation of malignant transformation related genes

leaf

Related drugs of malignant transformation related genes

Gene: SCAF1

Gene summary for SCAF1

check button Gene summary.

Gene informationSpeciesHuman
Gene symbol

SCAF1

Gene ID

58506

Gene nameSR-related CTD associated factor 1
Gene AliasSRA1
Cytomap19q13.33
Gene Typeprotein-coding
GO ID

GO:0006139

UniProtAcc

Q9H7N4


Top

Malignant transformation analysis

check button Identification of the aberrant gene expression in precancerous and cancerous lesions by comparing the gene expression of stem-like cells in diseased tissues with normal stem cells
check button Malignant transformation involving gene list.
Entrez IDSymbolReplicatesSpeciesOrganTissueAdj P-valueLog2FCMalignancy
58506SCAF1LZE2THumanEsophagusESCC2.21e-034.70e-010.082
58506SCAF1LZE4THumanEsophagusESCC5.21e-071.87e-010.0811
58506SCAF1LZE5THumanEsophagusESCC1.13e-032.63e-010.0514
58506SCAF1LZE7THumanEsophagusESCC8.13e-052.90e-010.0667
58506SCAF1LZE8THumanEsophagusESCC2.91e-031.22e-010.067
58506SCAF1LZE20THumanEsophagusESCC6.52e-091.74e-010.0662
58506SCAF1LZE22D1HumanEsophagusHGIN3.15e-041.75e-010.0595
58506SCAF1LZE22THumanEsophagusESCC4.93e-033.18e-010.068
58506SCAF1LZE24THumanEsophagusESCC1.78e-143.46e-010.0596
58506SCAF1LZE6THumanEsophagusESCC2.31e-021.91e-010.0845
58506SCAF1P1T-EHumanEsophagusESCC1.20e-115.55e-010.0875
58506SCAF1P2T-EHumanEsophagusESCC2.06e-113.07e-010.1177
58506SCAF1P4T-EHumanEsophagusESCC1.70e-112.95e-010.1323
58506SCAF1P5T-EHumanEsophagusESCC5.14e-081.62e-010.1327
58506SCAF1P8T-EHumanEsophagusESCC9.06e-518.45e-010.0889
58506SCAF1P9T-EHumanEsophagusESCC1.26e-112.33e-010.1131
58506SCAF1P10T-EHumanEsophagusESCC7.48e-284.84e-010.116
58506SCAF1P11T-EHumanEsophagusESCC2.72e-114.08e-010.1426
58506SCAF1P12T-EHumanEsophagusESCC7.40e-183.82e-010.1122
58506SCAF1P15T-EHumanEsophagusESCC1.42e-224.59e-010.1149
Page: 1 2 3 4 5 6 

check button Transcriptomic changes along malignancy continuum.
TissueExpression DynamicsAbbreviation
EsophagusThe image shows the transcriptomic changes along malignancy continuum.log2FC in expression of this searched gene in stem-like cells from each diseased tissue sample relative to stem-like cells in normal samples in each tissue plotted against the malignancy continuum. Samples are colored based on if they are from different disease stage.
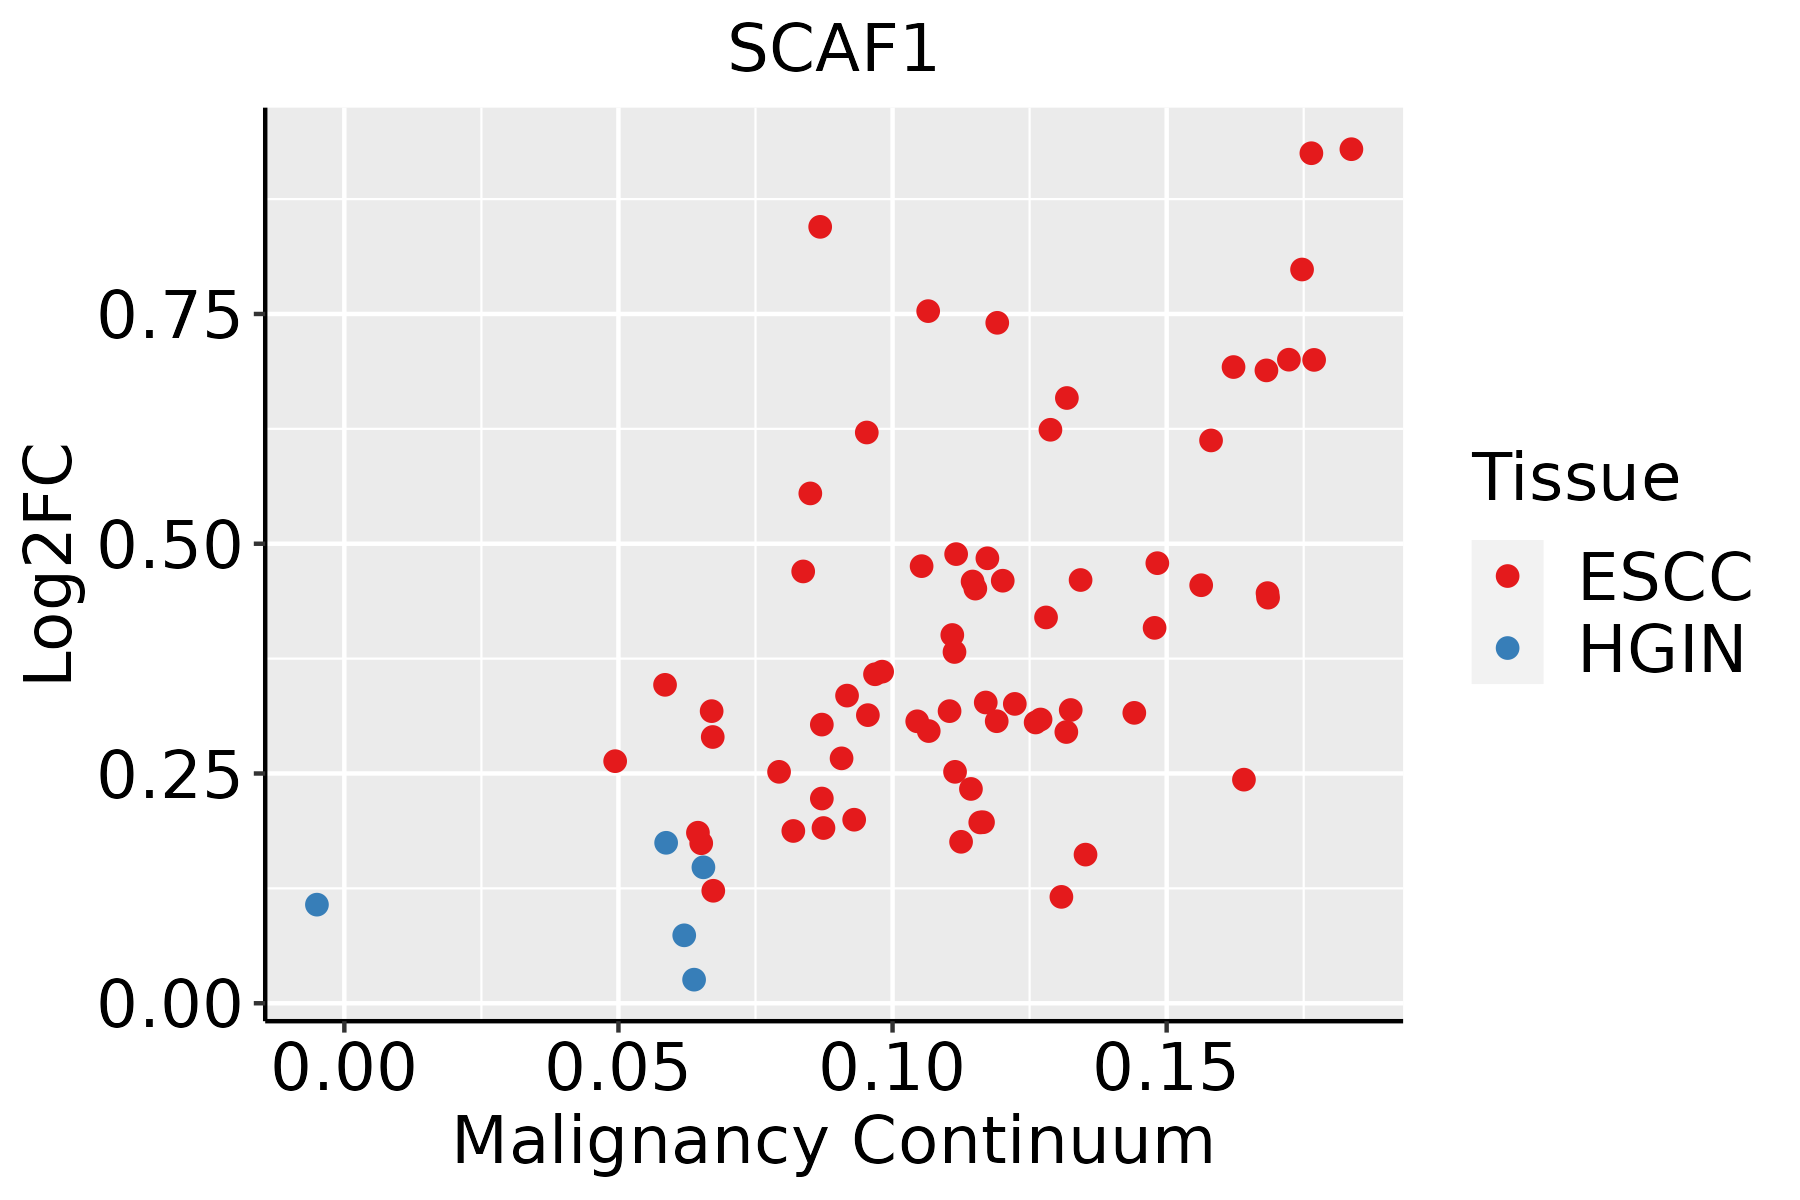
ESCC: Esophageal squamous cell carcinoma
HGIN: High-grade intraepithelial neoplasias
LGIN: Low-grade intraepithelial neoplasias
LiverThe image shows the transcriptomic changes along malignancy continuum.log2FC in expression of this searched gene in stem-like cells from each diseased tissue sample relative to stem-like cells in normal samples in each tissue plotted against the malignancy continuum. Samples are colored based on if they are from different disease stage.HCC: Hepatocellular carcinoma
NAFLD: Non-alcoholic fatty liver disease
Oral CavityThe image shows the transcriptomic changes along malignancy continuum.log2FC in expression of this searched gene in stem-like cells from each diseased tissue sample relative to stem-like cells in normal samples in each tissue plotted against the malignancy continuum. Samples are colored based on if they are from different disease stage.
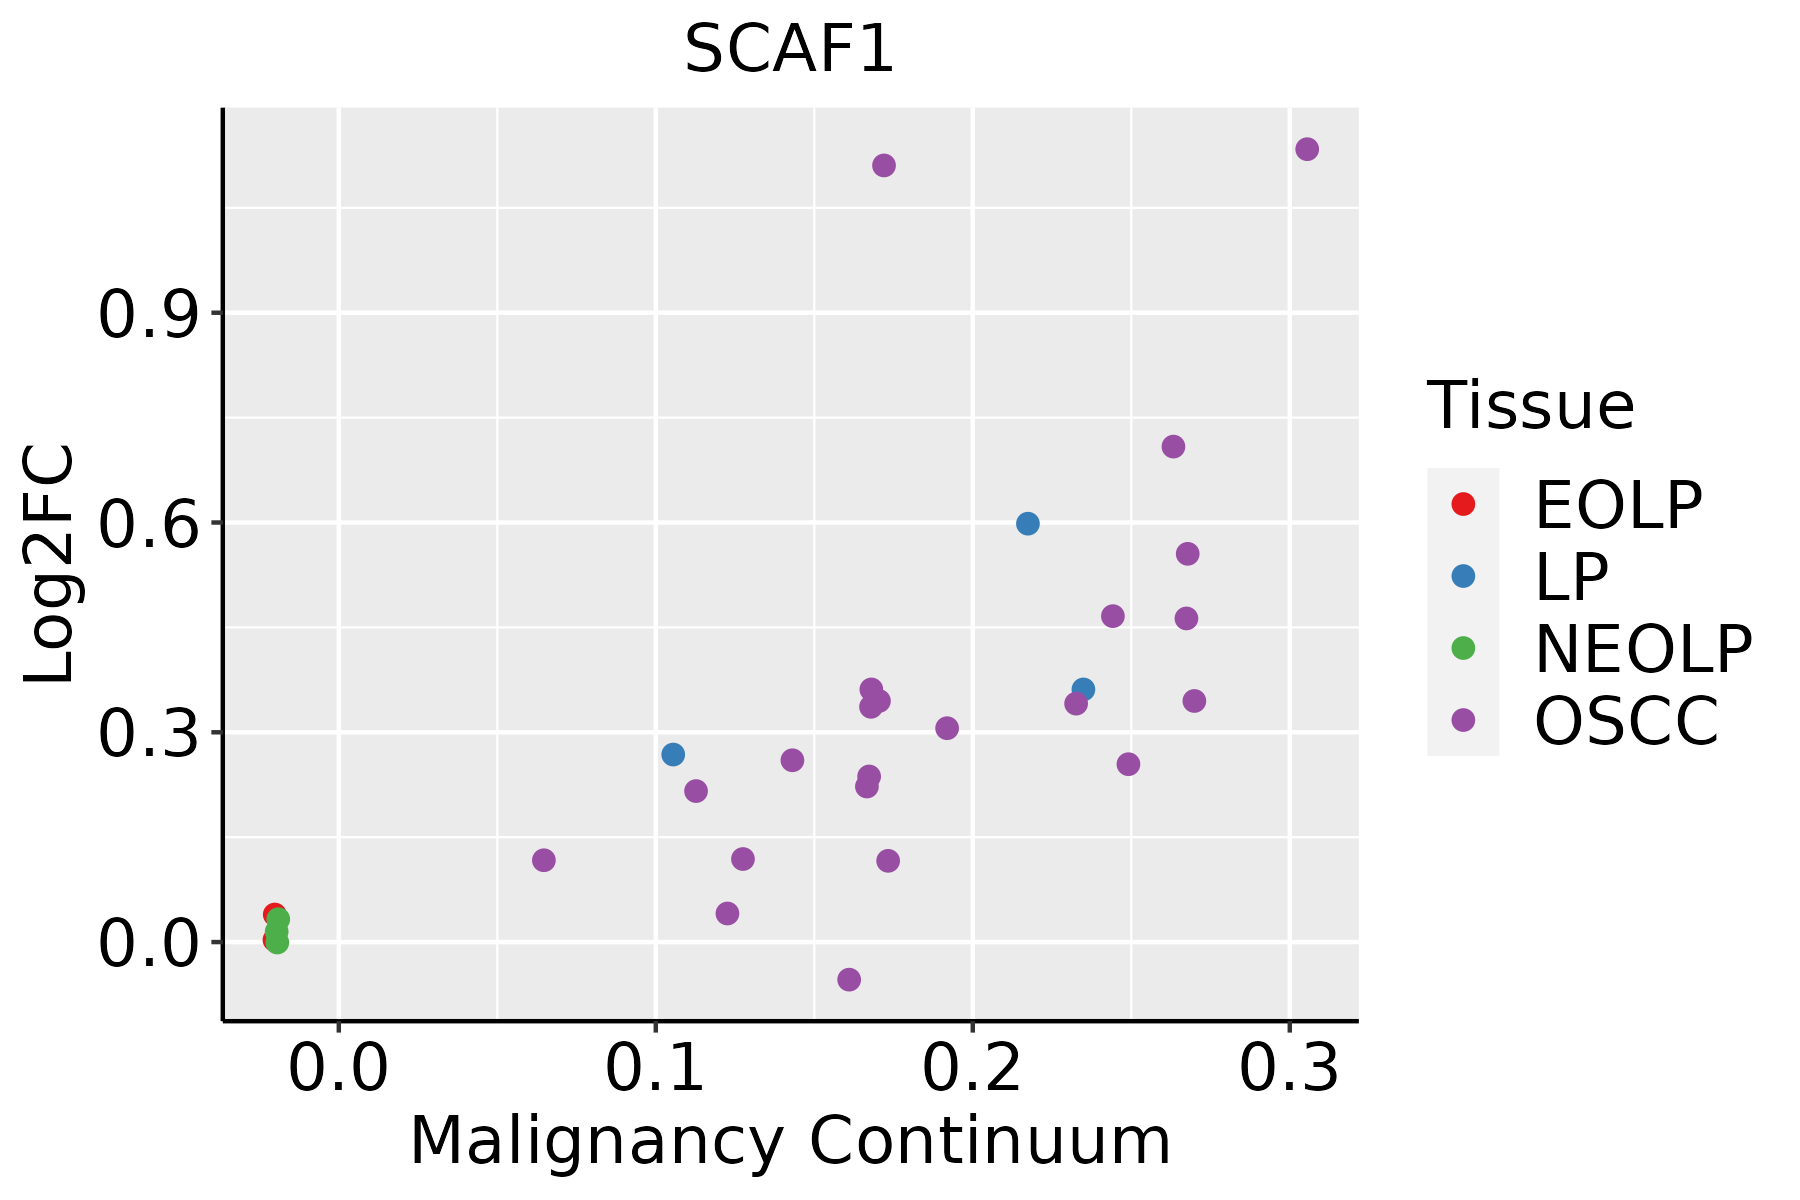
EOLP: Erosive Oral lichen planus
LP: leukoplakia
NEOLP: Non-erosive oral lichen planus
OSCC: Oral squamous cell carcinoma
ThyroidThe image shows the transcriptomic changes along malignancy continuum.log2FC in expression of this searched gene in stem-like cells from each diseased tissue sample relative to stem-like cells in normal samples in each tissue plotted against the malignancy continuum. Samples are colored based on if they are from different disease stage.
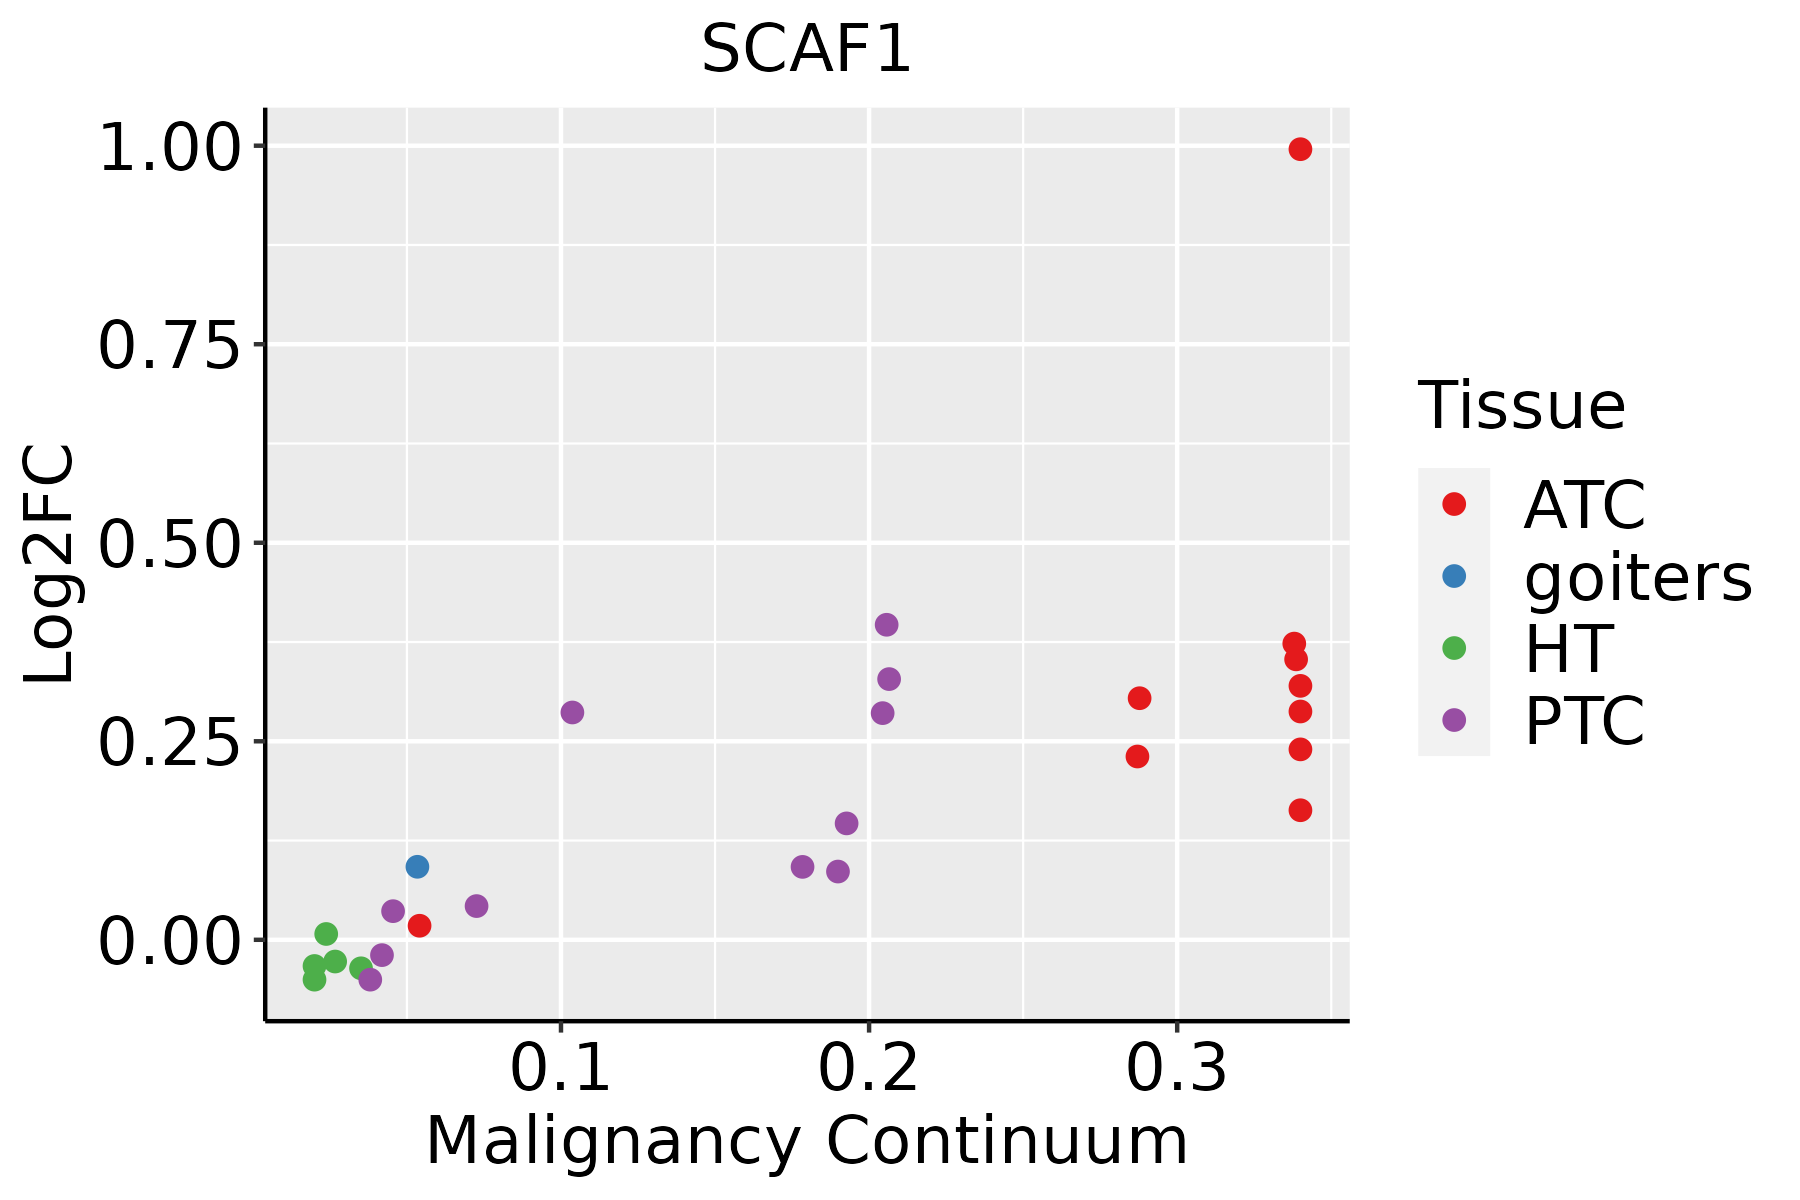
ATC: Anaplastic thyroid cancer
HT: Hashimoto's thyroiditis
PTC: Papillary thyroid cancer
∗log2FC in expression of this searched gene in stem-like cells from each diseased tissue sample relative to stem-like cells in normal samples in each tissue plotted against the malignancy continuum. Samples are colored based on if they are from different disease stage.

Top

Malignant transformation related pathway analysis

check buttonFind out the enriched GO biological processes and KEGG pathways involved in transition from healthy to precancer to cancer
check button Figure of enriched GO biological processes.
TissueDisease StageEnriched GO biological Processes
ColorectumADGO analysis - Figure of enriched GO biological processes: Top 15 enriched GO BP terms are showed in the bar plot of each disease state in each tissue. Each row represents a significant GO biological process which is colored according to the -log10(p.adjust).
ColorectumSERGO analysis - Figure of enriched GO biological processes: Top 15 enriched GO BP terms are showed in the bar plot of each disease state in each tissue. Each row represents a significant GO biological process which is colored according to the -log10(p.adjust).
ColorectumMSSGO analysis - Figure of enriched GO biological processes: Top 15 enriched GO BP terms are showed in the bar plot of each disease state in each tissue. Each row represents a significant GO biological process which is colored according to the -log10(p.adjust).
ColorectumMSI-HGO analysis - Figure of enriched GO biological processes: Top 15 enriched GO BP terms are showed in the bar plot of each disease state in each tissue. Each row represents a significant GO biological process which is colored according to the -log10(p.adjust).
ColorectumFAPGO analysis - Figure of enriched GO biological processes: Top 15 enriched GO BP terms are showed in the bar plot of each disease state in each tissue. Each row represents a significant GO biological process which is colored according to the -log10(p.adjust).
∗Top 15 enriched GO BP terms are showed in the bar plot of each disease state in each tissue. Each row represents a significant GO biological process which is colored according to the -log10(p.adjust).
Page: 1 2 3 4 5 6 7 8 9 

check button Enriched GO biological processes.
GO IDTissueDisease StageDescriptionGene RatioBg Ratiopvaluep.adjustCount
GO:0008380ColorectumADRNA splicing169/3918434/187233.59e-182.04e-15169
GO:0000377ColorectumADRNA splicing, via transesterification reactions with bulged adenosine as nucleophile130/3918320/187235.88e-162.16e-13130
GO:0000398ColorectumADmRNA splicing, via spliceosome130/3918320/187235.88e-162.16e-13130
GO:0000375ColorectumADRNA splicing, via transesterification reactions131/3918324/187237.11e-162.22e-13131
GO:0022618ColorectumADribonucleoprotein complex assembly92/3918220/187231.49e-122.60e-1092
GO:0071826ColorectumADribonucleoprotein complex subunit organization94/3918227/187231.70e-122.87e-1094
GO:0022613ColorectumADribonucleoprotein complex biogenesis151/3918463/187231.96e-091.39e-07151
GO:0000245ColorectumADspliceosomal complex assembly33/391879/187232.15e-054.33e-0433
GO:00083802ColorectumMSSRNA splicing159/3467434/187231.75e-191.22e-16159
GO:00003772ColorectumMSSRNA splicing, via transesterification reactions with bulged adenosine as nucleophile121/3467320/187232.52e-168.27e-14121
GO:00003982ColorectumMSSmRNA splicing, via spliceosome121/3467320/187232.52e-168.27e-14121
GO:00003752ColorectumMSSRNA splicing, via transesterification reactions122/3467324/187232.75e-168.58e-14122
GO:00718262ColorectumMSSribonucleoprotein complex subunit organization90/3467227/187236.88e-141.78e-1190
GO:00226182ColorectumMSSribonucleoprotein complex assembly88/3467220/187237.12e-141.78e-1188
GO:00226132ColorectumMSSribonucleoprotein complex biogenesis144/3467463/187232.76e-113.67e-09144
GO:00002451ColorectumMSSspliceosomal complex assembly31/346779/187231.33e-053.07e-0431
GO:00226183ColorectumMSI-Hribonucleoprotein complex assembly62/1319220/187237.13e-228.32e-1962
GO:00718263ColorectumMSI-Hribonucleoprotein complex subunit organization63/1319227/187238.08e-228.32e-1963
GO:00226133ColorectumMSI-Hribonucleoprotein complex biogenesis95/1319463/187231.04e-218.32e-1995
GO:00083803ColorectumMSI-HRNA splicing82/1319434/187231.22e-164.53e-1482
Page: 1 2 3 4 5 6 7 8 9 10 

check button Enriched KEGG pathways.
Pathway IDTissueDisease StageDescriptionGene RatioBg Ratiopvaluep.adjustqvalueCount
Page: 1 

Top

Cell-cell communication analysis

check buttonIdentification of potential cell-cell interactions between two cell types and their ligand-receptor pairs for different disease states
LigandReceptorLRpairPathwayTissueDisease Stage
Page: 1 

Top

Single-cell gene regulatory network inference analysis

check buttonFind out the significant the regulons (TFs) and the target genes of each regulon across cell types for different disease states
TFCell TypeTissueDisease StageTarget GeneRSSRegulon Activity
∗The dot plots of a searched regulon are shown for all cell subpopulations in each disease state of each tissue based on the regulon specific score inferred using pySCENIC and by calculating the average expression.
Page: 1 

Top

Somatic mutation of malignant transformation related genes

check buttonAnnotation of somatic variants for genes involved in malignant transformation
Hugo SymbolVariant ClassVariant ClassificationdbSNP RSHGVScHGVSpHGVSp ShortSWISSPROTBIOTYPESIFTPolyPhenTumor Sample BarcodeTissueHistologySexAgeStageTherapy TypesDrugsOutcome
SCAF1SNVMissense_Mutationc.2320N>Tp.Asp774Tyrp.D774YQ9H7N4protein_codingdeleterious_low_confidence(0)possibly_damaging(0.663)TCGA-AC-A23H-01Breastbreast invasive carcinomaFemale>=65I/IIUnknownUnknownPD
SCAF1SNVMissense_Mutationrs751197713c.2332N>Tp.Arg778Trpp.R778WQ9H7N4protein_codingdeleterious_low_confidence(0)probably_damaging(0.965)TCGA-2W-A8YY-01Cervixcervical & endocervical cancerFemale<65I/IIChemotherapycisplatinCR
SCAF1SNVMissense_Mutationnovelc.1951N>Ap.Gly651Serp.G651SQ9H7N4protein_codingtolerated_low_confidence(0.05)benign(0.014)TCGA-VS-A94Z-01Cervixcervical & endocervical cancerFemale<65I/IIChemotherapycisplatinCR
SCAF1SNVMissense_Mutationnovelc.117C>Gp.Ile39Metp.I39MQ9H7N4protein_codingdeleterious_low_confidence(0)benign(0.235)TCGA-VS-A958-01Cervixcervical & endocervical cancerFemale<65I/IIChemotherapycisplatinCR
SCAF1SNVMissense_Mutationnovelc.895G>Cp.Glu299Glnp.E299QQ9H7N4protein_codingdeleterious_low_confidence(0)benign(0.082)TCGA-VS-A958-01Cervixcervical & endocervical cancerFemale<65I/IIChemotherapycisplatinCR
SCAF1SNVMissense_Mutationrs772383494c.2282C>Gp.Ser761Cysp.S761CQ9H7N4protein_codingdeleterious_low_confidence(0.01)probably_damaging(0.987)TCGA-ZJ-AAXT-01Cervixcervical & endocervical cancerFemale<65III/IVUnknownUnknownSD
SCAF1SNVMissense_Mutationc.349C>Ap.Leu117Metp.L117MQ9H7N4protein_codingdeleterious_low_confidence(0)probably_damaging(0.996)TCGA-AA-A01P-01Colorectumcolon adenocarcinomaFemale>=65III/IVUnknownUnknownPD
SCAF1SNVMissense_Mutationc.3802C>Tp.Arg1268Trpp.R1268WQ9H7N4protein_codingdeleterious_low_confidence(0)probably_damaging(0.978)TCGA-AD-6895-01Colorectumcolon adenocarcinomaMale>=65III/IVUnknownUnknownSD
SCAF1SNVMissense_Mutationc.3479N>Tp.Gly1160Valp.G1160VQ9H7N4protein_codingdeleterious_low_confidence(0.03)benign(0.187)TCGA-AZ-6598-01Colorectumcolon adenocarcinomaFemale>=65I/IIUnknownUnknownSD
SCAF1SNVMissense_Mutationc.89N>Ap.Ser30Tyrp.S30YQ9H7N4protein_codingdeleterious_low_confidence(0)possibly_damaging(0.663)TCGA-CK-4951-01Colorectumcolon adenocarcinomaFemale>=65I/IIUnknownUnknownPD
Page: 1 2 3 4 5 6 7 8 9 10 

Top

Related drugs of malignant transformation related genes

check buttonIdentification of chemicals and drugs interact with genes involved in malignant transfromation
(DGIdb 4.0)
Entrez IDSymbolCategoryInteraction TypesDrug Claim NameDrug NamePMIDs
Page: 1