
|
|||||
|
 | |
| |
| |
| |
| |
| |
|
Gene: SC5D |
Gene summary for SC5D |
| Gene information | Species | Human | Gene symbol | SC5D | Gene ID | 6309 |
| Gene name | sterol-C5-desaturase | |
| Gene Alias | ERG3 | |
| Cytomap | 11q23.3-q24.1 | |
| Gene Type | protein-coding | GO ID | GO:0006066 | UniProtAcc | A0A024R3G4 |
Top |
Malignant transformation analysis |
| Identification of the aberrant gene expression in precancerous and cancerous lesions by comparing the gene expression of stem-like cells in diseased tissues with normal stem cells |
| Entrez ID | Symbol | Replicates | Species | Organ | Tissue | Adj P-value | Log2FC | Malignancy |
| 6309 | SC5D | LZE4T | Human | Esophagus | ESCC | 2.81e-23 | 6.85e-01 | 0.0811 |
| 6309 | SC5D | LZE7T | Human | Esophagus | ESCC | 1.02e-09 | 6.00e-01 | 0.0667 |
| 6309 | SC5D | LZE24T | Human | Esophagus | ESCC | 2.62e-19 | 5.02e-01 | 0.0596 |
| 6309 | SC5D | P1T-E | Human | Esophagus | ESCC | 7.91e-04 | 2.10e-01 | 0.0875 |
| 6309 | SC5D | P2T-E | Human | Esophagus | ESCC | 3.67e-20 | 3.09e-01 | 0.1177 |
| 6309 | SC5D | P4T-E | Human | Esophagus | ESCC | 3.54e-64 | 1.55e+00 | 0.1323 |
| 6309 | SC5D | P5T-E | Human | Esophagus | ESCC | 6.80e-40 | 8.69e-01 | 0.1327 |
| 6309 | SC5D | P8T-E | Human | Esophagus | ESCC | 7.82e-22 | 3.82e-01 | 0.0889 |
| 6309 | SC5D | P9T-E | Human | Esophagus | ESCC | 3.62e-32 | 7.81e-01 | 0.1131 |
| 6309 | SC5D | P10T-E | Human | Esophagus | ESCC | 2.91e-37 | 6.70e-01 | 0.116 |
| 6309 | SC5D | P11T-E | Human | Esophagus | ESCC | 2.84e-11 | 5.99e-01 | 0.1426 |
| 6309 | SC5D | P12T-E | Human | Esophagus | ESCC | 8.36e-43 | 8.52e-01 | 0.1122 |
| 6309 | SC5D | P15T-E | Human | Esophagus | ESCC | 2.87e-19 | 4.49e-01 | 0.1149 |
| 6309 | SC5D | P16T-E | Human | Esophagus | ESCC | 3.25e-29 | 4.82e-01 | 0.1153 |
| 6309 | SC5D | P17T-E | Human | Esophagus | ESCC | 8.86e-04 | 1.53e-01 | 0.1278 |
| 6309 | SC5D | P19T-E | Human | Esophagus | ESCC | 3.07e-02 | 1.97e-01 | 0.1662 |
| 6309 | SC5D | P20T-E | Human | Esophagus | ESCC | 3.90e-13 | 1.88e-01 | 0.1124 |
| 6309 | SC5D | P21T-E | Human | Esophagus | ESCC | 9.82e-30 | 5.75e-01 | 0.1617 |
| 6309 | SC5D | P22T-E | Human | Esophagus | ESCC | 1.51e-29 | 5.67e-01 | 0.1236 |
| 6309 | SC5D | P23T-E | Human | Esophagus | ESCC | 6.22e-18 | 5.40e-01 | 0.108 |
| Page: 1 2 3 4 5 |
| Tissue | Expression Dynamics | Abbreviation |
| Esophagus | 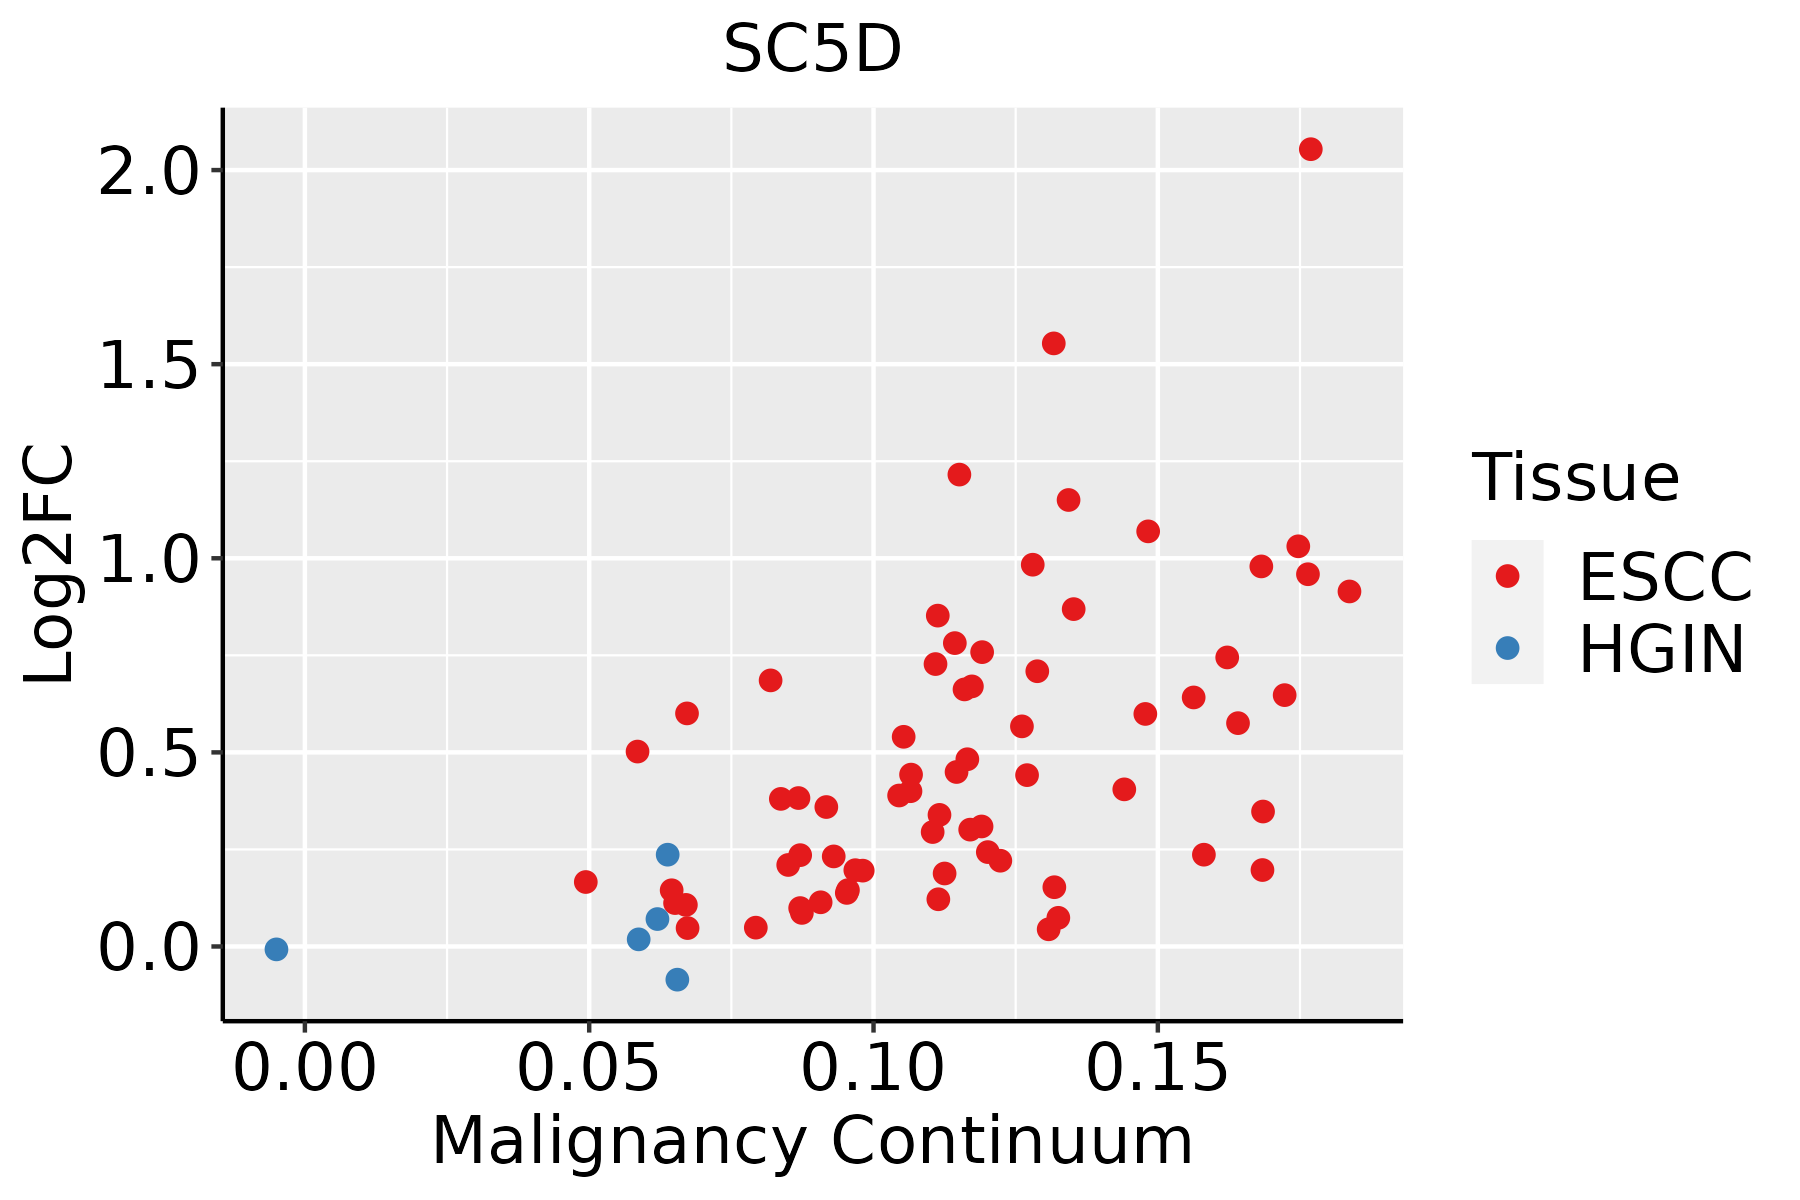 | ESCC: Esophageal squamous cell carcinoma |
| HGIN: High-grade intraepithelial neoplasias | ||
| LGIN: Low-grade intraepithelial neoplasias | ||
| Liver | 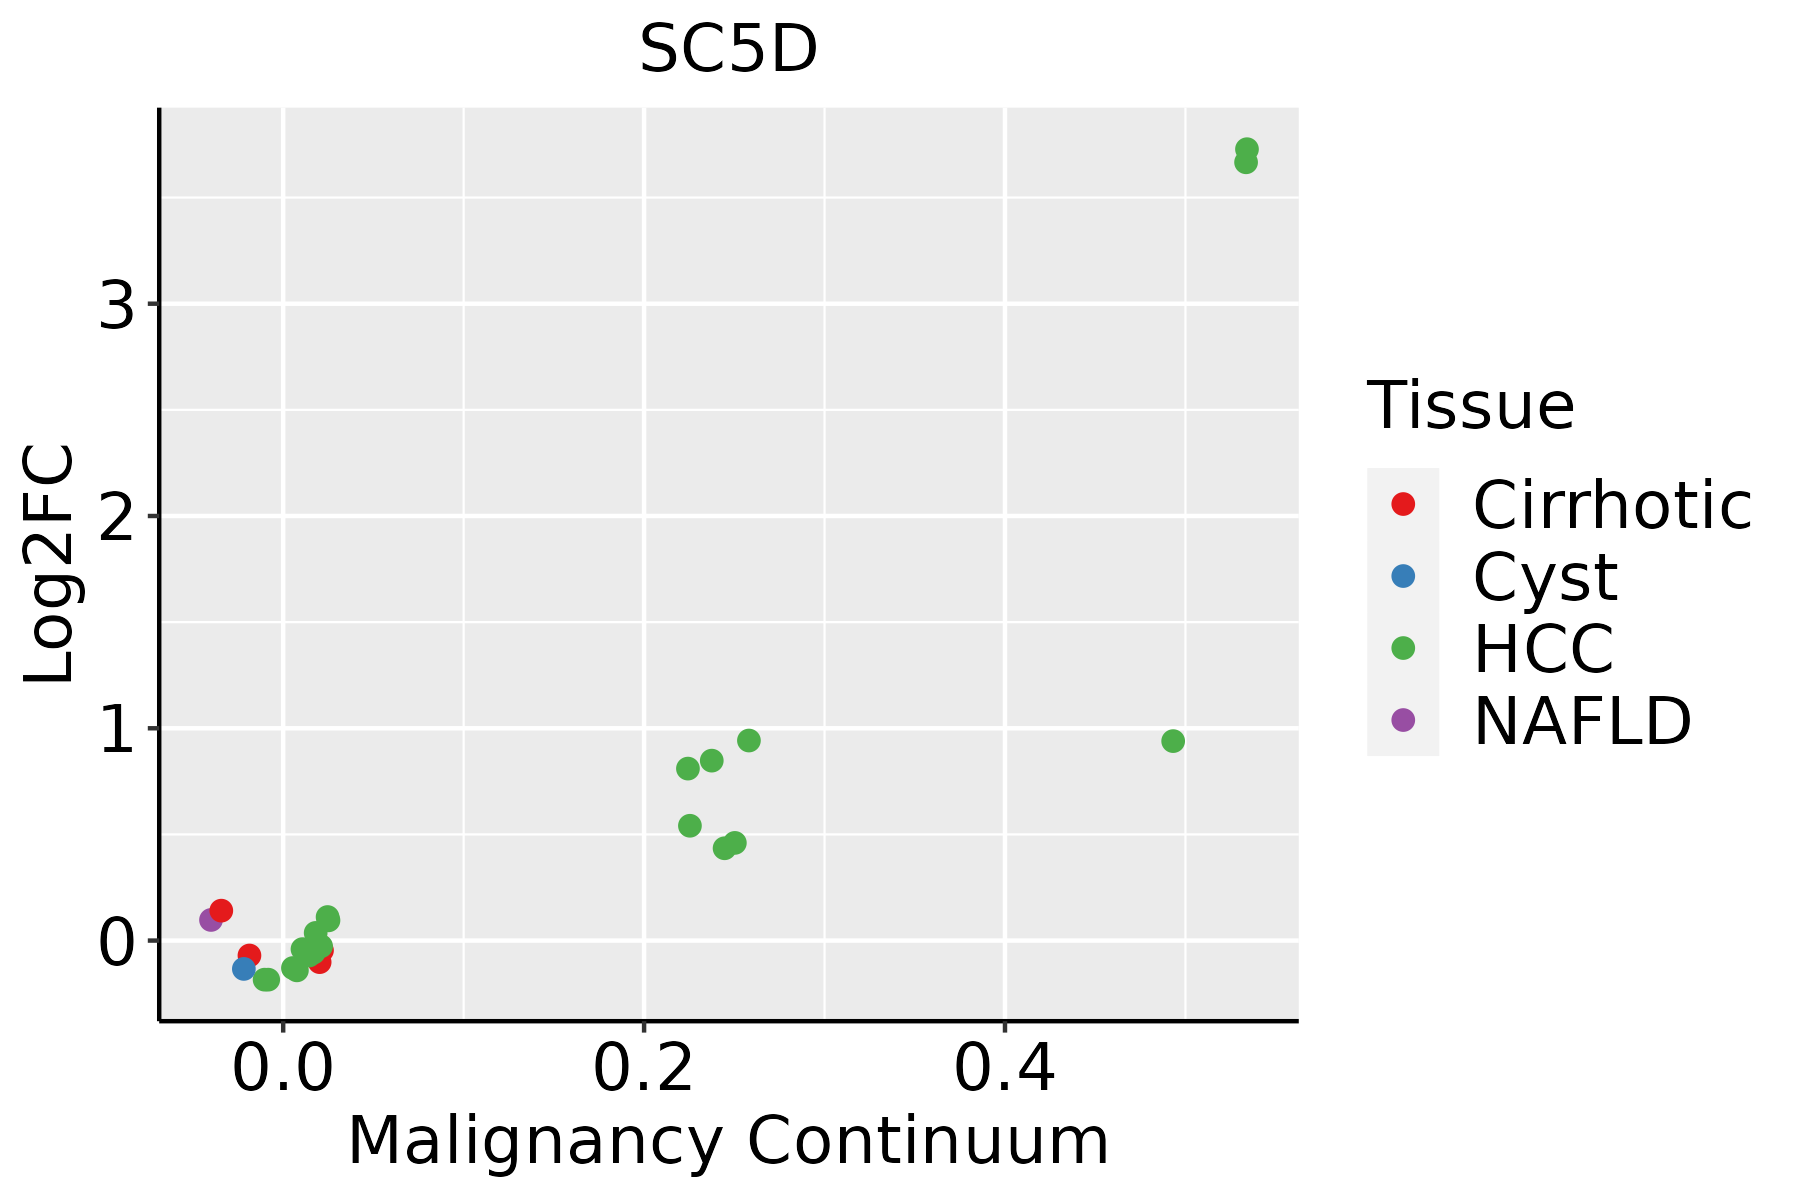 | HCC: Hepatocellular carcinoma |
| NAFLD: Non-alcoholic fatty liver disease | ||
| Oral Cavity |  | EOLP: Erosive Oral lichen planus |
| LP: leukoplakia | ||
| NEOLP: Non-erosive oral lichen planus | ||
| OSCC: Oral squamous cell carcinoma | ||
| Prostate |  | BPH: Benign Prostatic Hyperplasia |
| Skin | 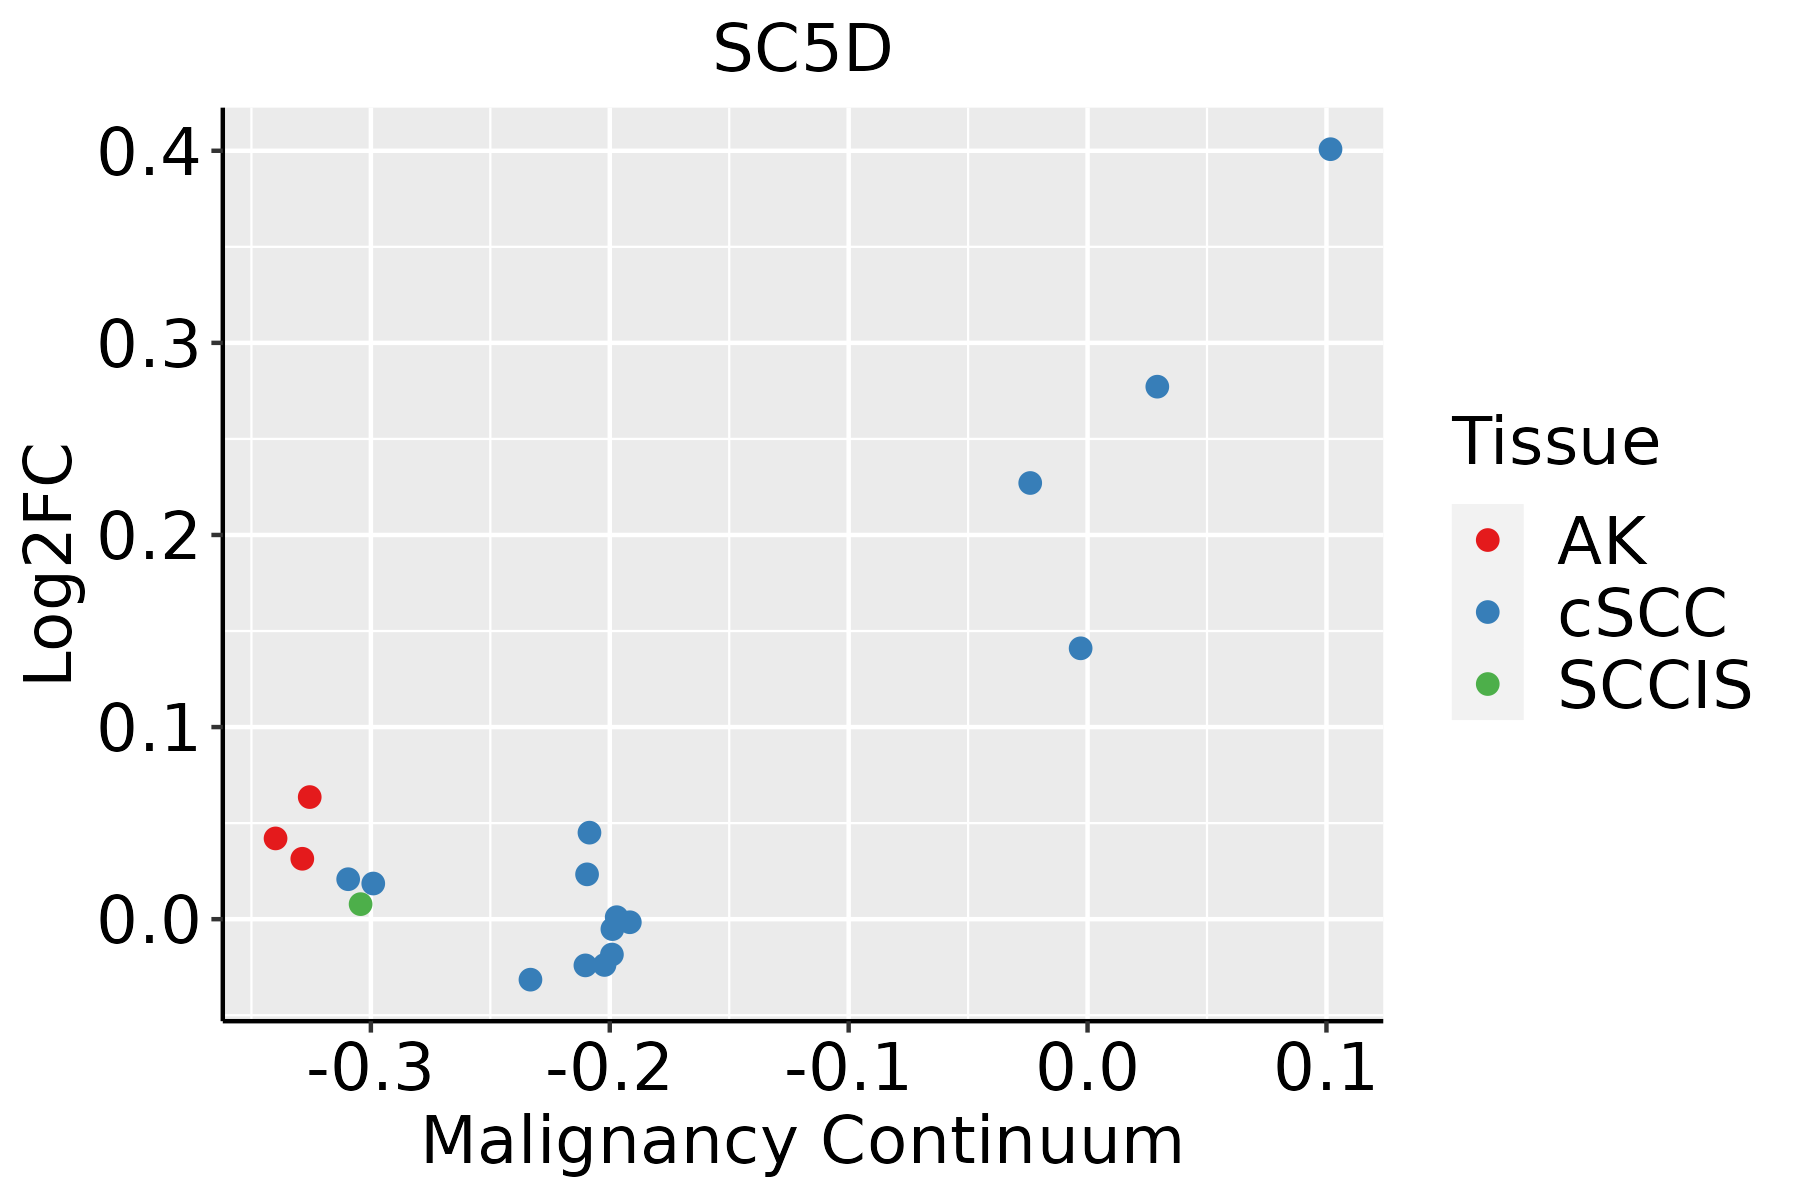 | AK: Actinic keratosis |
| cSCC: Cutaneous squamous cell carcinoma | ||
| SCCIS:squamous cell carcinoma in situ |
| ∗log2FC in expression of this searched gene in stem-like cells from each diseased tissue sample relative to stem-like cells in normal samples in each tissue plotted against the malignancy continuum. Samples are colored based on if they are from different disease stage. |
Top |
Malignant transformation related pathway analysis |
| Find out the enriched GO biological processes and KEGG pathways involved in transition from healthy to precancer to cancer |
| Tissue | Disease Stage | Enriched GO biological Processes |
| Colorectum | AD |  |
| Colorectum | SER |  |
| Colorectum | MSS |  |
| Colorectum | MSI-H |  |
| Colorectum | FAP |  |
| ∗Top 15 enriched GO BP terms are showed in the bar plot of each disease state in each tissue. Each row represents a significant GO biological process which is colored according to the -log10(p.adjust). |
| Page: 1 2 3 4 5 6 7 8 9 |
| GO ID | Tissue | Disease Stage | Description | Gene Ratio | Bg Ratio | pvalue | p.adjust | Count |
| GO:00060668 | Esophagus | ESCC | alcohol metabolic process | 202/8552 | 353/18723 | 7.32e-06 | 7.26e-05 | 202 |
| GO:00161263 | Esophagus | ESCC | sterol biosynthetic process | 46/8552 | 64/18723 | 1.91e-05 | 1.67e-04 | 46 |
| GO:00066953 | Esophagus | ESCC | cholesterol biosynthetic process | 41/8552 | 57/18723 | 5.25e-05 | 4.06e-04 | 41 |
| GO:19026533 | Esophagus | ESCC | secondary alcohol biosynthetic process | 41/8552 | 57/18723 | 5.25e-05 | 4.06e-04 | 41 |
| GO:19026524 | Esophagus | ESCC | secondary alcohol metabolic process | 87/8552 | 147/18723 | 6.58e-04 | 3.50e-03 | 87 |
| GO:00461653 | Esophagus | ESCC | alcohol biosynthetic process | 83/8552 | 140/18723 | 8.04e-04 | 4.16e-03 | 83 |
| GO:00066946 | Esophagus | ESCC | steroid biosynthetic process | 98/8552 | 173/18723 | 2.34e-03 | 1.03e-02 | 98 |
| GO:00082034 | Esophagus | ESCC | cholesterol metabolic process | 79/8552 | 137/18723 | 3.11e-03 | 1.29e-02 | 79 |
| GO:00161254 | Esophagus | ESCC | sterol metabolic process | 86/8552 | 152/18723 | 4.37e-03 | 1.73e-02 | 86 |
| GO:19016174 | Esophagus | ESCC | organic hydroxy compound biosynthetic process | 128/8552 | 237/18723 | 5.86e-03 | 2.16e-02 | 128 |
| GO:000606621 | Liver | HCC | alcohol metabolic process | 208/7958 | 353/18723 | 2.80e-10 | 9.50e-09 | 208 |
| GO:19026522 | Liver | HCC | secondary alcohol metabolic process | 100/7958 | 147/18723 | 3.26e-10 | 1.09e-08 | 100 |
| GO:00082032 | Liver | HCC | cholesterol metabolic process | 94/7958 | 137/18723 | 5.39e-10 | 1.72e-08 | 94 |
| GO:00082022 | Liver | HCC | steroid metabolic process | 188/7958 | 319/18723 | 1.96e-09 | 5.63e-08 | 188 |
| GO:00161252 | Liver | HCC | sterol metabolic process | 101/7958 | 152/18723 | 1.99e-09 | 5.63e-08 | 101 |
| GO:00066951 | Liver | HCC | cholesterol biosynthetic process | 43/7958 | 57/18723 | 4.37e-07 | 7.23e-06 | 43 |
| GO:19026531 | Liver | HCC | secondary alcohol biosynthetic process | 43/7958 | 57/18723 | 4.37e-07 | 7.23e-06 | 43 |
| GO:00161261 | Liver | HCC | sterol biosynthetic process | 47/7958 | 64/18723 | 5.00e-07 | 8.11e-06 | 47 |
| GO:00066942 | Liver | HCC | steroid biosynthetic process | 104/7958 | 173/18723 | 2.13e-06 | 2.91e-05 | 104 |
| GO:19016172 | Liver | HCC | organic hydroxy compound biosynthetic process | 129/7958 | 237/18723 | 1.32e-04 | 1.08e-03 | 129 |
| Page: 1 2 3 |
| Pathway ID | Tissue | Disease Stage | Description | Gene Ratio | Bg Ratio | pvalue | p.adjust | qvalue | Count |
| hsa001005 | Esophagus | ESCC | Steroid biosynthesis | 18/4205 | 20/8465 | 1.78e-04 | 6.79e-04 | 3.48e-04 | 18 |
| hsa0010012 | Esophagus | ESCC | Steroid biosynthesis | 18/4205 | 20/8465 | 1.78e-04 | 6.79e-04 | 3.48e-04 | 18 |
| hsa001002 | Liver | HCC | Steroid biosynthesis | 15/4020 | 20/8465 | 1.17e-02 | 2.97e-02 | 1.65e-02 | 15 |
| hsa001003 | Liver | HCC | Steroid biosynthesis | 15/4020 | 20/8465 | 1.17e-02 | 2.97e-02 | 1.65e-02 | 15 |
| hsa001004 | Oral cavity | OSCC | Steroid biosynthesis | 15/3704 | 20/8465 | 4.62e-03 | 1.13e-02 | 5.75e-03 | 15 |
| hsa0010011 | Oral cavity | OSCC | Steroid biosynthesis | 15/3704 | 20/8465 | 4.62e-03 | 1.13e-02 | 5.75e-03 | 15 |
| hsa0010021 | Oral cavity | LP | Steroid biosynthesis | 11/2418 | 20/8465 | 1.16e-02 | 3.91e-02 | 2.52e-02 | 11 |
| hsa0010031 | Oral cavity | LP | Steroid biosynthesis | 11/2418 | 20/8465 | 1.16e-02 | 3.91e-02 | 2.52e-02 | 11 |
| Page: 1 |
Top |
Cell-cell communication analysis |
| Identification of potential cell-cell interactions between two cell types and their ligand-receptor pairs for different disease states |
| Ligand | Receptor | LRpair | Pathway | Tissue | Disease Stage |
| Page: 1 |
Top |
Single-cell gene regulatory network inference analysis |
| Find out the significant the regulons (TFs) and the target genes of each regulon across cell types for different disease states |
| TF | Cell Type | Tissue | Disease Stage | Target Gene | RSS | Regulon Activity |
| ∗The dot plots of a searched regulon are shown for all cell subpopulations in each disease state of each tissue based on the regulon specific score inferred using pySCENIC and by calculating the average expression. |
| Page: 1 |
Top |
Somatic mutation of malignant transformation related genes |
| Annotation of somatic variants for genes involved in malignant transformation |
| Hugo Symbol | Variant Class | Variant Classification | dbSNP RS | HGVSc | HGVSp | HGVSp Short | SWISSPROT | BIOTYPE | SIFT | PolyPhen | Tumor Sample Barcode | Tissue | Histology | Sex | Age | Stage | Therapy Types | Drugs | Outcome |
| SC5D | SNV | Missense_Mutation | novel | c.10N>C | p.Val4Leu | p.V4L | O75845 | protein_coding | deleterious(0.04) | benign(0.062) | TCGA-AC-A6IW-01 | Breast | breast invasive carcinoma | Female | >=65 | I/II | Unknown | Unknown | SD |
| SC5D | SNV | Missense_Mutation | c.862N>A | p.Glu288Lys | p.E288K | O75845 | protein_coding | tolerated(0.22) | benign(0.001) | TCGA-D8-A1JB-01 | Breast | breast invasive carcinoma | Female | <65 | I/II | Chemotherapy | adriamycin | SD | |
| SC5D | SNV | Missense_Mutation | novel | c.408G>T | p.Trp136Cys | p.W136C | O75845 | protein_coding | deleterious(0) | possibly_damaging(0.901) | TCGA-E2-A15K-06 | Breast | breast invasive carcinoma | Female | <65 | I/II | Chemotherapy | adriamycin | SD |
| SC5D | SNV | Missense_Mutation | novel | c.560T>G | p.Phe187Cys | p.F187C | O75845 | protein_coding | deleterious(0) | benign(0.383) | TCGA-AZ-4315-01 | Colorectum | colon adenocarcinoma | Male | <65 | I/II | Unknown | Unknown | SD |
| SC5D | SNV | Missense_Mutation | novel | c.533N>G | p.Leu178Arg | p.L178R | O75845 | protein_coding | deleterious(0) | probably_damaging(0.964) | TCGA-CA-6717-01 | Colorectum | colon adenocarcinoma | Male | <65 | I/II | Chemotherapy | oxaliplatin | CR |
| SC5D | SNV | Missense_Mutation | c.36N>G | p.Phe12Leu | p.F12L | O75845 | protein_coding | tolerated(0.5) | benign(0.003) | TCGA-F4-6856-01 | Colorectum | colon adenocarcinoma | Male | <65 | I/II | Ancillary | leucovorin | CR | |
| SC5D | SNV | Missense_Mutation | c.461N>G | p.His154Arg | p.H154R | O75845 | protein_coding | deleterious(0) | probably_damaging(1) | TCGA-F4-6856-01 | Colorectum | colon adenocarcinoma | Male | <65 | I/II | Ancillary | leucovorin | CR | |
| SC5D | SNV | Missense_Mutation | rs142025005 | c.445C>T | p.Arg149Cys | p.R149C | O75845 | protein_coding | tolerated(0.12) | possibly_damaging(0.849) | TCGA-QL-A97D-01 | Colorectum | colon adenocarcinoma | Female | >=65 | I/II | Unknown | Unknown | SD |
| SC5D | SNV | Missense_Mutation | c.665N>G | p.Phe222Cys | p.F222C | O75845 | protein_coding | deleterious(0) | probably_damaging(0.928) | TCGA-AG-3892-01 | Colorectum | rectum adenocarcinoma | Female | <65 | I/II | Unknown | Unknown | SD | |
| SC5D | SNV | Missense_Mutation | novel | c.443A>T | p.Lys148Met | p.K148M | O75845 | protein_coding | deleterious(0) | probably_damaging(0.989) | TCGA-AG-4001-01 | Colorectum | rectum adenocarcinoma | Female | >=65 | I/II | Unknown | Unknown | SD |
| Page: 1 2 3 4 |
Top |
Related drugs of malignant transformation related genes |
| Identification of chemicals and drugs interact with genes involved in malignant transfromation |
| (DGIdb 4.0) |
| Entrez ID | Symbol | Category | Interaction Types | Drug Claim Name | Drug Name | PMIDs |
| Page: 1 |

Copyright 2023-Present -The University of Texas Health Science Center at Houston |