
|
|||||
|
 | |
| |
| |
| |
| |
| |
|
Gene: SBSN |
Gene summary for SBSN |
| Gene information | Species | Human | Gene symbol | SBSN | Gene ID | 374897 |
| Gene name | suprabasin | |
| Gene Alias | UNQ698 | |
| Cytomap | 19q13.12 | |
| Gene Type | protein-coding | GO ID | GO:0008150 | UniProtAcc | Q6UWP8 |
Top |
Malignant transformation analysis |
| Identification of the aberrant gene expression in precancerous and cancerous lesions by comparing the gene expression of stem-like cells in diseased tissues with normal stem cells |
| Entrez ID | Symbol | Replicates | Species | Organ | Tissue | Adj P-value | Log2FC | Malignancy |
| 374897 | SBSN | P22T-E | Human | Esophagus | ESCC | 8.56e-12 | 3.71e-01 | 0.1236 |
| 374897 | SBSN | P28T-E | Human | Esophagus | ESCC | 9.44e-07 | 7.21e-01 | 0.1149 |
| 374897 | SBSN | P38T-E | Human | Esophagus | ESCC | 1.36e-12 | 7.96e-01 | 0.127 |
| 374897 | SBSN | P52T-E | Human | Esophagus | ESCC | 1.00e-24 | 1.17e+00 | 0.1555 |
| 374897 | SBSN | P83T-E | Human | Esophagus | ESCC | 2.18e-11 | 1.12e+00 | 0.1738 |
| 374897 | SBSN | P91T-E | Human | Esophagus | ESCC | 2.11e-02 | 8.04e-01 | 0.1828 |
| 374897 | SBSN | P126T-E | Human | Esophagus | ESCC | 6.92e-05 | 9.38e-01 | 0.1125 |
| 374897 | SBSN | SYSMH2 | Human | Oral cavity | OSCC | 2.97e-12 | 4.70e-01 | 0.2326 |
| 374897 | SBSN | SYSMH3 | Human | Oral cavity | OSCC | 5.22e-110 | 1.87e+00 | 0.2442 |
| 374897 | SBSN | SYSMH4 | Human | Oral cavity | OSCC | 8.30e-86 | 1.18e+00 | 0.1226 |
| 374897 | SBSN | SYSMH5 | Human | Oral cavity | OSCC | 8.97e-57 | 7.85e-01 | 0.0647 |
| 374897 | SBSN | P3_S6_AK | Human | Skin | AK | 1.19e-10 | 5.10e-01 | -0.3256 |
| 374897 | SBSN | ATC12 | Human | Thyroid | ATC | 2.34e-18 | 5.87e-01 | 0.34 |
| 374897 | SBSN | ATC4 | Human | Thyroid | ATC | 5.41e-21 | 6.64e-01 | 0.34 |
| Page: 1 |
| Tissue | Expression Dynamics | Abbreviation |
| Esophagus | 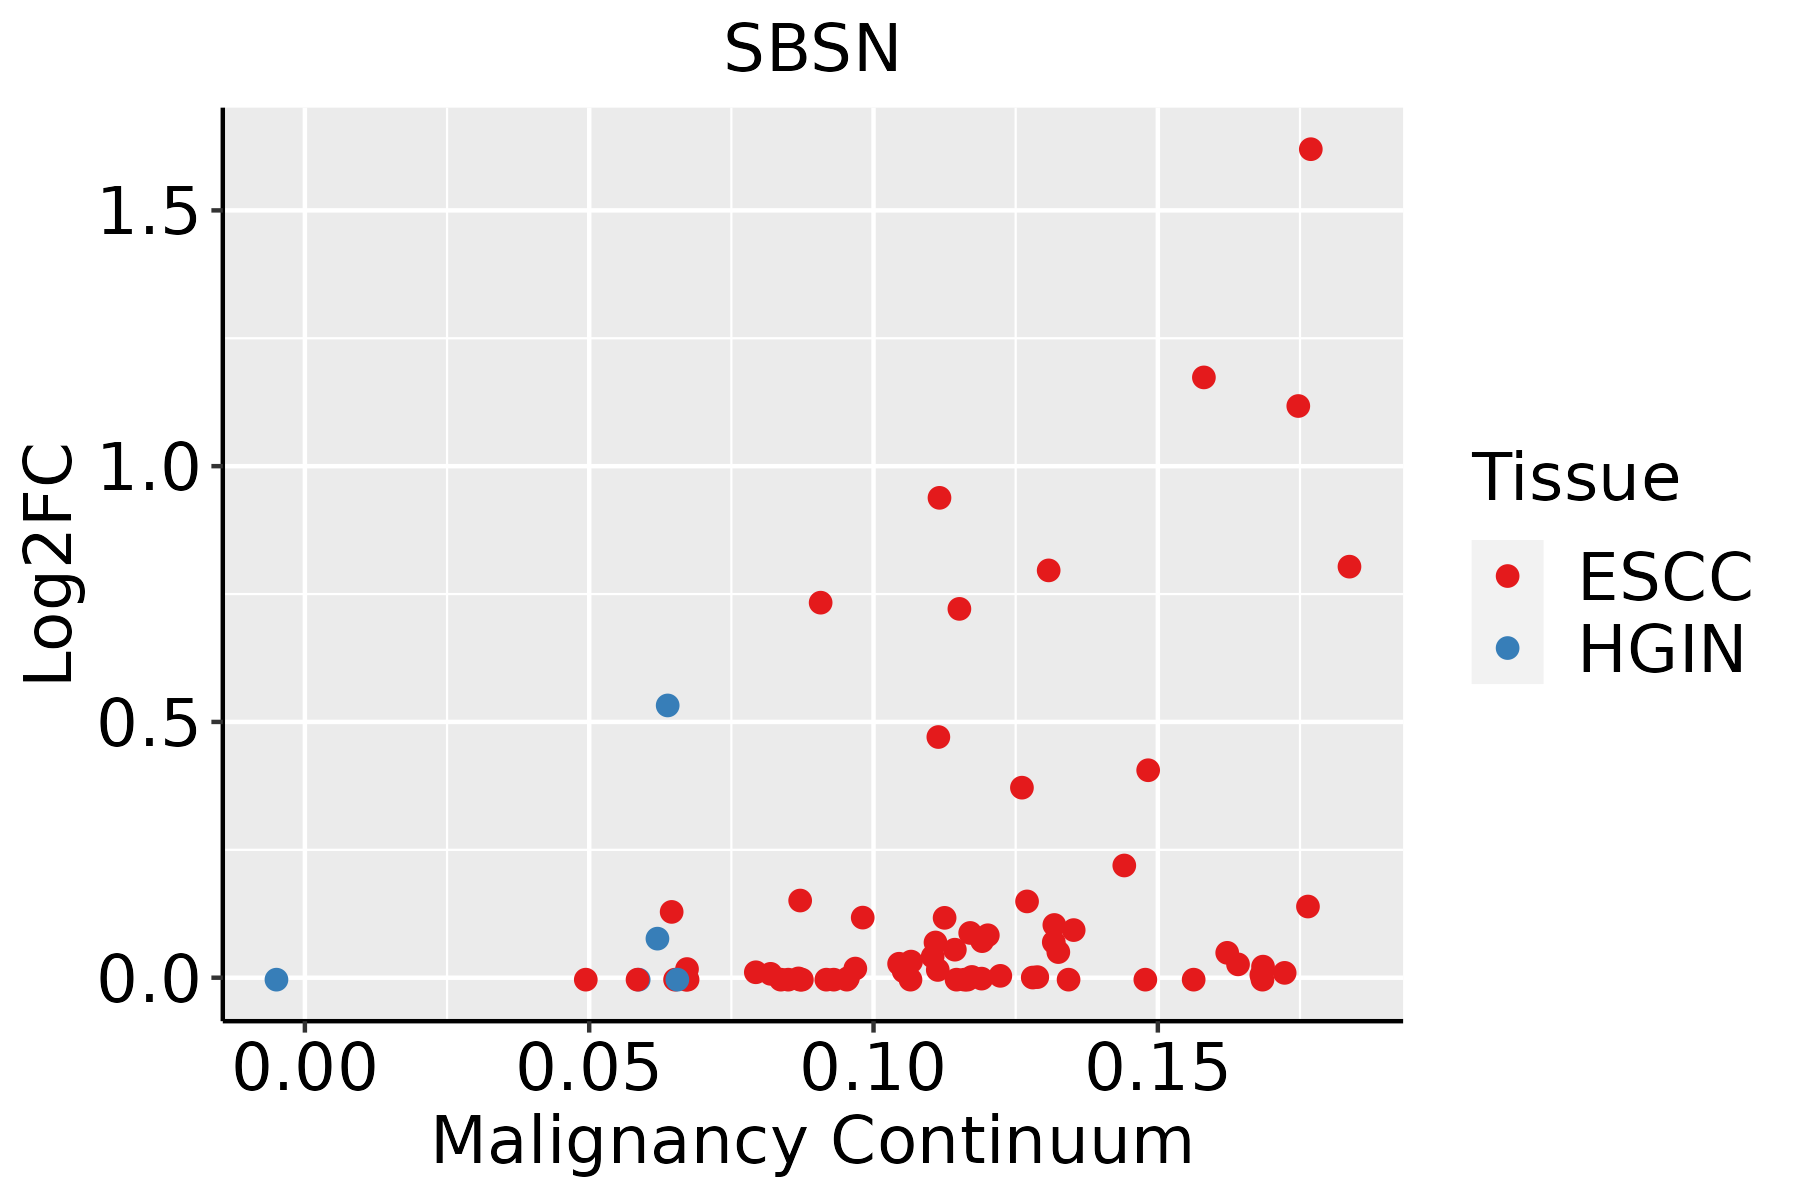 | ESCC: Esophageal squamous cell carcinoma |
| HGIN: High-grade intraepithelial neoplasias | ||
| LGIN: Low-grade intraepithelial neoplasias | ||
| Oral Cavity |  | EOLP: Erosive Oral lichen planus |
| LP: leukoplakia | ||
| NEOLP: Non-erosive oral lichen planus | ||
| OSCC: Oral squamous cell carcinoma | ||
| Skin |  | AK: Actinic keratosis |
| cSCC: Cutaneous squamous cell carcinoma | ||
| SCCIS:squamous cell carcinoma in situ | ||
| Thyroid | 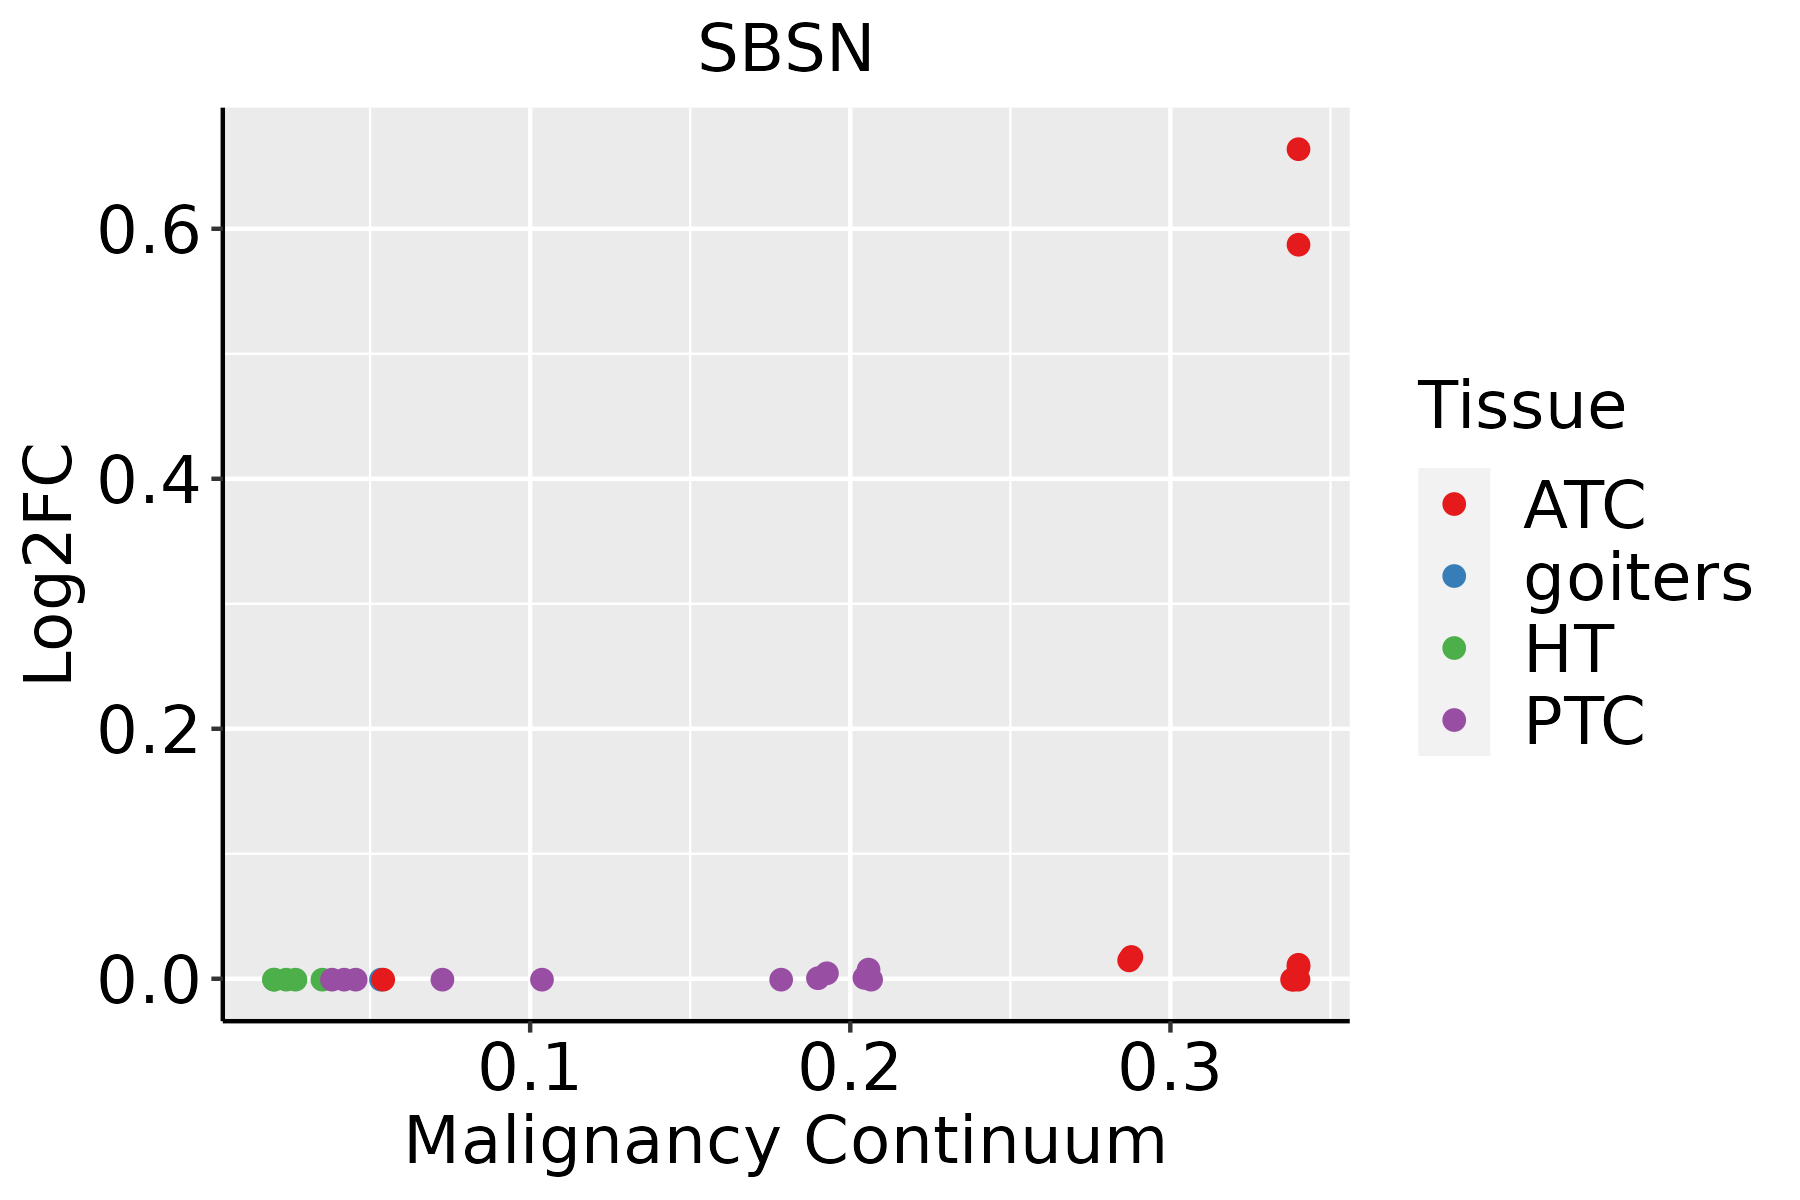 | ATC: Anaplastic thyroid cancer |
| HT: Hashimoto's thyroiditis | ||
| PTC: Papillary thyroid cancer |
| ∗log2FC in expression of this searched gene in stem-like cells from each diseased tissue sample relative to stem-like cells in normal samples in each tissue plotted against the malignancy continuum. Samples are colored based on if they are from different disease stage. |
Top |
Malignant transformation related pathway analysis |
| Find out the enriched GO biological processes and KEGG pathways involved in transition from healthy to precancer to cancer |
| Tissue | Disease Stage | Enriched GO biological Processes |
| Colorectum | AD |  |
| Colorectum | SER |  |
| Colorectum | MSS |  |
| Colorectum | MSI-H |  |
| Colorectum | FAP |  |
| ∗Top 15 enriched GO BP terms are showed in the bar plot of each disease state in each tissue. Each row represents a significant GO biological process which is colored according to the -log10(p.adjust). |
| Page: 1 2 3 4 5 6 7 8 9 |
| GO ID | Tissue | Disease Stage | Description | Gene Ratio | Bg Ratio | pvalue | p.adjust | Count |
| Page: 1 |
| Pathway ID | Tissue | Disease Stage | Description | Gene Ratio | Bg Ratio | pvalue | p.adjust | qvalue | Count |
| Page: 1 |
Top |
Cell-cell communication analysis |
| Identification of potential cell-cell interactions between two cell types and their ligand-receptor pairs for different disease states |
| Ligand | Receptor | LRpair | Pathway | Tissue | Disease Stage |
| Page: 1 |
Top |
Single-cell gene regulatory network inference analysis |
| Find out the significant the regulons (TFs) and the target genes of each regulon across cell types for different disease states |
| TF | Cell Type | Tissue | Disease Stage | Target Gene | RSS | Regulon Activity |
| ∗The dot plots of a searched regulon are shown for all cell subpopulations in each disease state of each tissue based on the regulon specific score inferred using pySCENIC and by calculating the average expression. |
| Page: 1 |
Top |
Somatic mutation of malignant transformation related genes |
| Annotation of somatic variants for genes involved in malignant transformation |
| Hugo Symbol | Variant Class | Variant Classification | dbSNP RS | HGVSc | HGVSp | HGVSp Short | SWISSPROT | BIOTYPE | SIFT | PolyPhen | Tumor Sample Barcode | Tissue | Histology | Sex | Age | Stage | Therapy Types | Drugs | Outcome |
| SBSN | SNV | Missense_Mutation | rs748641353 | c.226G>A | p.Gly76Arg | p.G76R | Q6UWP8 | protein_coding | deleterious(0) | probably_damaging(1) | TCGA-AN-A04D-01 | Breast | breast invasive carcinoma | Female | <65 | I/II | Unknown | Unknown | SD |
| SBSN | SNV | Missense_Mutation | c.1032G>C | p.Trp344Cys | p.W344C | Q6UWP8 | protein_coding | tolerated(0.16) | benign(0.247) | TCGA-E9-A22E-01 | Breast | breast invasive carcinoma | Female | <65 | III/IV | Chemotherapy | cyclophosphane | SD | |
| SBSN | SNV | Missense_Mutation | novel | c.718N>A | p.Glu240Lys | p.E240K | Q6UWP8 | protein_coding | tolerated(0.05) | benign(0.217) | TCGA-E9-A6HE-01 | Breast | breast invasive carcinoma | Female | <65 | III/IV | Chemotherapy | adriamycin | CR |
| SBSN | SNV | Missense_Mutation | rs755643796 | c.469N>A | p.Asp157Asn | p.D157N | Q6UWP8 | protein_coding | tolerated(0.4) | benign(0) | TCGA-C5-A7CG-01 | Cervix | cervical & endocervical cancer | Female | <65 | I/II | Unknown | Unknown | SD |
| SBSN | SNV | Missense_Mutation | c.1208N>A | p.Arg403Lys | p.R403K | Q6UWP8 | protein_coding | tolerated(1) | benign(0) | TCGA-EA-A3HR-01 | Cervix | cervical & endocervical cancer | Female | <65 | I/II | Unknown | Unknown | SD | |
| SBSN | SNV | Missense_Mutation | novel | c.421G>A | p.Gly141Arg | p.G141R | Q6UWP8 | protein_coding | deleterious(0) | probably_damaging(0.997) | TCGA-EA-A410-01 | Cervix | cervical & endocervical cancer | Female | <65 | I/II | Unknown | Unknown | SD |
| SBSN | SNV | Missense_Mutation | c.1340N>A | p.Gly447Glu | p.G447E | Q6UWP8 | protein_coding | deleterious(0) | probably_damaging(0.961) | TCGA-AA-3492-01 | Colorectum | colon adenocarcinoma | Female | >=65 | I/II | Unknown | Unknown | SD | |
| SBSN | SNV | Missense_Mutation | c.311G>T | p.Gly104Val | p.G104V | Q6UWP8 | protein_coding | tolerated(0.09) | probably_damaging(1) | TCGA-AA-3811-01 | Colorectum | colon adenocarcinoma | Female | >=65 | III/IV | Unknown | Unknown | PD | |
| SBSN | SNV | Missense_Mutation | c.1420G>T | p.Asp474Tyr | p.D474Y | Q6UWP8 | protein_coding | deleterious(0) | possibly_damaging(0.515) | TCGA-AA-3977-01 | Colorectum | colon adenocarcinoma | Male | >=65 | I/II | Unknown | Unknown | SD | |
| SBSN | SNV | Missense_Mutation | rs774871425 | c.113G>A | p.Arg38Gln | p.R38Q | Q6UWP8 | protein_coding | tolerated(0.11) | probably_damaging(0.996) | TCGA-AD-5900-01 | Colorectum | colon adenocarcinoma | Male | >=65 | I/II | Unknown | Unknown | SD |
| Page: 1 2 3 4 5 6 7 |
Top |
Related drugs of malignant transformation related genes |
| Identification of chemicals and drugs interact with genes involved in malignant transfromation |
| (DGIdb 4.0) |
| Entrez ID | Symbol | Category | Interaction Types | Drug Claim Name | Drug Name | PMIDs |
| Page: 1 |

Copyright 2023-Present -The University of Texas Health Science Center at Houston |