
|
|||||
|
 | |
| |
| |
| |
| |
| |
|
Gene: SBF1 |
Gene summary for SBF1 |
| Gene information | Species | Human | Gene symbol | SBF1 | Gene ID | 6305 |
| Gene name | SET binding factor 1 | |
| Gene Alias | CMT4B3 | |
| Cytomap | 22q13.33 | |
| Gene Type | protein-coding | GO ID | GO:0000003 | UniProtAcc | A0A024R4Z9 |
Top |
Malignant transformation analysis |
| Identification of the aberrant gene expression in precancerous and cancerous lesions by comparing the gene expression of stem-like cells in diseased tissues with normal stem cells |
| Entrez ID | Symbol | Replicates | Species | Organ | Tissue | Adj P-value | Log2FC | Malignancy |
| 6305 | SBF1 | LZE5T | Human | Esophagus | ESCC | 1.75e-02 | 1.53e-01 | 0.0514 |
| 6305 | SBF1 | LZE7T | Human | Esophagus | ESCC | 9.74e-06 | 3.14e-01 | 0.0667 |
| 6305 | SBF1 | LZE24T | Human | Esophagus | ESCC | 9.88e-11 | 1.70e-01 | 0.0596 |
| 6305 | SBF1 | P1T-E | Human | Esophagus | ESCC | 4.80e-05 | 3.62e-01 | 0.0875 |
| 6305 | SBF1 | P2T-E | Human | Esophagus | ESCC | 9.97e-10 | 7.88e-02 | 0.1177 |
| 6305 | SBF1 | P4T-E | Human | Esophagus | ESCC | 4.13e-06 | 8.04e-02 | 0.1323 |
| 6305 | SBF1 | P5T-E | Human | Esophagus | ESCC | 3.25e-10 | 8.33e-02 | 0.1327 |
| 6305 | SBF1 | P8T-E | Human | Esophagus | ESCC | 3.62e-19 | 2.10e-01 | 0.0889 |
| 6305 | SBF1 | P9T-E | Human | Esophagus | ESCC | 5.56e-06 | 7.96e-02 | 0.1131 |
| 6305 | SBF1 | P10T-E | Human | Esophagus | ESCC | 1.44e-19 | 1.73e-01 | 0.116 |
| 6305 | SBF1 | P11T-E | Human | Esophagus | ESCC | 1.68e-08 | 2.80e-01 | 0.1426 |
| 6305 | SBF1 | P12T-E | Human | Esophagus | ESCC | 6.55e-14 | 1.54e-01 | 0.1122 |
| 6305 | SBF1 | P15T-E | Human | Esophagus | ESCC | 1.17e-08 | 1.06e-01 | 0.1149 |
| 6305 | SBF1 | P16T-E | Human | Esophagus | ESCC | 8.47e-14 | 9.40e-02 | 0.1153 |
| 6305 | SBF1 | P17T-E | Human | Esophagus | ESCC | 9.47e-07 | 1.53e-01 | 0.1278 |
| 6305 | SBF1 | P20T-E | Human | Esophagus | ESCC | 3.52e-08 | 7.70e-02 | 0.1124 |
| 6305 | SBF1 | P21T-E | Human | Esophagus | ESCC | 1.33e-13 | 1.42e-01 | 0.1617 |
| 6305 | SBF1 | P22T-E | Human | Esophagus | ESCC | 9.47e-15 | 7.52e-02 | 0.1236 |
| 6305 | SBF1 | P23T-E | Human | Esophagus | ESCC | 1.16e-06 | 1.45e-01 | 0.108 |
| 6305 | SBF1 | P24T-E | Human | Esophagus | ESCC | 1.01e-08 | 5.00e-02 | 0.1287 |
| Page: 1 2 3 4 5 |
| Tissue | Expression Dynamics | Abbreviation |
| Esophagus |  | ESCC: Esophageal squamous cell carcinoma |
| HGIN: High-grade intraepithelial neoplasias | ||
| LGIN: Low-grade intraepithelial neoplasias | ||
| Liver | 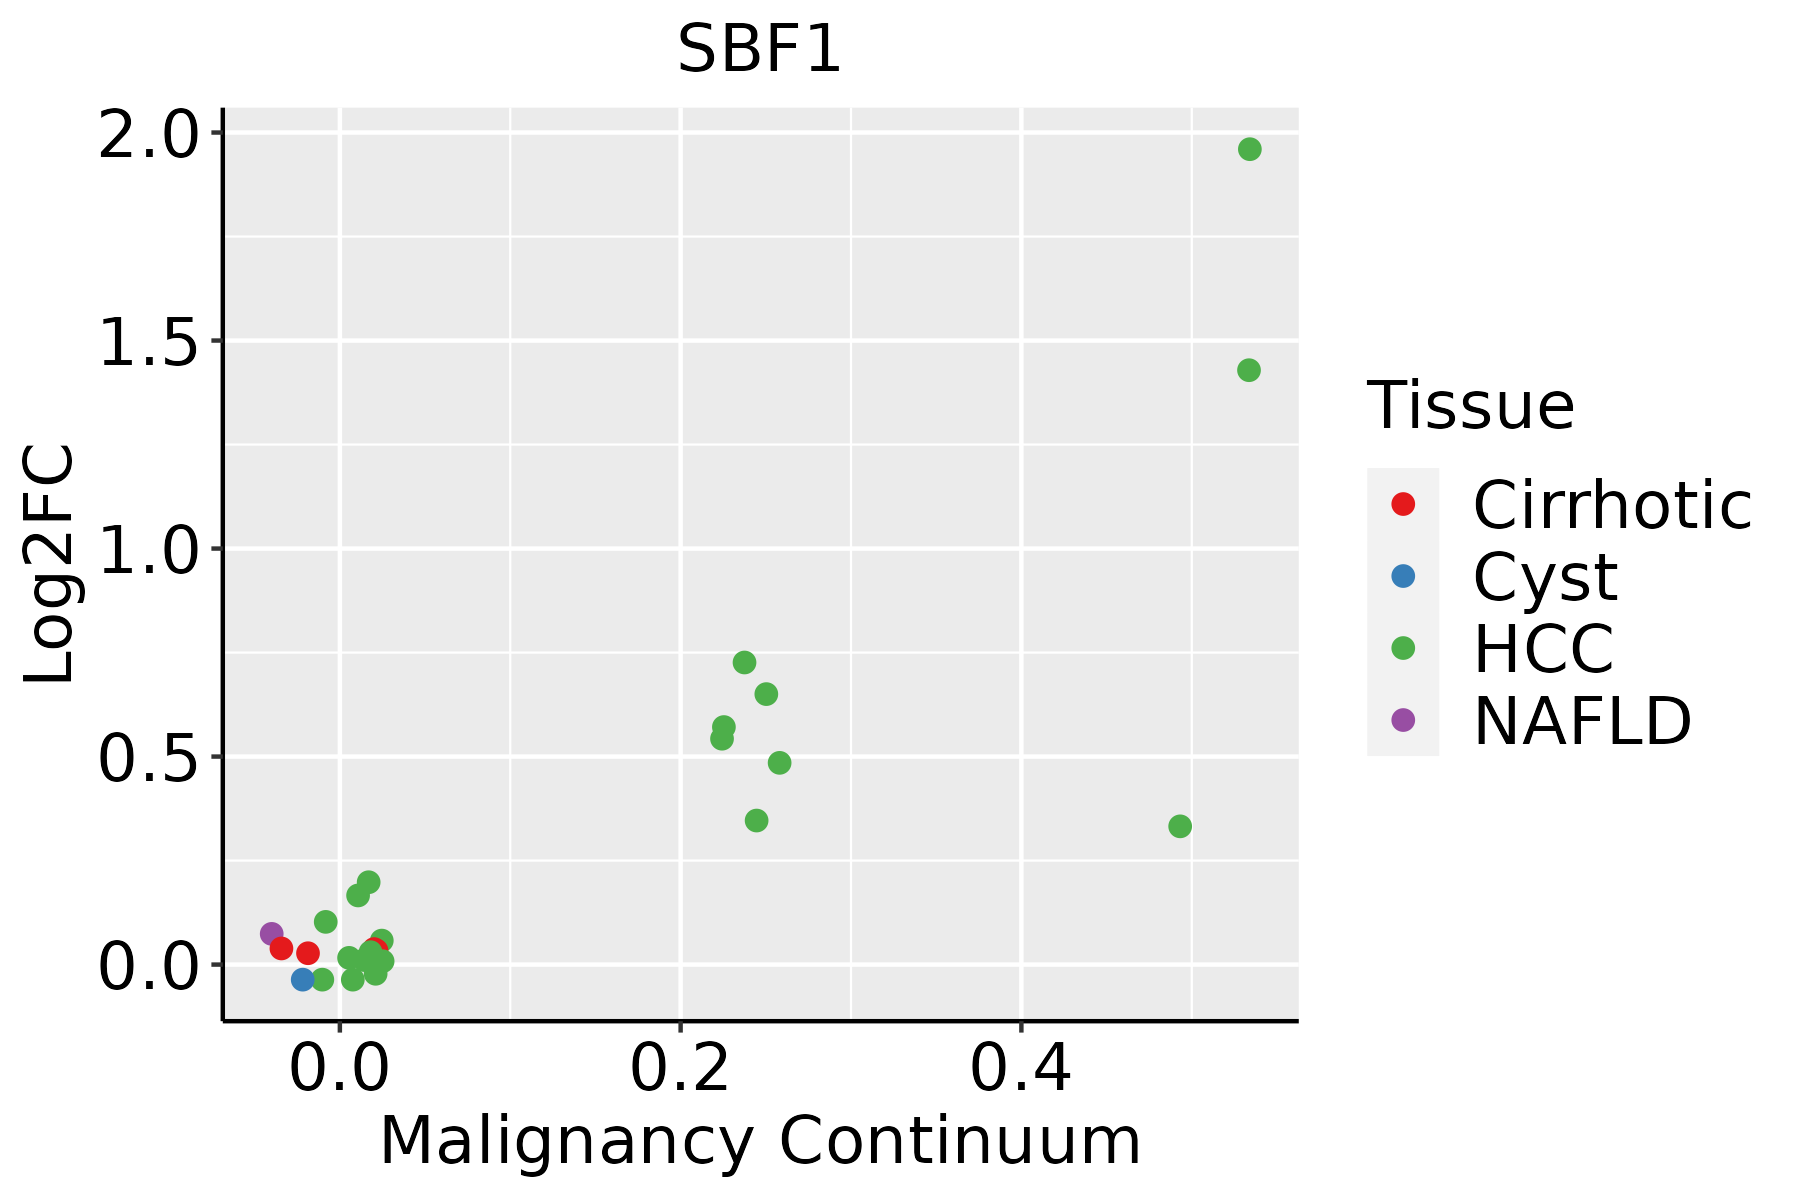 | HCC: Hepatocellular carcinoma |
| NAFLD: Non-alcoholic fatty liver disease | ||
| Oral Cavity |  | EOLP: Erosive Oral lichen planus |
| LP: leukoplakia | ||
| NEOLP: Non-erosive oral lichen planus | ||
| OSCC: Oral squamous cell carcinoma | ||
| Thyroid | 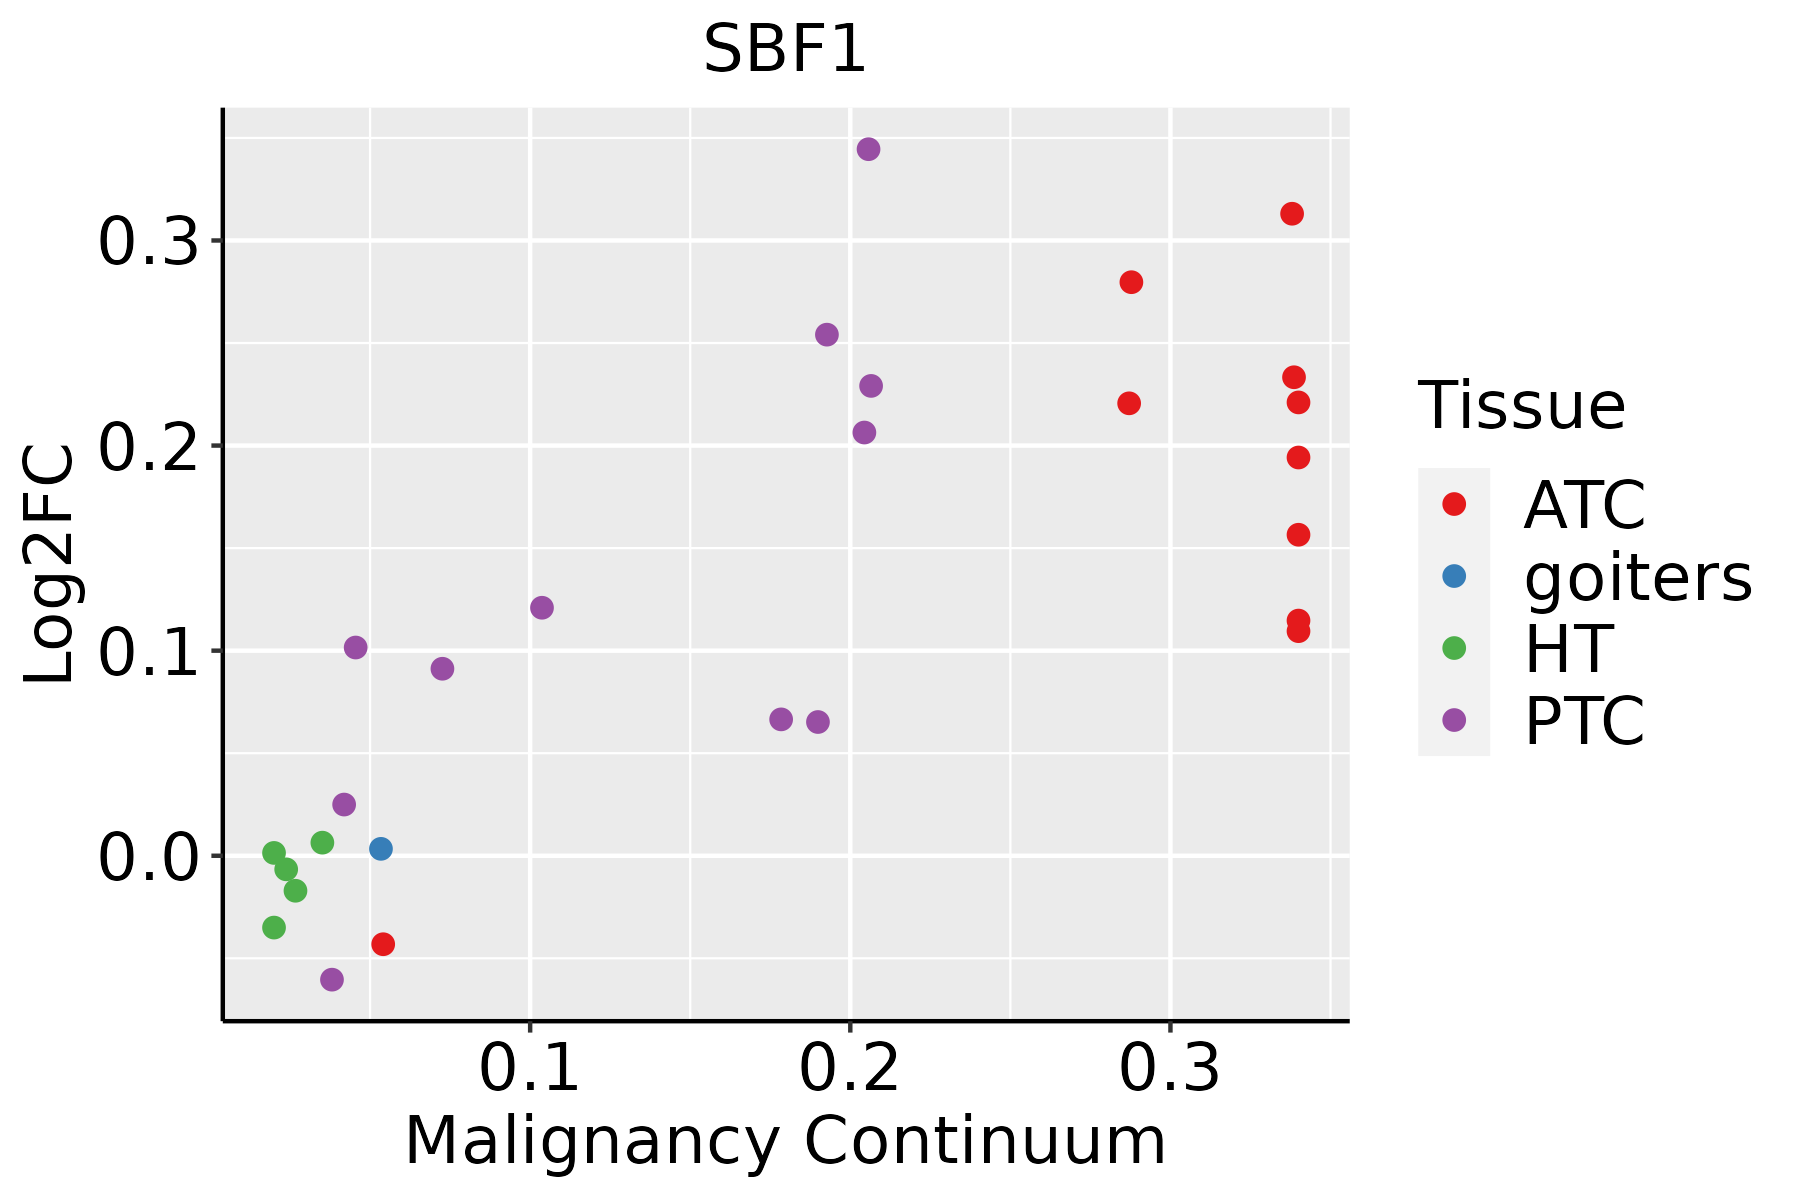 | ATC: Anaplastic thyroid cancer |
| HT: Hashimoto's thyroiditis | ||
| PTC: Papillary thyroid cancer |
| ∗log2FC in expression of this searched gene in stem-like cells from each diseased tissue sample relative to stem-like cells in normal samples in each tissue plotted against the malignancy continuum. Samples are colored based on if they are from different disease stage. |
Top |
Malignant transformation related pathway analysis |
| Find out the enriched GO biological processes and KEGG pathways involved in transition from healthy to precancer to cancer |
| Tissue | Disease Stage | Enriched GO biological Processes |
| Colorectum | AD |  |
| Colorectum | SER |  |
| Colorectum | MSS |  |
| Colorectum | MSI-H |  |
| Colorectum | FAP |  |
| ∗Top 15 enriched GO BP terms are showed in the bar plot of each disease state in each tissue. Each row represents a significant GO biological process which is colored according to the -log10(p.adjust). |
| Page: 1 2 3 4 5 6 7 8 9 |
| GO ID | Tissue | Disease Stage | Description | Gene Ratio | Bg Ratio | pvalue | p.adjust | Count |
| GO:001631110 | Esophagus | ESCC | dephosphorylation | 251/8552 | 417/18723 | 1.26e-09 | 2.99e-08 | 251 |
| GO:000647018 | Esophagus | ESCC | protein dephosphorylation | 177/8552 | 281/18723 | 3.13e-09 | 6.72e-08 | 177 |
| GO:004308715 | Esophagus | ESCC | regulation of GTPase activity | 183/8552 | 348/18723 | 5.34e-03 | 2.00e-02 | 183 |
| GO:001631121 | Liver | HCC | dephosphorylation | 230/7958 | 417/18723 | 1.00e-07 | 1.96e-06 | 230 |
| GO:000647021 | Liver | HCC | protein dephosphorylation | 162/7958 | 281/18723 | 1.91e-07 | 3.46e-06 | 162 |
| GO:000647015 | Oral cavity | OSCC | protein dephosphorylation | 162/7305 | 281/18723 | 1.56e-10 | 4.56e-09 | 162 |
| GO:00163119 | Oral cavity | OSCC | dephosphorylation | 220/7305 | 417/18723 | 6.33e-09 | 1.34e-07 | 220 |
| GO:004308710 | Oral cavity | OSCC | regulation of GTPase activity | 165/7305 | 348/18723 | 7.94e-04 | 4.27e-03 | 165 |
| GO:000647016 | Oral cavity | LP | protein dephosphorylation | 89/4623 | 281/18723 | 4.60e-03 | 2.93e-02 | 89 |
| GO:001631116 | Thyroid | PTC | dephosphorylation | 174/5968 | 417/18723 | 1.20e-05 | 1.31e-04 | 174 |
| GO:004308718 | Thyroid | PTC | regulation of GTPase activity | 148/5968 | 348/18723 | 1.63e-05 | 1.71e-04 | 148 |
| GO:000647020 | Thyroid | PTC | protein dephosphorylation | 123/5968 | 281/18723 | 1.69e-05 | 1.77e-04 | 123 |
| GO:0006470111 | Thyroid | ATC | protein dephosphorylation | 129/6293 | 281/18723 | 1.11e-05 | 1.09e-04 | 129 |
| GO:004308719 | Thyroid | ATC | regulation of GTPase activity | 153/6293 | 348/18723 | 3.24e-05 | 2.68e-04 | 153 |
| GO:001631117 | Thyroid | ATC | dephosphorylation | 179/6293 | 417/18723 | 3.88e-05 | 3.15e-04 | 179 |
| Page: 1 |
| Pathway ID | Tissue | Disease Stage | Description | Gene Ratio | Bg Ratio | pvalue | p.adjust | qvalue | Count |
| Page: 1 |
Top |
Cell-cell communication analysis |
| Identification of potential cell-cell interactions between two cell types and their ligand-receptor pairs for different disease states |
| Ligand | Receptor | LRpair | Pathway | Tissue | Disease Stage |
| Page: 1 |
Top |
Single-cell gene regulatory network inference analysis |
| Find out the significant the regulons (TFs) and the target genes of each regulon across cell types for different disease states |
| TF | Cell Type | Tissue | Disease Stage | Target Gene | RSS | Regulon Activity |
| ∗The dot plots of a searched regulon are shown for all cell subpopulations in each disease state of each tissue based on the regulon specific score inferred using pySCENIC and by calculating the average expression. |
| Page: 1 |
Top |
Somatic mutation of malignant transformation related genes |
| Annotation of somatic variants for genes involved in malignant transformation |
| Hugo Symbol | Variant Class | Variant Classification | dbSNP RS | HGVSc | HGVSp | HGVSp Short | SWISSPROT | BIOTYPE | SIFT | PolyPhen | Tumor Sample Barcode | Tissue | Histology | Sex | Age | Stage | Therapy Types | Drugs | Outcome |
| SBF1 | SNV | Missense_Mutation | c.5143N>C | p.Asp1715His | p.D1715H | O95248 | protein_coding | tolerated(0.05) | possibly_damaging(0.799) | TCGA-A2-A0ER-01 | Breast | breast invasive carcinoma | Female | <65 | I/II | Chemotherapy | cytoxan | SD | |
| SBF1 | SNV | Missense_Mutation | novel | c.3908N>C | p.Lys1303Thr | p.K1303T | O95248 | protein_coding | tolerated(0.09) | probably_damaging(0.996) | TCGA-A7-A6VX-01 | Breast | breast invasive carcinoma | Female | >=65 | I/II | Chemotherapy | docetaxel | CR |
| SBF1 | SNV | Missense_Mutation | c.719N>A | p.Ser240Tyr | p.S240Y | O95248 | protein_coding | deleterious(0) | probably_damaging(0.996) | TCGA-AC-A23H-01 | Breast | breast invasive carcinoma | Female | >=65 | I/II | Unknown | Unknown | PD | |
| SBF1 | SNV | Missense_Mutation | rs774485881 | c.4796N>T | p.Ala1599Val | p.A1599V | O95248 | protein_coding | deleterious(0.04) | benign(0.397) | TCGA-AQ-A7U7-01 | Breast | breast invasive carcinoma | Female | <65 | III/IV | Targeted Molecular therapy | rituximab | CR |
| SBF1 | SNV | Missense_Mutation | c.241G>A | p.Ala81Thr | p.A81T | O95248 | protein_coding | deleterious(0) | possibly_damaging(0.469) | TCGA-BH-A0HA-01 | Breast | breast invasive carcinoma | Female | <65 | I/II | Unknown | Unknown | SD | |
| SBF1 | SNV | Missense_Mutation | rs748349988 | c.2516N>T | p.Thr839Met | p.T839M | O95248 | protein_coding | deleterious(0.02) | probably_damaging(0.916) | TCGA-D8-A1XQ-01 | Breast | breast invasive carcinoma | Female | >=65 | I/II | Unknown | Unknown | SD |
| SBF1 | SNV | Missense_Mutation | c.2950N>T | p.Arg984Cys | p.R984C | O95248 | protein_coding | deleterious(0) | probably_damaging(0.997) | TCGA-D8-A27G-01 | Breast | breast invasive carcinoma | Female | >=65 | I/II | Unknown | Unknown | SD | |
| SBF1 | SNV | Missense_Mutation | rs754556678 | c.2429N>T | p.Thr810Met | p.T810M | O95248 | protein_coding | deleterious(0) | possibly_damaging(0.87) | TCGA-E2-A14R-01 | Breast | breast invasive carcinoma | Female | <65 | I/II | Chemotherapy | doxorubicin | PD |
| SBF1 | deletion | Frame_Shift_Del | novel | c.5682delA | p.Ter1894TrpfsTer36 | p.*1894Wfs*36 | O95248 | protein_coding | TCGA-D8-A27V-01 | Breast | breast invasive carcinoma | Female | <65 | I/II | Hormone Therapy | tamoxiphen | SD | ||
| SBF1 | deletion | Frame_Shift_Del | novel | c.5121delA | p.Gln1708SerfsTer41 | p.Q1708Sfs*41 | O95248 | protein_coding | TCGA-EW-A2FV-01 | Breast | breast invasive carcinoma | Female | <65 | III/IV | Chemotherapy | docetaxel | SD |
| Page: 1 2 3 4 5 6 7 8 9 10 11 12 13 14 15 16 17 18 19 |
Top |
Related drugs of malignant transformation related genes |
| Identification of chemicals and drugs interact with genes involved in malignant transfromation |
| (DGIdb 4.0) |
| Entrez ID | Symbol | Category | Interaction Types | Drug Claim Name | Drug Name | PMIDs |
| Page: 1 |

Copyright 2023-Present -The University of Texas Health Science Center at Houston |