
|
|||||
|
 | |
| |
| |
| |
| |
| |
|
Gene: SBDS |
Gene summary for SBDS |
| Gene information | Species | Human | Gene symbol | SBDS | Gene ID | 51119 |
| Gene name | SBDS ribosome maturation factor | |
| Gene Alias | CGI-97 | |
| Cytomap | 7q11.21 | |
| Gene Type | protein-coding | GO ID | GO:0000226 | UniProtAcc | A0A0S2Z5I7 |
Top |
Malignant transformation analysis |
| Identification of the aberrant gene expression in precancerous and cancerous lesions by comparing the gene expression of stem-like cells in diseased tissues with normal stem cells |
| Entrez ID | Symbol | Replicates | Species | Organ | Tissue | Adj P-value | Log2FC | Malignancy |
| 51119 | SBDS | CA_HPV_1 | Human | Cervix | CC | 3.30e-09 | -1.97e-01 | 0.0264 |
| 51119 | SBDS | HSIL_HPV_2 | Human | Cervix | HSIL_HPV | 2.67e-03 | -2.77e-01 | 0.0208 |
| 51119 | SBDS | CCI_1 | Human | Cervix | CC | 3.22e-02 | -4.90e-01 | 0.528 |
| 51119 | SBDS | CCI_3 | Human | Cervix | CC | 1.78e-06 | -5.39e-01 | 0.516 |
| 51119 | SBDS | CCII_1 | Human | Cervix | CC | 1.60e-14 | -5.70e-01 | 0.3249 |
| 51119 | SBDS | HTA11_78_2000001011 | Human | Colorectum | AD | 2.72e-09 | 5.23e-01 | -0.1088 |
| 51119 | SBDS | HTA11_347_2000001011 | Human | Colorectum | AD | 2.27e-06 | 4.55e-01 | -0.1954 |
| 51119 | SBDS | HTA11_696_2000001011 | Human | Colorectum | AD | 2.64e-02 | 2.73e-01 | -0.1464 |
| 51119 | SBDS | HTA11_866_2000001011 | Human | Colorectum | AD | 3.66e-02 | 1.06e-01 | -0.1001 |
| 51119 | SBDS | HTA11_2992_2000001011 | Human | Colorectum | SER | 5.85e-03 | 6.53e-01 | -0.1706 |
| 51119 | SBDS | HTA11_99999970781_79442 | Human | Colorectum | MSS | 5.53e-08 | 4.21e-01 | 0.294 |
| 51119 | SBDS | HTA11_99999965104_69814 | Human | Colorectum | MSS | 5.00e-17 | 9.61e-01 | 0.281 |
| 51119 | SBDS | HTA11_99999971662_82457 | Human | Colorectum | MSS | 7.03e-15 | 5.07e-01 | 0.3859 |
| 51119 | SBDS | HTA11_99999974143_84620 | Human | Colorectum | MSS | 9.51e-05 | 2.55e-01 | 0.3005 |
| 51119 | SBDS | A002-C-201 | Human | Colorectum | FAP | 8.62e-04 | -9.51e-02 | 0.0324 |
| 51119 | SBDS | AEH-subject1 | Human | Endometrium | AEH | 1.91e-04 | -1.90e-01 | -0.3059 |
| 51119 | SBDS | AEH-subject2 | Human | Endometrium | AEH | 2.90e-09 | -1.89e-01 | -0.2525 |
| 51119 | SBDS | AEH-subject3 | Human | Endometrium | AEH | 9.43e-04 | -2.21e-01 | -0.2576 |
| 51119 | SBDS | EEC-subject1 | Human | Endometrium | EEC | 6.29e-10 | -2.56e-01 | -0.2682 |
| 51119 | SBDS | EEC-subject2 | Human | Endometrium | EEC | 1.25e-08 | -2.71e-01 | -0.2607 |
| Page: 1 2 3 4 5 6 7 8 9 10 11 12 |
| Tissue | Expression Dynamics | Abbreviation |
| Cervix | 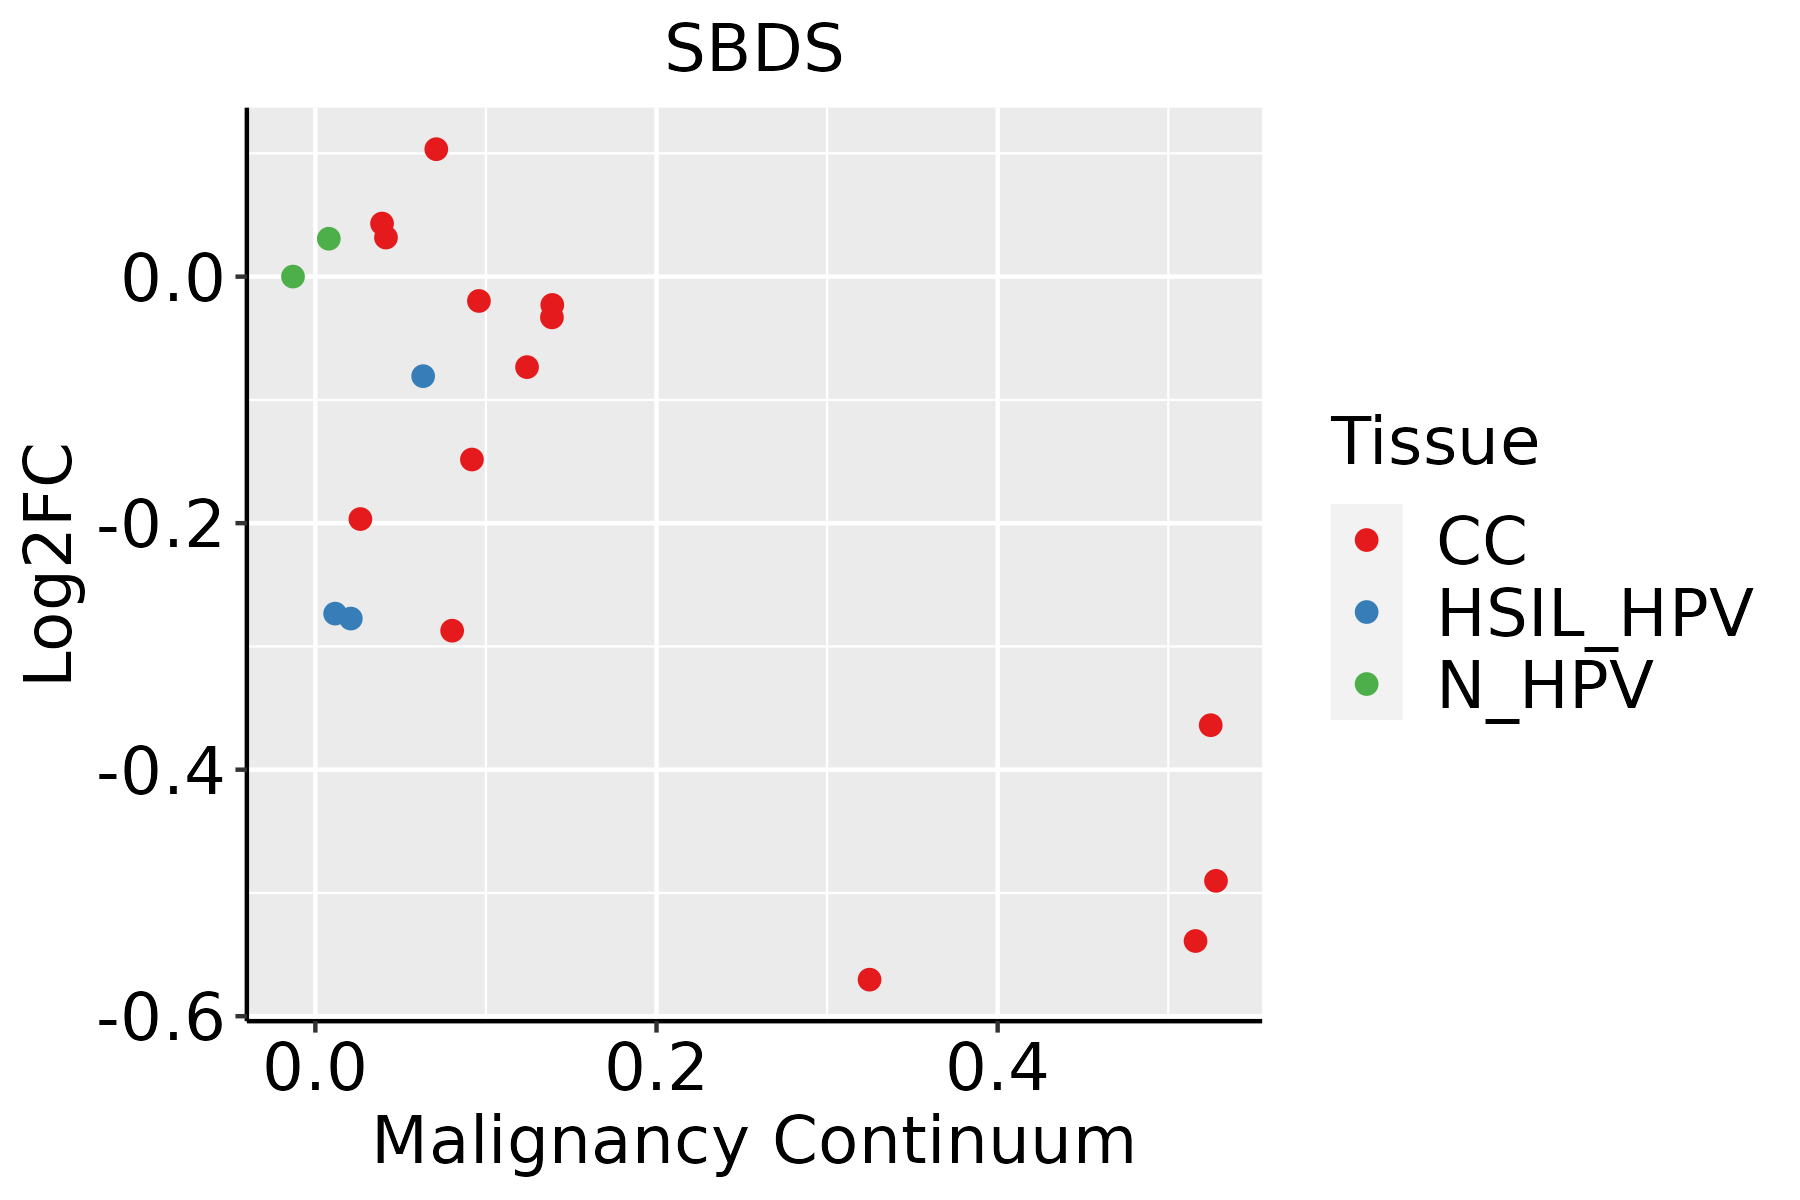 | CC: Cervix cancer |
| HSIL_HPV: HPV-infected high-grade squamous intraepithelial lesions | ||
| N_HPV: HPV-infected normal cervix | ||
| Colorectum (GSE201348) |  | FAP: Familial adenomatous polyposis |
| CRC: Colorectal cancer | ||
| Colorectum (HTA11) |  | AD: Adenomas |
| SER: Sessile serrated lesions | ||
| MSI-H: Microsatellite-high colorectal cancer | ||
| MSS: Microsatellite stable colorectal cancer | ||
| Endometrium | 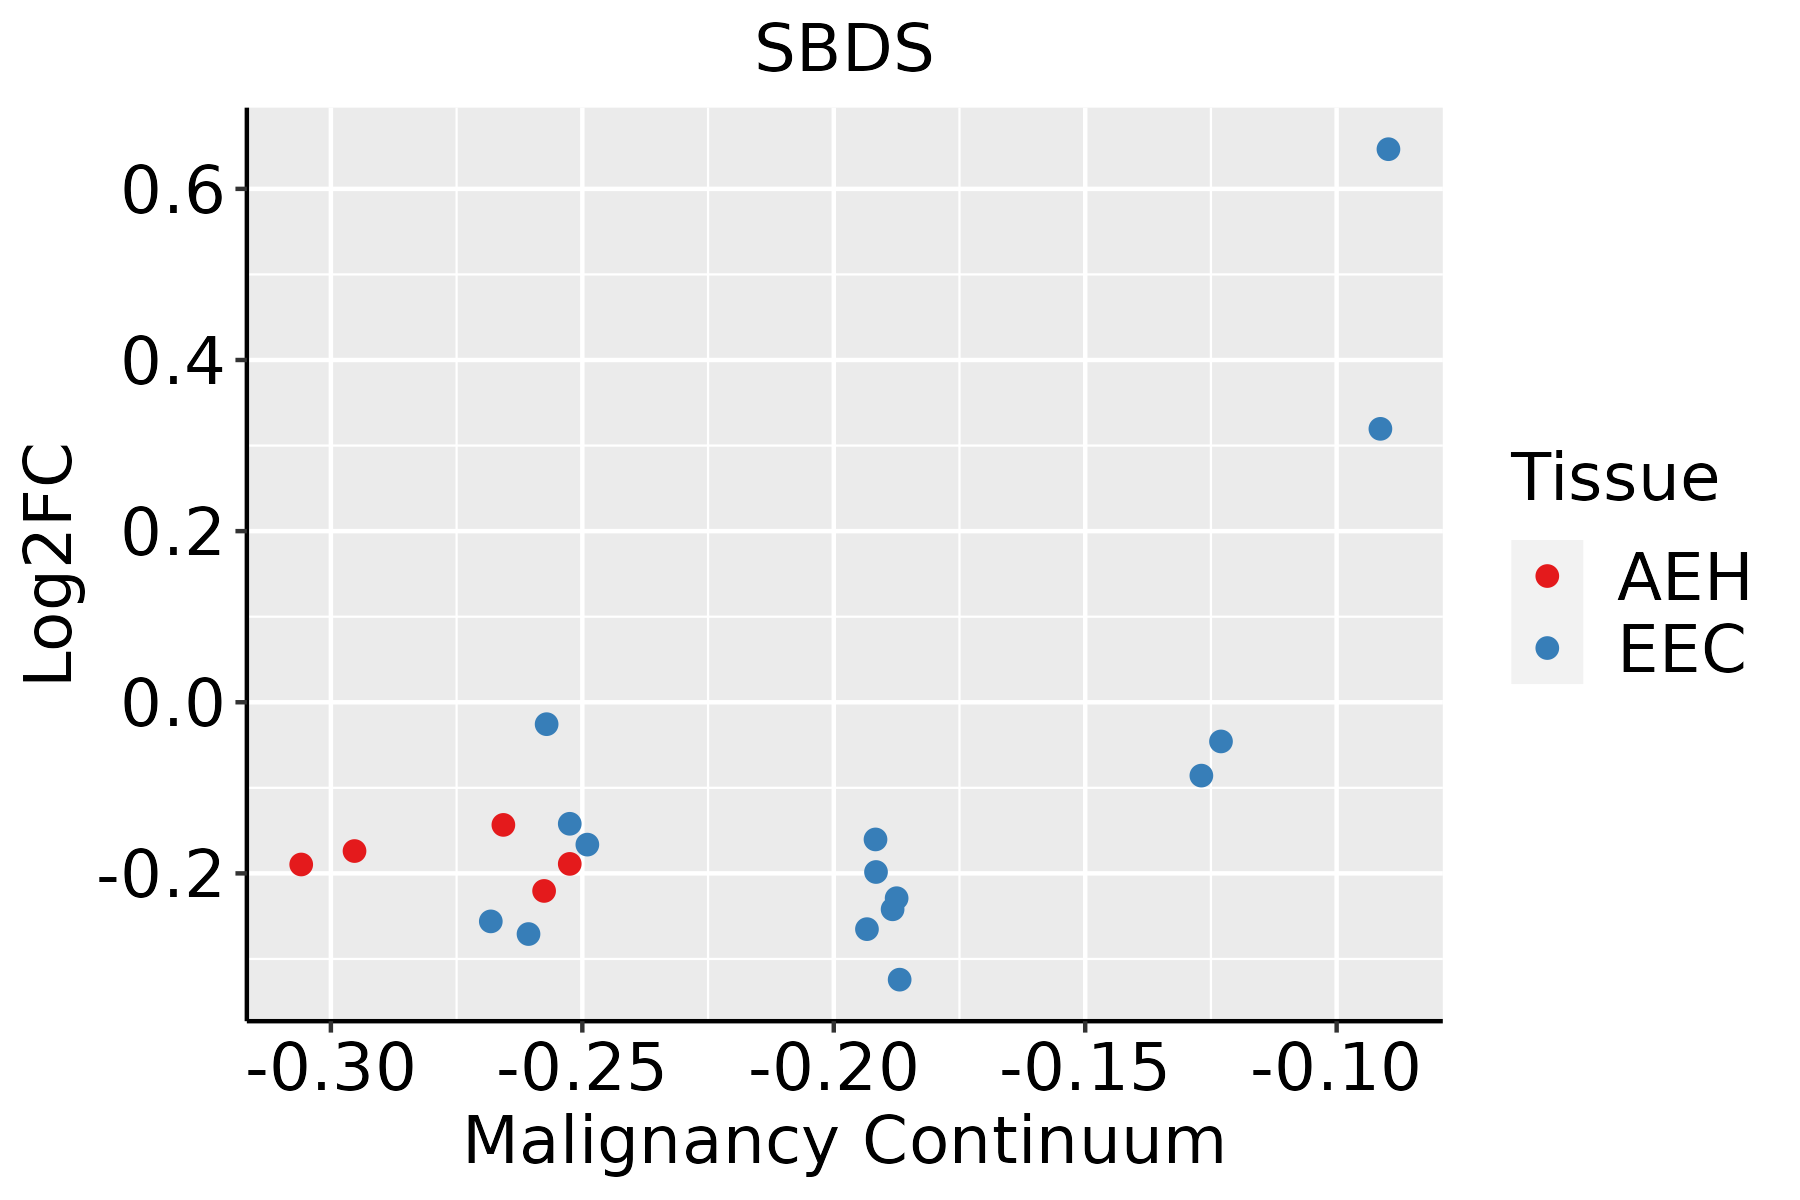 | AEH: Atypical endometrial hyperplasia |
| EEC: Endometrioid Cancer | ||
| Esophagus | 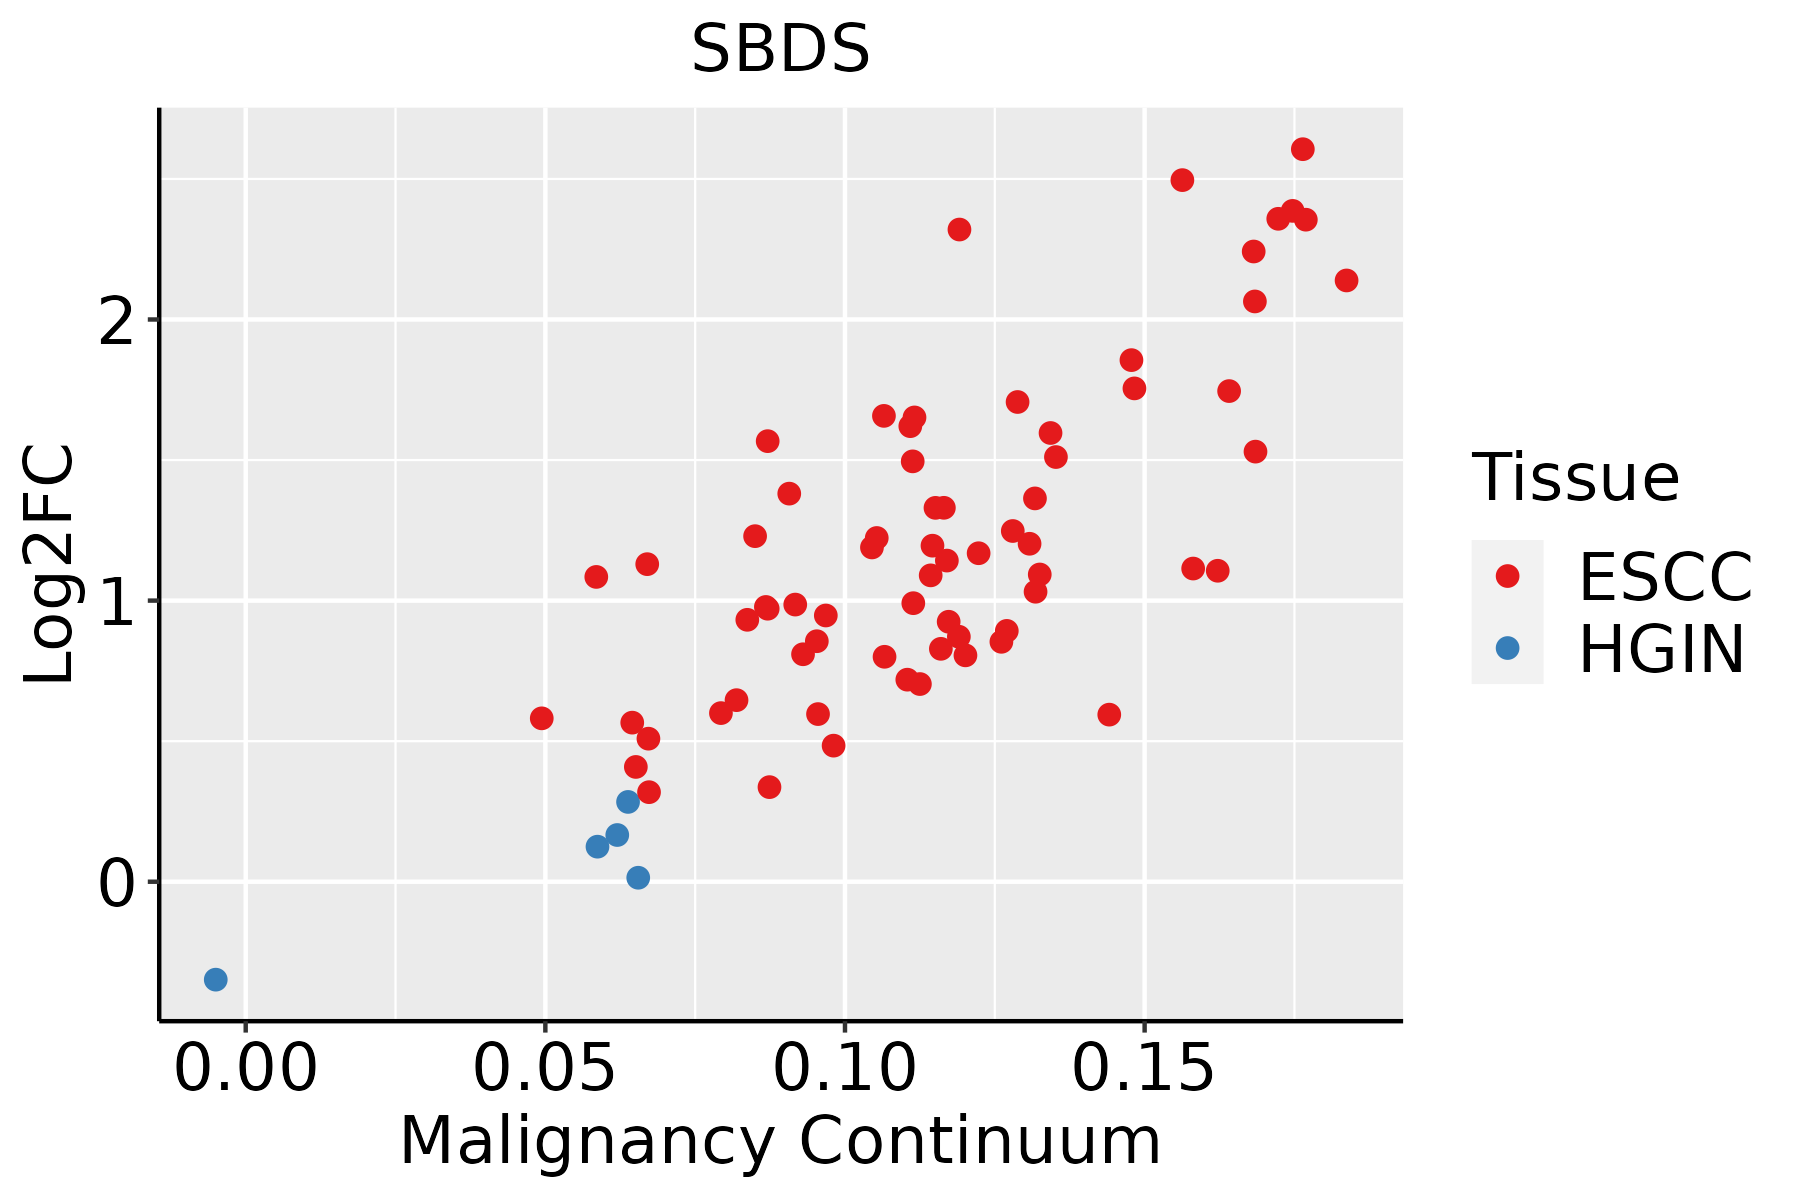 | ESCC: Esophageal squamous cell carcinoma |
| HGIN: High-grade intraepithelial neoplasias | ||
| LGIN: Low-grade intraepithelial neoplasias | ||
| GC |  | CAG: Chronic atrophic gastritis |
| CAG with IM: Chronic atrophic gastritis with intestinal metaplasia | ||
| CSG: Chronic superficial gastritis | ||
| GC: Gastric cancer | ||
| SIM: Severe intestinal metaplasia | ||
| WIM: Wild intestinal metaplasia | ||
| Liver | 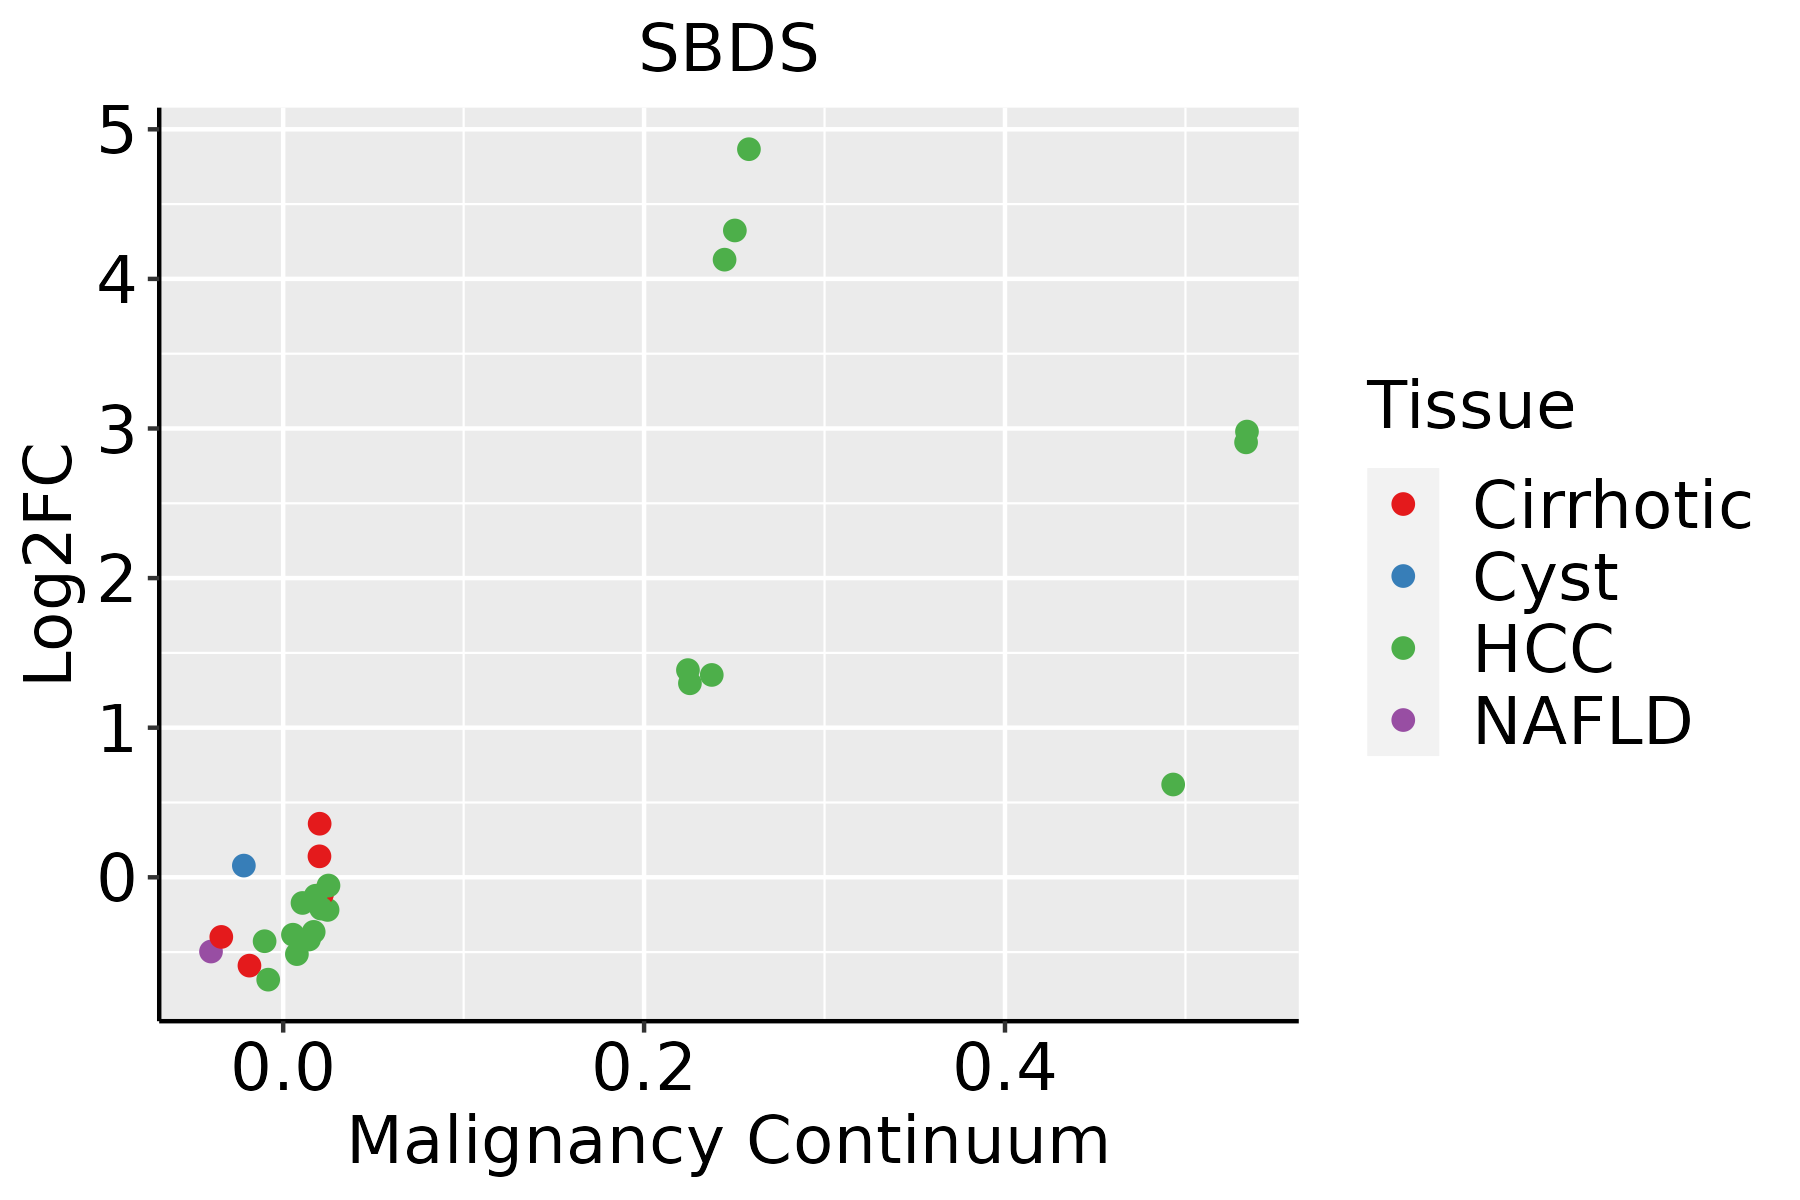 | HCC: Hepatocellular carcinoma |
| NAFLD: Non-alcoholic fatty liver disease | ||
| Oral Cavity | 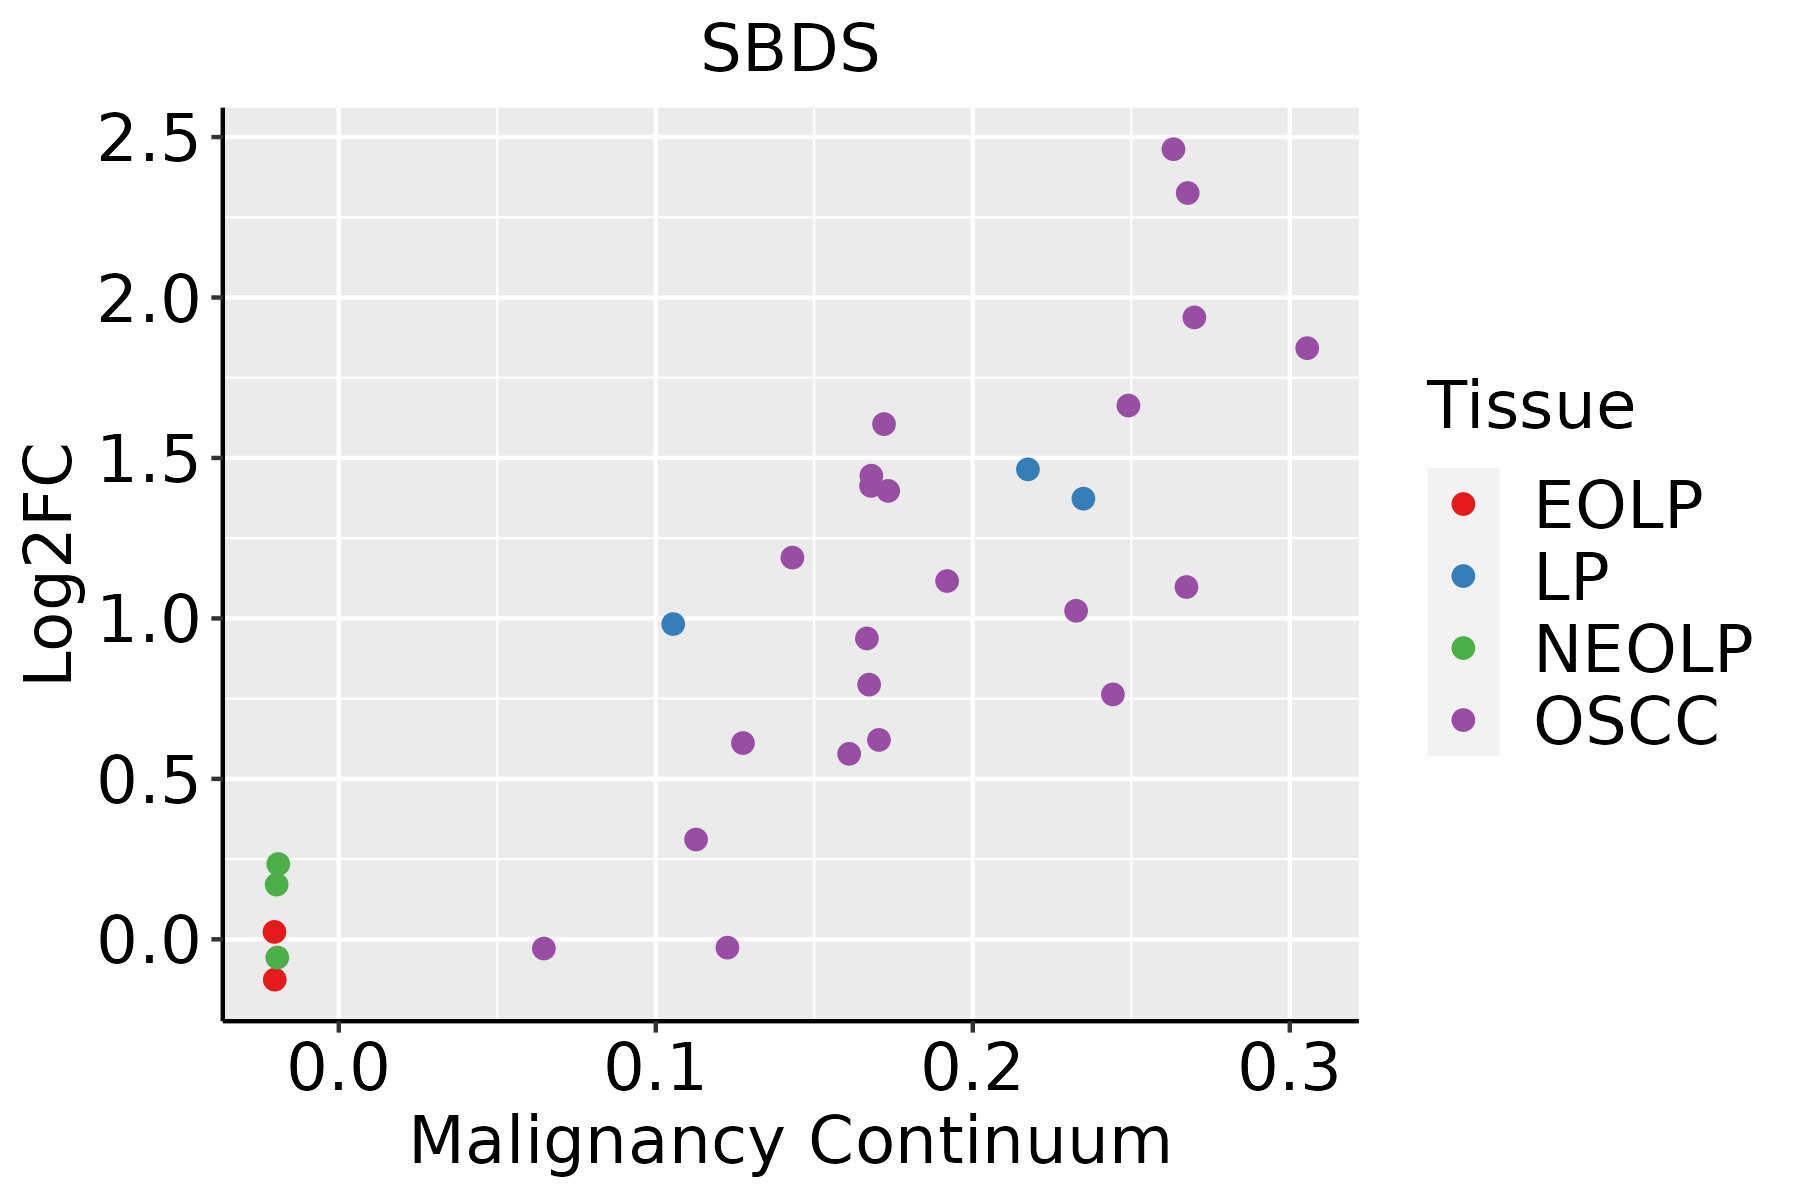 | EOLP: Erosive Oral lichen planus |
| LP: leukoplakia | ||
| NEOLP: Non-erosive oral lichen planus | ||
| OSCC: Oral squamous cell carcinoma | ||
| Prostate | 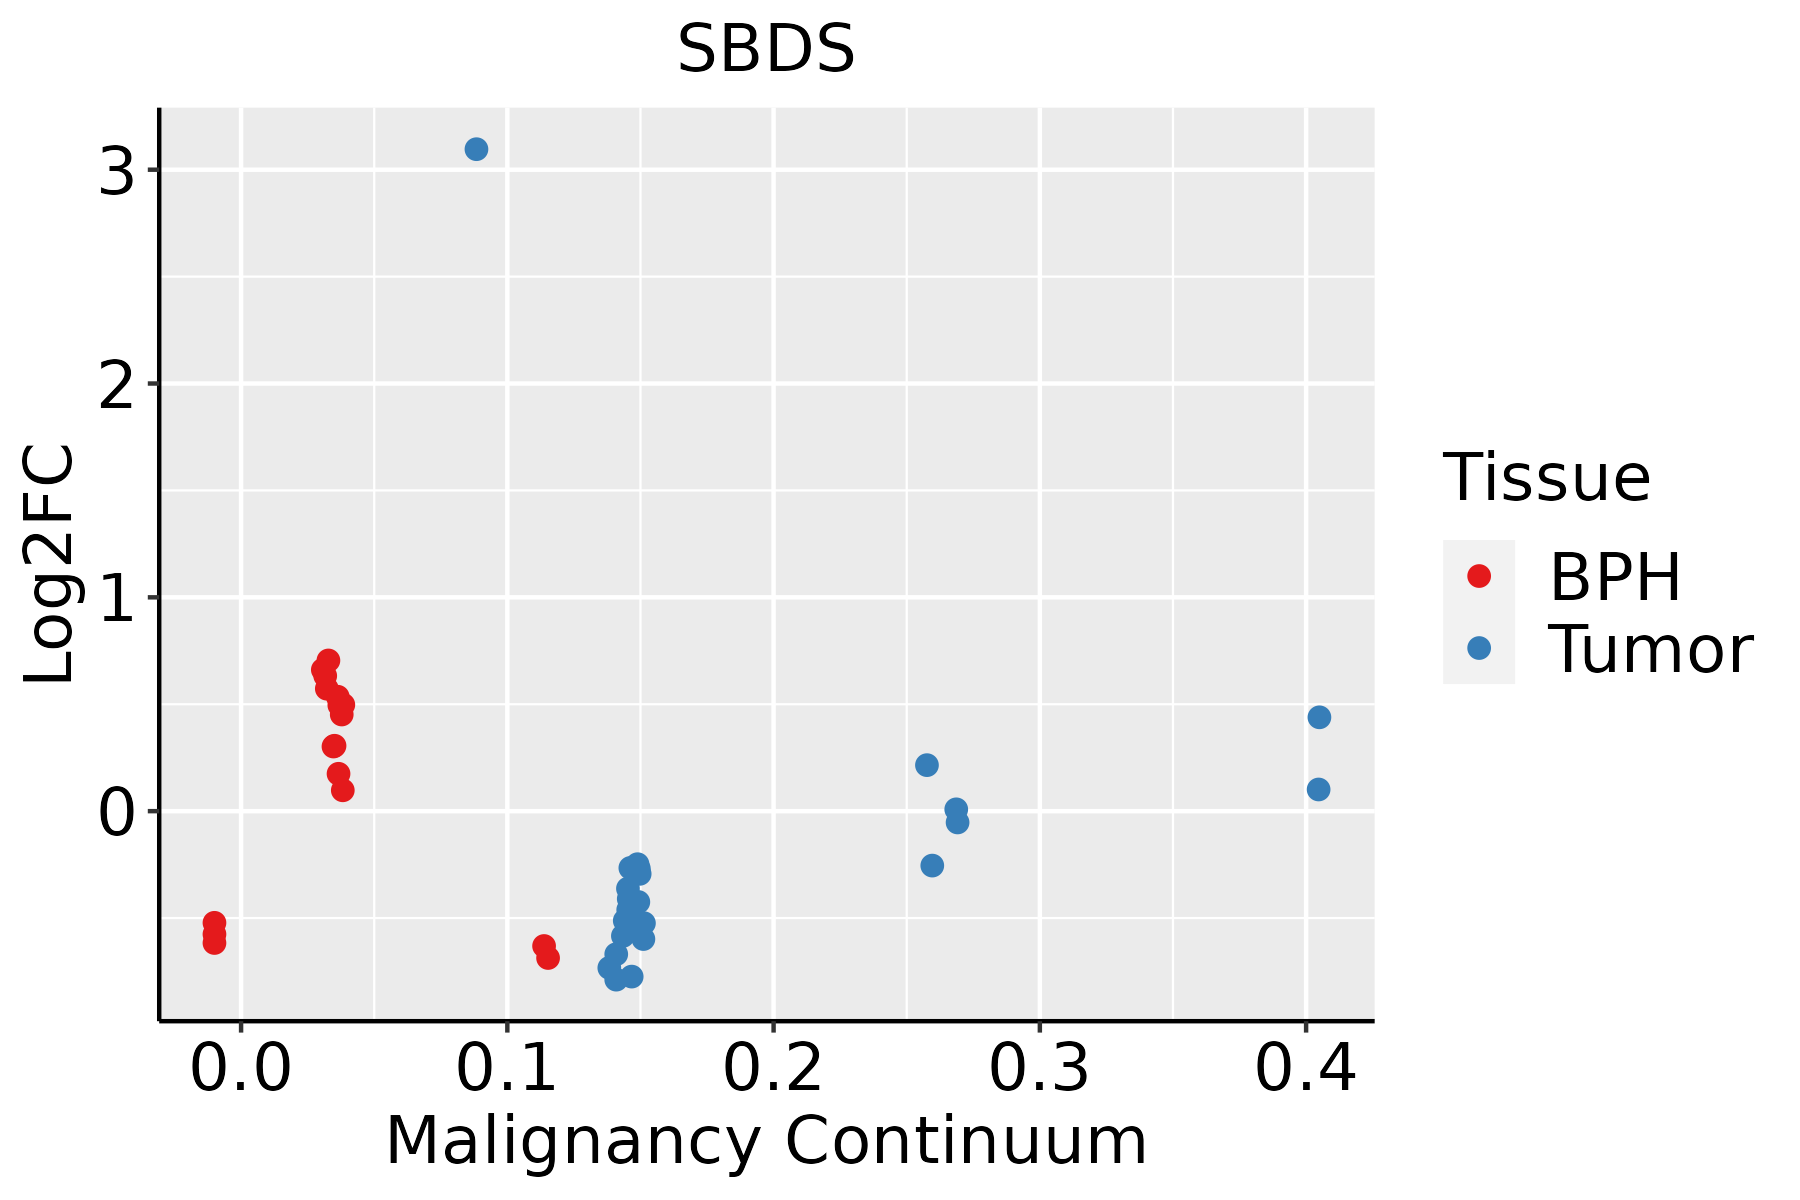 | BPH: Benign Prostatic Hyperplasia |
| Skin | 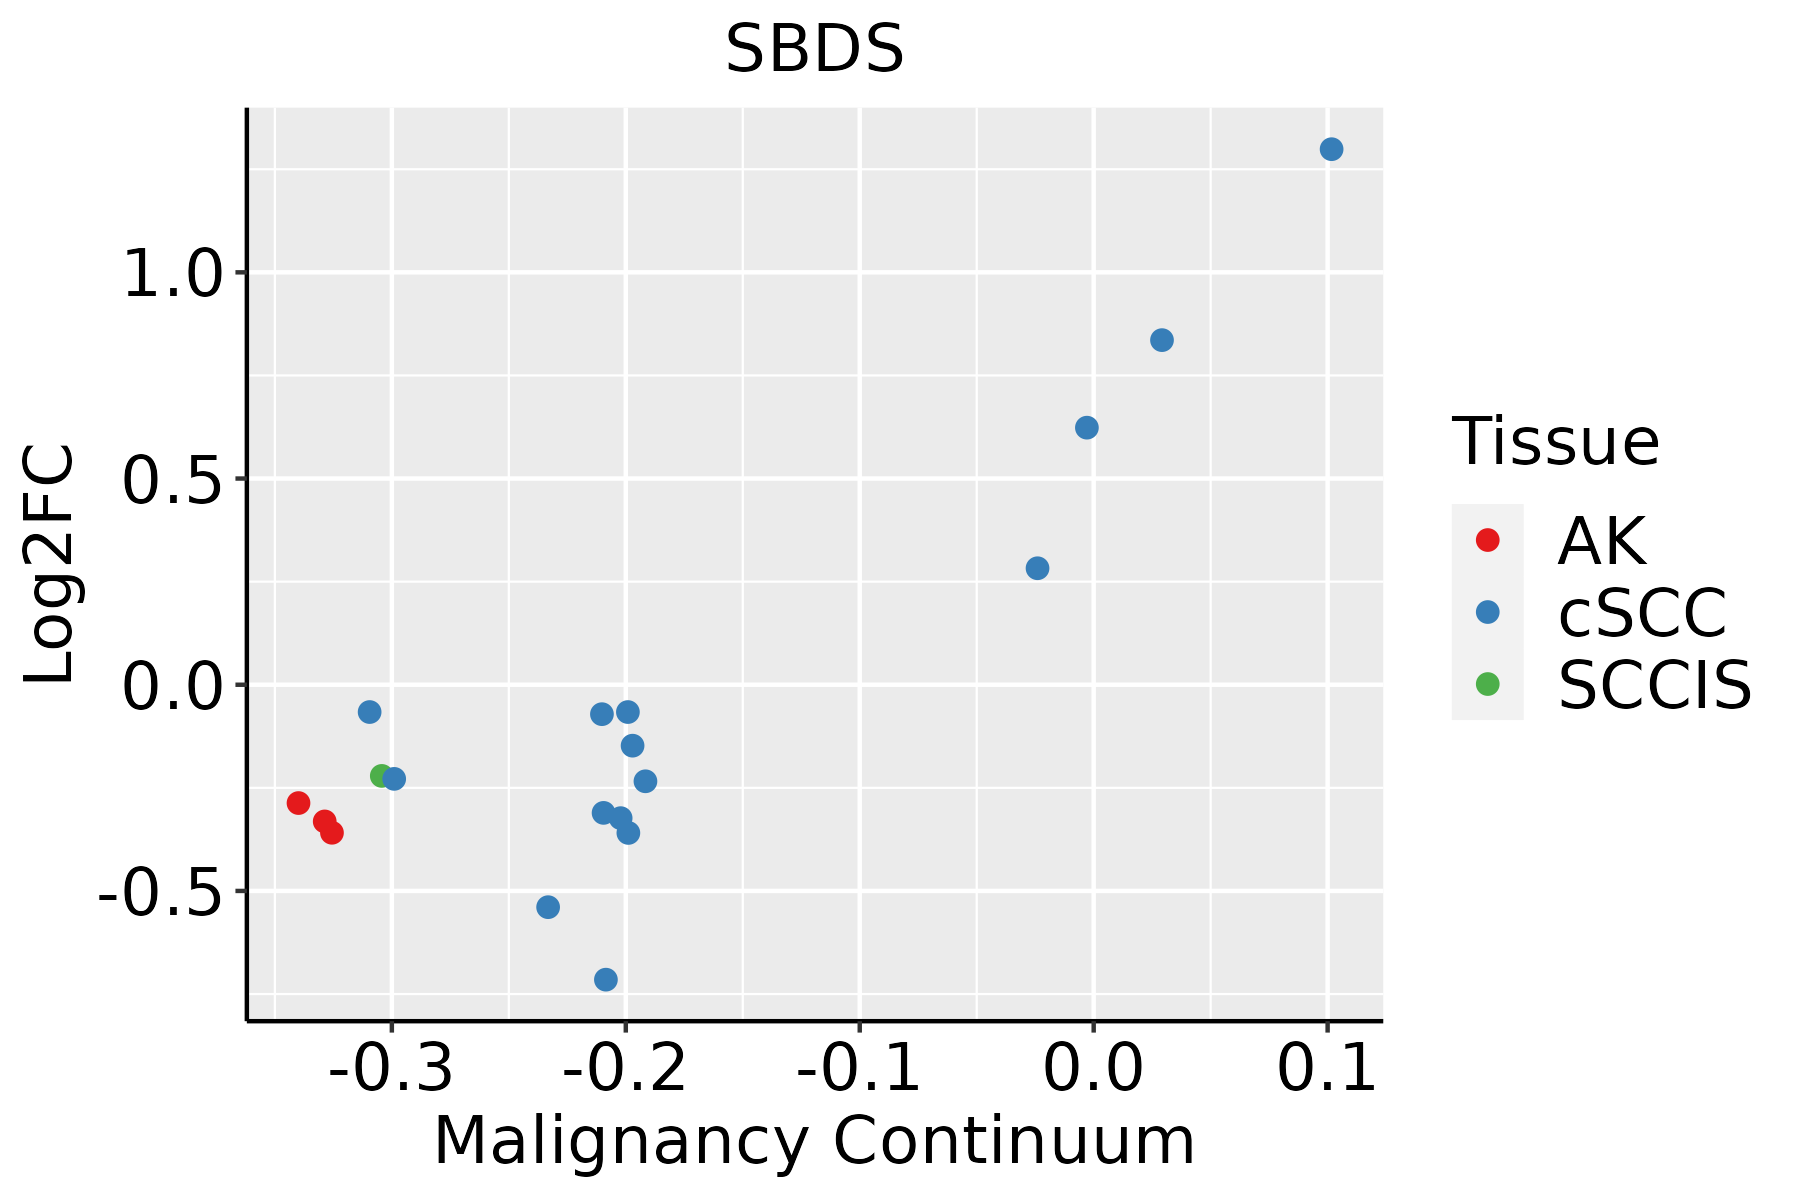 | AK: Actinic keratosis |
| cSCC: Cutaneous squamous cell carcinoma | ||
| SCCIS:squamous cell carcinoma in situ | ||
| Thyroid | 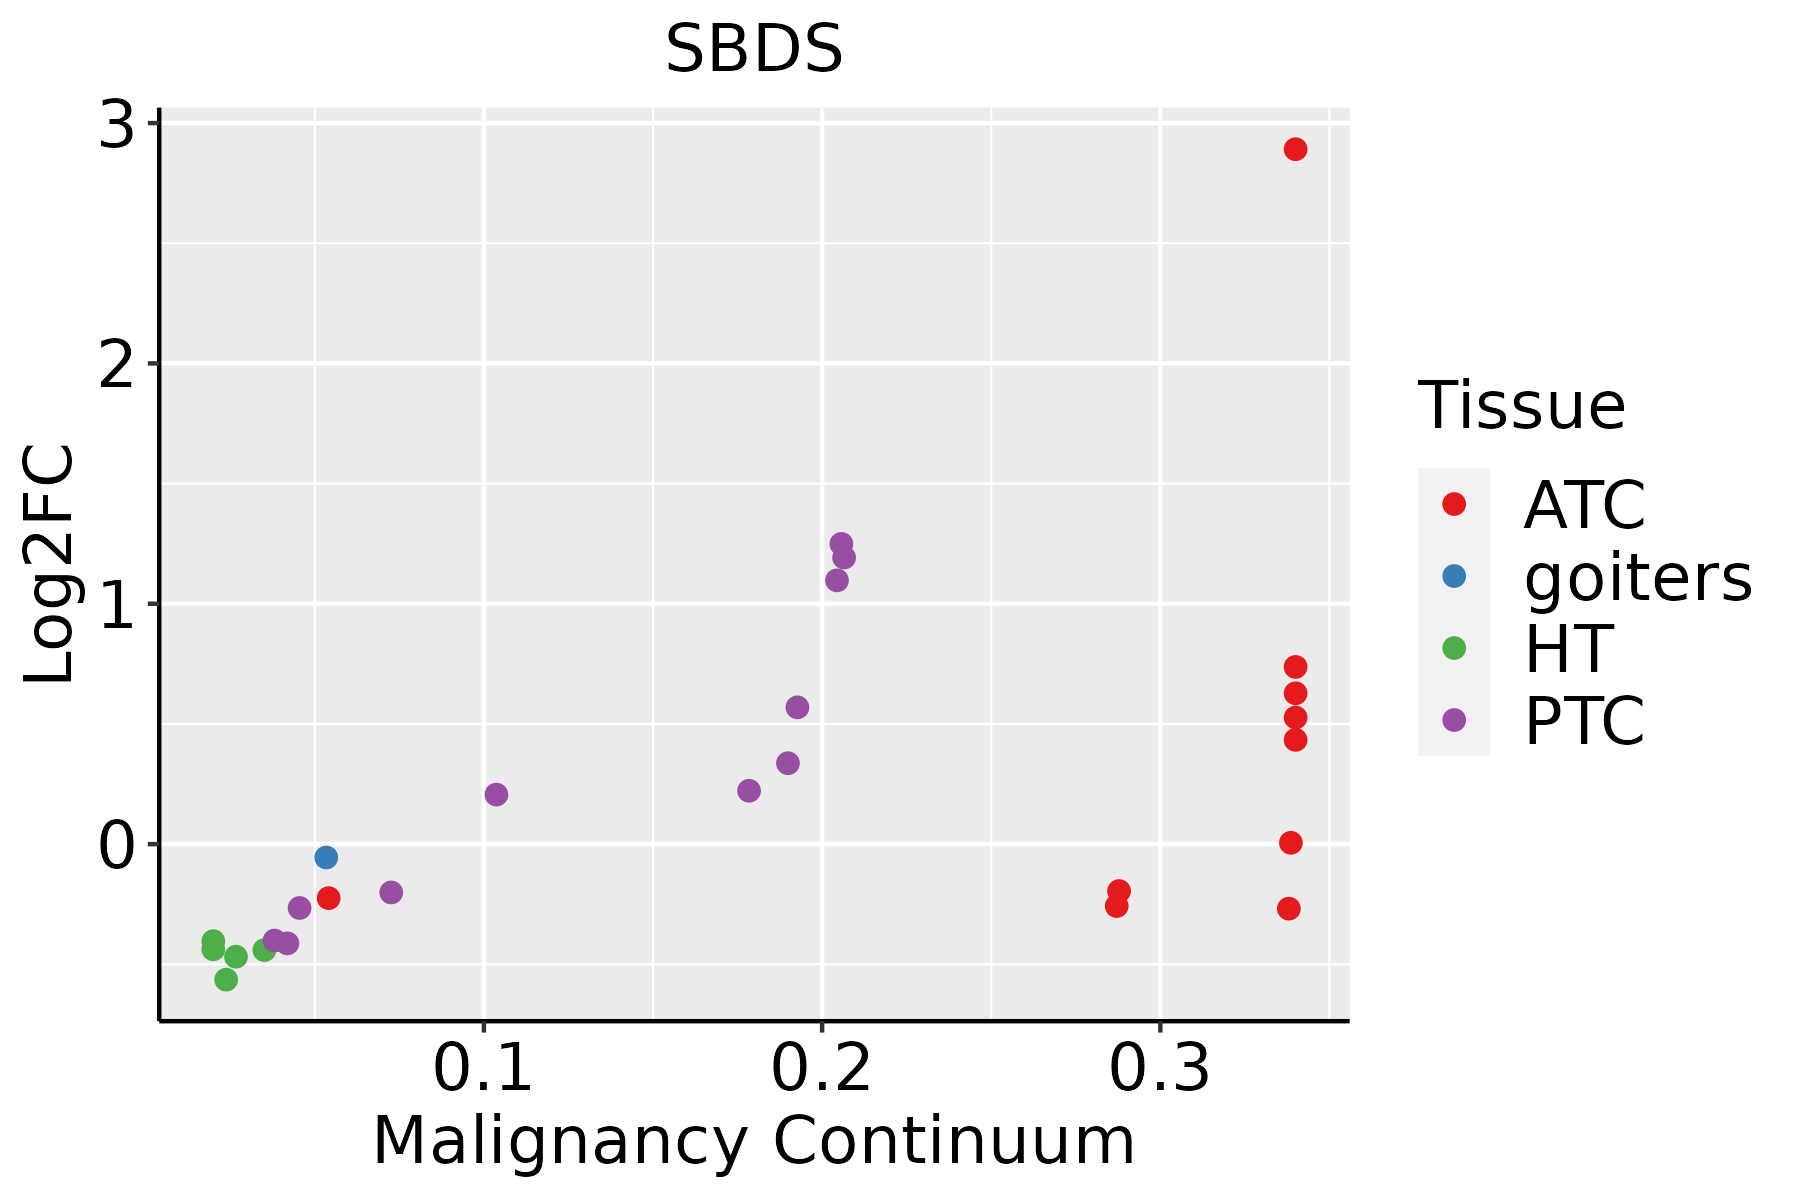 | ATC: Anaplastic thyroid cancer |
| HT: Hashimoto's thyroiditis | ||
| PTC: Papillary thyroid cancer |
| ∗log2FC in expression of this searched gene in stem-like cells from each diseased tissue sample relative to stem-like cells in normal samples in each tissue plotted against the malignancy continuum. Samples are colored based on if they are from different disease stage. |
Top |
Malignant transformation related pathway analysis |
| Find out the enriched GO biological processes and KEGG pathways involved in transition from healthy to precancer to cancer |
| Tissue | Disease Stage | Enriched GO biological Processes |
| Colorectum | AD |  |
| Colorectum | SER |  |
| Colorectum | MSS |  |
| Colorectum | MSI-H |  |
| Colorectum | FAP |  |
| ∗Top 15 enriched GO BP terms are showed in the bar plot of each disease state in each tissue. Each row represents a significant GO biological process which is colored according to the -log10(p.adjust). |
| Page: 1 2 3 4 5 6 7 8 9 |
| GO ID | Tissue | Disease Stage | Description | Gene Ratio | Bg Ratio | pvalue | p.adjust | Count |
| GO:004225510 | Cervix | CC | ribosome assembly | 25/2311 | 61/18723 | 1.70e-08 | 1.27e-06 | 25 |
| GO:00603267 | Cervix | CC | cell chemotaxis | 73/2311 | 310/18723 | 2.82e-08 | 1.96e-06 | 73 |
| GO:00305957 | Cervix | CC | leukocyte chemotaxis | 57/2311 | 230/18723 | 1.48e-07 | 7.07e-06 | 57 |
| GO:00509007 | Cervix | CC | leukocyte migration | 78/2311 | 369/18723 | 1.09e-06 | 3.80e-05 | 78 |
| GO:002261310 | Cervix | CC | ribonucleoprotein complex biogenesis | 88/2311 | 463/18723 | 2.11e-05 | 3.82e-04 | 88 |
| GO:004225410 | Cervix | CC | ribosome biogenesis | 62/2311 | 299/18723 | 2.48e-05 | 4.27e-04 | 62 |
| GO:00017018 | Cervix | CC | in utero embryonic development | 71/2311 | 367/18723 | 7.21e-05 | 1.00e-03 | 71 |
| GO:00022443 | Cervix | CC | hematopoietic progenitor cell differentiation | 26/2311 | 114/18723 | 1.30e-03 | 1.03e-02 | 26 |
| GO:00015037 | Cervix | CC | ossification | 71/2311 | 408/18723 | 1.67e-03 | 1.28e-02 | 71 |
| GO:0031214 | Cervix | CC | biomineral tissue development | 32/2311 | 169/18723 | 8.73e-03 | 4.48e-02 | 32 |
| GO:00160727 | Cervix | CC | rRNA metabolic process | 42/2311 | 236/18723 | 9.12e-03 | 4.60e-02 | 42 |
| GO:0030282 | Cervix | CC | bone mineralization | 24/2311 | 119/18723 | 1.00e-02 | 4.89e-02 | 24 |
| GO:0110148 | Cervix | CC | biomineralization | 32/2311 | 171/18723 | 1.04e-02 | 4.97e-02 | 32 |
| GO:004225515 | Cervix | HSIL_HPV | ribosome assembly | 20/737 | 61/18723 | 8.44e-14 | 2.03e-10 | 20 |
| GO:002261315 | Cervix | HSIL_HPV | ribonucleoprotein complex biogenesis | 52/737 | 463/18723 | 9.85e-12 | 6.81e-09 | 52 |
| GO:004225415 | Cervix | HSIL_HPV | ribosome biogenesis | 40/737 | 299/18723 | 1.25e-11 | 6.81e-09 | 40 |
| GO:006032612 | Cervix | HSIL_HPV | cell chemotaxis | 36/737 | 310/18723 | 6.69e-09 | 8.80e-07 | 36 |
| GO:003059512 | Cervix | HSIL_HPV | leukocyte chemotaxis | 29/737 | 230/18723 | 3.25e-08 | 2.70e-06 | 29 |
| GO:005090012 | Cervix | HSIL_HPV | leukocyte migration | 38/737 | 369/18723 | 6.67e-08 | 4.59e-06 | 38 |
| GO:00063647 | Cervix | HSIL_HPV | rRNA processing | 27/737 | 225/18723 | 2.67e-07 | 1.55e-05 | 27 |
| Page: 1 2 3 4 5 6 7 8 9 10 11 12 13 14 15 16 |
| Pathway ID | Tissue | Disease Stage | Description | Gene Ratio | Bg Ratio | pvalue | p.adjust | qvalue | Count |
| Page: 1 |
Top |
Cell-cell communication analysis |
| Identification of potential cell-cell interactions between two cell types and their ligand-receptor pairs for different disease states |
| Ligand | Receptor | LRpair | Pathway | Tissue | Disease Stage |
| Page: 1 |
Top |
Single-cell gene regulatory network inference analysis |
| Find out the significant the regulons (TFs) and the target genes of each regulon across cell types for different disease states |
| TF | Cell Type | Tissue | Disease Stage | Target Gene | RSS | Regulon Activity |
| ∗The dot plots of a searched regulon are shown for all cell subpopulations in each disease state of each tissue based on the regulon specific score inferred using pySCENIC and by calculating the average expression. |
| Page: 1 |
Top |
Somatic mutation of malignant transformation related genes |
| Annotation of somatic variants for genes involved in malignant transformation |
| Hugo Symbol | Variant Class | Variant Classification | dbSNP RS | HGVSc | HGVSp | HGVSp Short | SWISSPROT | BIOTYPE | SIFT | PolyPhen | Tumor Sample Barcode | Tissue | Histology | Sex | Age | Stage | Therapy Types | Drugs | Outcome |
| SBDS | SNV | Missense_Mutation | rs747312896 | c.713A>G | p.Asn238Ser | p.N238S | Q9Y3A5 | protein_coding | tolerated(1) | benign(0) | TCGA-DS-A0VK-01 | Cervix | cervical & endocervical cancer | Female | <65 | I/II | Chemotherapy | carboplatin | PD |
| SBDS | SNV | Missense_Mutation | novel | c.491N>C | p.Lys164Thr | p.K164T | Q9Y3A5 | protein_coding | tolerated(0.72) | benign(0.001) | TCGA-MA-AA3W-01 | Cervix | cervical & endocervical cancer | Female | <65 | I/II | Chemotherapy | cisplatin | CR |
| SBDS | SNV | Missense_Mutation | c.98N>T | p.Lys33Ile | p.K33I | Q9Y3A5 | protein_coding | deleterious(0) | probably_damaging(0.932) | TCGA-Q1-A73P-01 | Cervix | cervical & endocervical cancer | Female | <65 | I/II | Unknown | Unknown | SD | |
| SBDS | SNV | Missense_Mutation | c.506N>A | p.Arg169His | p.R169H | Q9Y3A5 | protein_coding | deleterious(0) | probably_damaging(0.972) | TCGA-AA-A02R-01 | Colorectum | colon adenocarcinoma | Female | >=65 | I/II | Unknown | Unknown | PD | |
| SBDS | SNV | Missense_Mutation | novel | c.149N>C | p.Val50Ala | p.V50A | Q9Y3A5 | protein_coding | deleterious(0) | probably_damaging(0.975) | TCGA-AM-5820-01 | Colorectum | colon adenocarcinoma | Female | <65 | I/II | Unknown | Unknown | SD |
| SBDS | insertion | In_Frame_Ins | novel | c.150_151insATG | p.Val50_Leu51insMet | p.V50_L51insM | Q9Y3A5 | protein_coding | TCGA-AM-5820-01 | Colorectum | colon adenocarcinoma | Female | <65 | I/II | Unknown | Unknown | SD | ||
| SBDS | SNV | Missense_Mutation | c.428C>T | p.Ser143Leu | p.S143L | Q9Y3A5 | protein_coding | deleterious(0) | benign(0.348) | TCGA-AP-A056-01 | Endometrium | uterine corpus endometrioid carcinoma | Female | <65 | I/II | Unknown | Unknown | SD | |
| SBDS | SNV | Missense_Mutation | c.583A>G | p.Lys195Glu | p.K195E | Q9Y3A5 | protein_coding | tolerated(0.74) | benign(0.115) | TCGA-D1-A17D-01 | Endometrium | uterine corpus endometrioid carcinoma | Female | <65 | I/II | Chemotherapy | carboplatin | SD | |
| SBDS | SNV | Missense_Mutation | novel | c.261T>G | p.Ile87Met | p.I87M | Q9Y3A5 | protein_coding | deleterious(0) | probably_damaging(0.984) | TCGA-DF-A2KV-01 | Endometrium | uterine corpus endometrioid carcinoma | Female | <65 | I/II | Unknown | Unknown | SD |
| SBDS | SNV | Missense_Mutation | novel | c.397N>G | p.Ile133Val | p.I133V | Q9Y3A5 | protein_coding | deleterious(0.04) | benign(0.325) | TCGA-DI-A1BU-01 | Endometrium | uterine corpus endometrioid carcinoma | Female | <65 | I/II | Chemotherapy | paclitaxel | SD |
| Page: 1 2 3 |
Top |
Related drugs of malignant transformation related genes |
| Identification of chemicals and drugs interact with genes involved in malignant transfromation |
| (DGIdb 4.0) |
| Entrez ID | Symbol | Category | Interaction Types | Drug Claim Name | Drug Name | PMIDs |
| Page: 1 |

Copyright 2023-Present -The University of Texas Health Science Center at Houston |