
|
|||||
|
 | |
| |
| |
| |
| |
| |
|
Gene: SAYSD1 |
Gene summary for SAYSD1 |
| Gene information | Species | Human | Gene symbol | SAYSD1 | Gene ID | 55776 |
| Gene name | SAYSVFN motif domain containing 1 | |
| Gene Alias | C6orf64 | |
| Cytomap | 6p21.2 | |
| Gene Type | protein-coding | GO ID | GO:0005575 | UniProtAcc | Q9NPB0 |
Top |
Malignant transformation analysis |
| Identification of the aberrant gene expression in precancerous and cancerous lesions by comparing the gene expression of stem-like cells in diseased tissues with normal stem cells |
| Entrez ID | Symbol | Replicates | Species | Organ | Tissue | Adj P-value | Log2FC | Malignancy |
| 55776 | SAYSD1 | LZE2T | Human | Esophagus | ESCC | 1.77e-08 | 9.59e-01 | 0.082 |
| 55776 | SAYSD1 | LZE4T | Human | Esophagus | ESCC | 2.03e-04 | 1.71e-01 | 0.0811 |
| 55776 | SAYSD1 | LZE22T | Human | Esophagus | ESCC | 5.92e-07 | 3.74e-01 | 0.068 |
| 55776 | SAYSD1 | LZE24T | Human | Esophagus | ESCC | 2.77e-13 | 3.07e-01 | 0.0596 |
| 55776 | SAYSD1 | LZE6T | Human | Esophagus | ESCC | 2.73e-03 | 2.09e-01 | 0.0845 |
| 55776 | SAYSD1 | P1T-E | Human | Esophagus | ESCC | 2.11e-03 | 2.54e-01 | 0.0875 |
| 55776 | SAYSD1 | P2T-E | Human | Esophagus | ESCC | 3.17e-21 | 2.51e-01 | 0.1177 |
| 55776 | SAYSD1 | P4T-E | Human | Esophagus | ESCC | 1.70e-20 | 4.40e-01 | 0.1323 |
| 55776 | SAYSD1 | P5T-E | Human | Esophagus | ESCC | 9.56e-08 | 1.62e-01 | 0.1327 |
| 55776 | SAYSD1 | P8T-E | Human | Esophagus | ESCC | 5.96e-15 | 2.95e-01 | 0.0889 |
| 55776 | SAYSD1 | P9T-E | Human | Esophagus | ESCC | 1.03e-10 | 2.43e-01 | 0.1131 |
| 55776 | SAYSD1 | P10T-E | Human | Esophagus | ESCC | 2.83e-19 | 3.05e-01 | 0.116 |
| 55776 | SAYSD1 | P11T-E | Human | Esophagus | ESCC | 3.25e-06 | 3.08e-01 | 0.1426 |
| 55776 | SAYSD1 | P12T-E | Human | Esophagus | ESCC | 1.80e-15 | 2.75e-01 | 0.1122 |
| 55776 | SAYSD1 | P15T-E | Human | Esophagus | ESCC | 1.60e-11 | 2.00e-01 | 0.1149 |
| 55776 | SAYSD1 | P16T-E | Human | Esophagus | ESCC | 1.54e-14 | 2.62e-01 | 0.1153 |
| 55776 | SAYSD1 | P17T-E | Human | Esophagus | ESCC | 1.04e-05 | 2.28e-01 | 0.1278 |
| 55776 | SAYSD1 | P19T-E | Human | Esophagus | ESCC | 4.82e-04 | 3.64e-01 | 0.1662 |
| 55776 | SAYSD1 | P20T-E | Human | Esophagus | ESCC | 1.21e-08 | 1.97e-01 | 0.1124 |
| 55776 | SAYSD1 | P21T-E | Human | Esophagus | ESCC | 5.96e-17 | 2.84e-01 | 0.1617 |
| Page: 1 2 3 4 |
| Tissue | Expression Dynamics | Abbreviation |
| Esophagus | 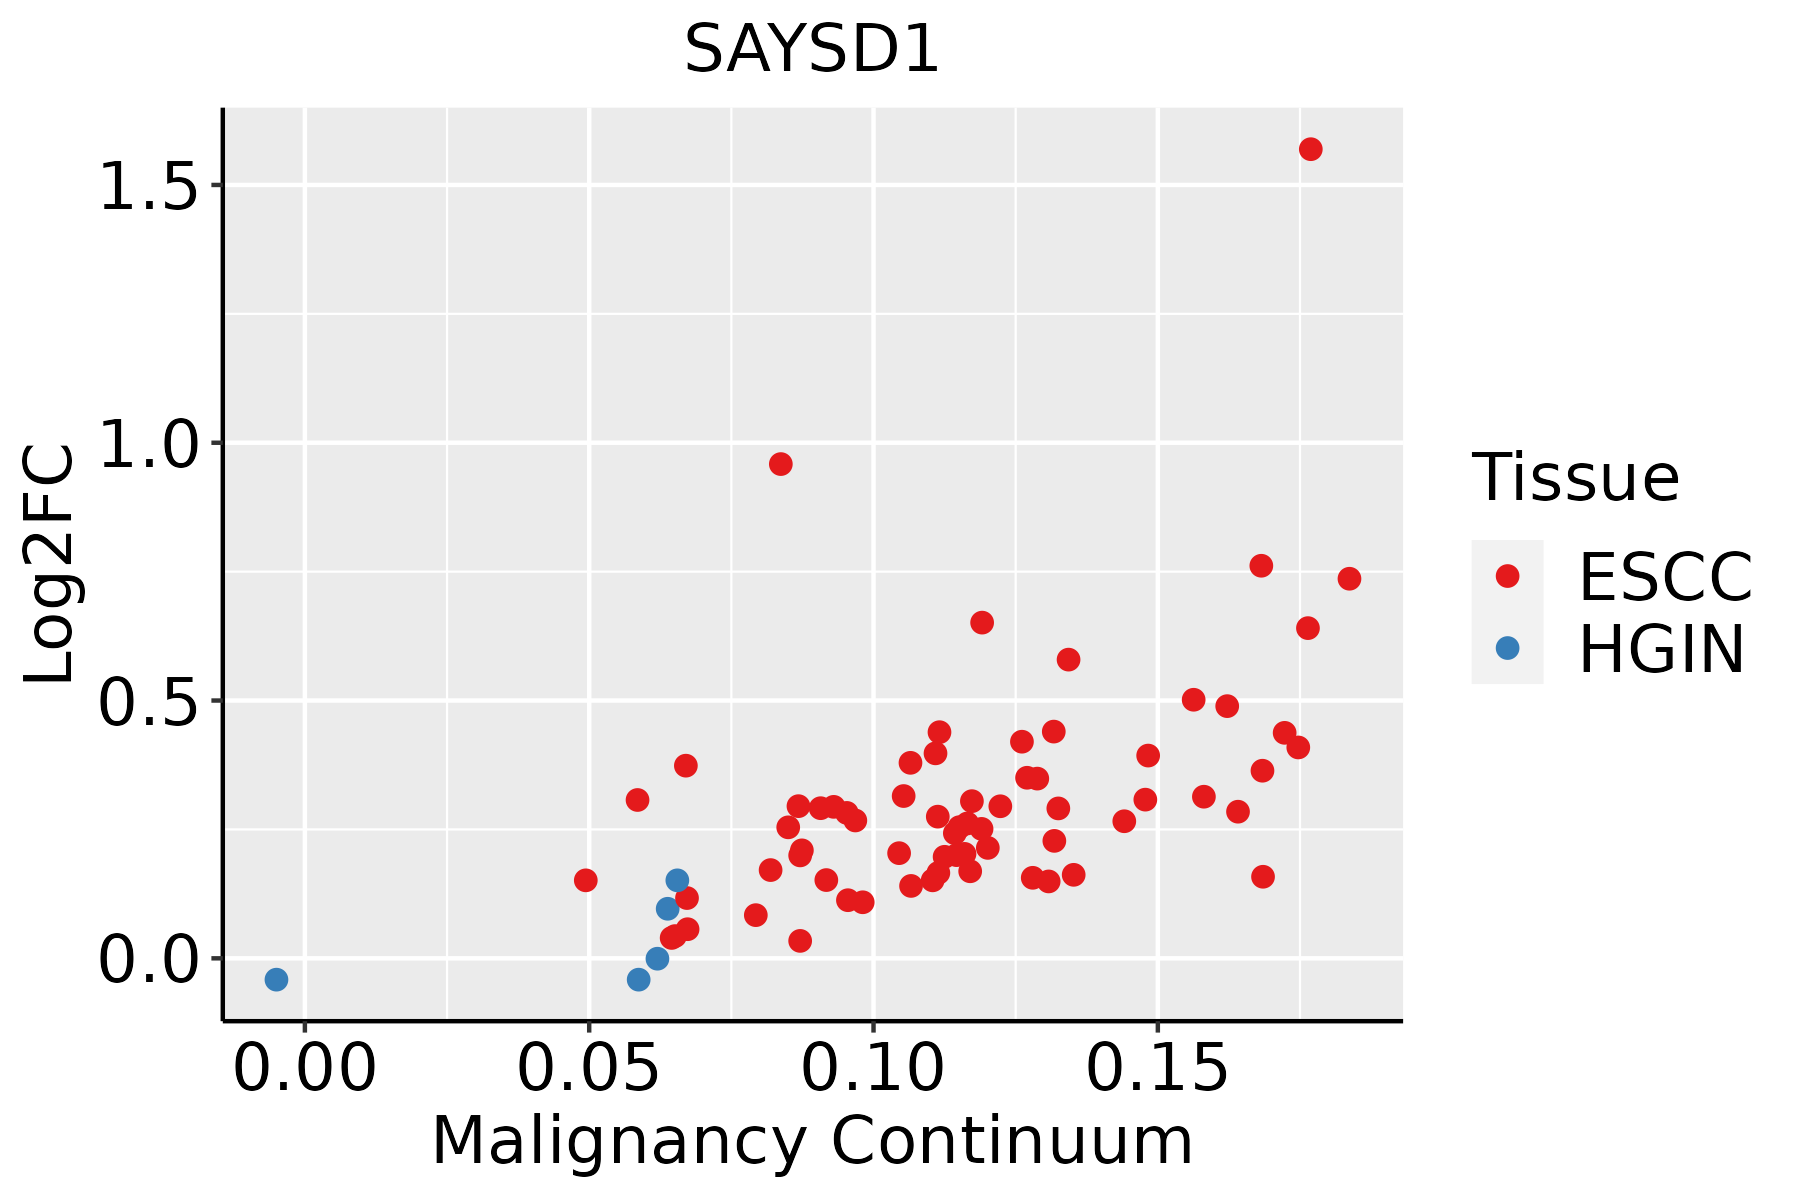 | ESCC: Esophageal squamous cell carcinoma |
| HGIN: High-grade intraepithelial neoplasias | ||
| LGIN: Low-grade intraepithelial neoplasias | ||
| Oral Cavity | 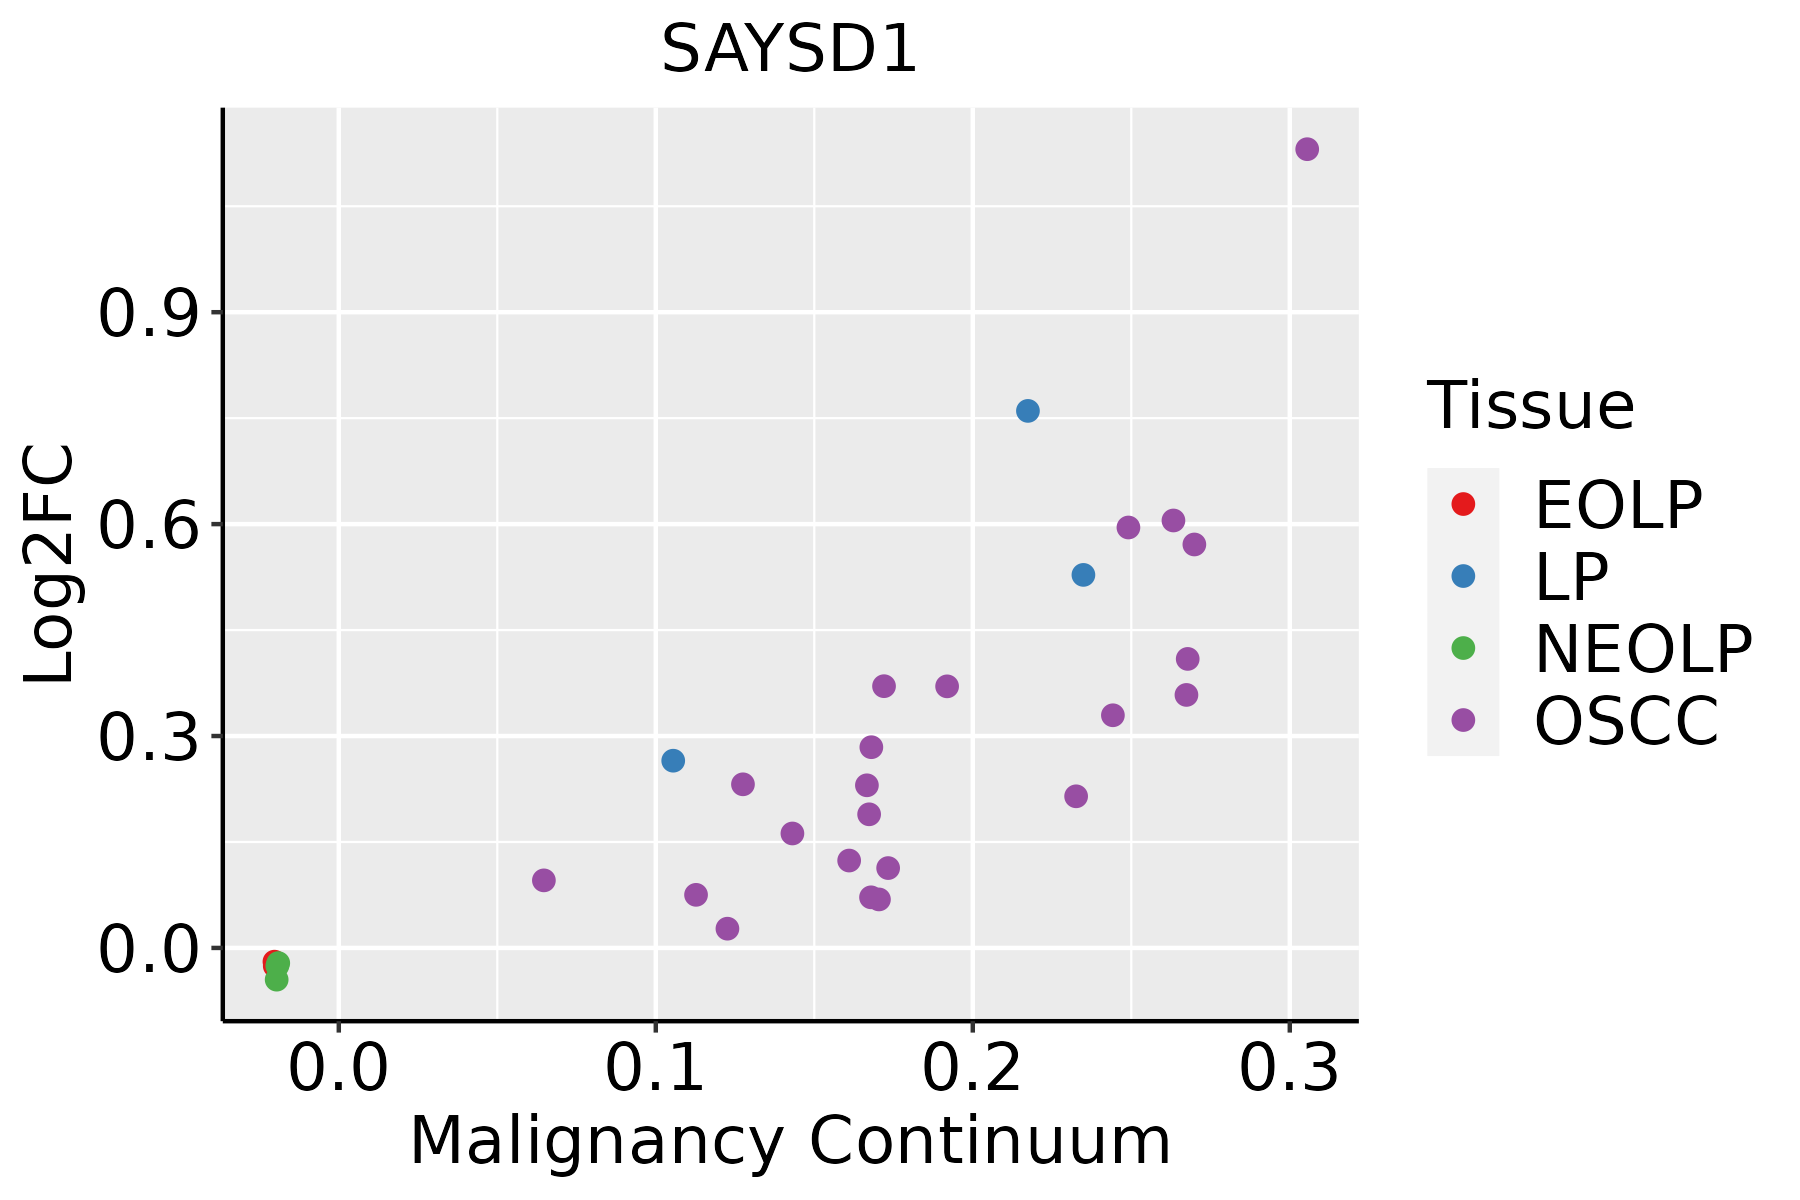 | EOLP: Erosive Oral lichen planus |
| LP: leukoplakia | ||
| NEOLP: Non-erosive oral lichen planus | ||
| OSCC: Oral squamous cell carcinoma |
| ∗log2FC in expression of this searched gene in stem-like cells from each diseased tissue sample relative to stem-like cells in normal samples in each tissue plotted against the malignancy continuum. Samples are colored based on if they are from different disease stage. |
Top |
Malignant transformation related pathway analysis |
| Find out the enriched GO biological processes and KEGG pathways involved in transition from healthy to precancer to cancer |
| Tissue | Disease Stage | Enriched GO biological Processes |
| Colorectum | AD |  |
| Colorectum | SER |  |
| Colorectum | MSS |  |
| Colorectum | MSI-H |  |
| Colorectum | FAP |  |
| ∗Top 15 enriched GO BP terms are showed in the bar plot of each disease state in each tissue. Each row represents a significant GO biological process which is colored according to the -log10(p.adjust). |
| Page: 1 2 3 4 5 6 7 8 9 |
| GO ID | Tissue | Disease Stage | Description | Gene Ratio | Bg Ratio | pvalue | p.adjust | Count |
| Page: 1 |
| Pathway ID | Tissue | Disease Stage | Description | Gene Ratio | Bg Ratio | pvalue | p.adjust | qvalue | Count |
| Page: 1 |
Top |
Cell-cell communication analysis |
| Identification of potential cell-cell interactions between two cell types and their ligand-receptor pairs for different disease states |
| Ligand | Receptor | LRpair | Pathway | Tissue | Disease Stage |
| Page: 1 |
Top |
Single-cell gene regulatory network inference analysis |
| Find out the significant the regulons (TFs) and the target genes of each regulon across cell types for different disease states |
| TF | Cell Type | Tissue | Disease Stage | Target Gene | RSS | Regulon Activity |
| ∗The dot plots of a searched regulon are shown for all cell subpopulations in each disease state of each tissue based on the regulon specific score inferred using pySCENIC and by calculating the average expression. |
| Page: 1 |
Top |
Somatic mutation of malignant transformation related genes |
| Annotation of somatic variants for genes involved in malignant transformation |
| Hugo Symbol | Variant Class | Variant Classification | dbSNP RS | HGVSc | HGVSp | HGVSp Short | SWISSPROT | BIOTYPE | SIFT | PolyPhen | Tumor Sample Barcode | Tissue | Histology | Sex | Age | Stage | Therapy Types | Drugs | Outcome |
| SAYSD1 | insertion | Nonsense_Mutation | novel | c.144_145insTTCACTCCGAATTGAGTTATCGTGACGCCCTGTGGCATTGGG | p.Leu48_Lys49insPheThrProAsnTerValIleValThrProCysGlyIleGly | p.L48_K49insFTPN*VIVTPCGIG | Q9NPB0 | protein_coding | TCGA-A8-A09X-01 | Breast | breast invasive carcinoma | Female | <65 | III/IV | Unknown | Unknown | SD | ||
| SAYSD1 | insertion | Nonsense_Mutation | novel | c.54_55insATCACAAGTAGCAGTAATTAAAACTTC | p.Ala18_Ala19insIleThrSerSerSerAsnTerAsnPhe | p.A18_A19insITSSSN*NF | Q9NPB0 | protein_coding | TCGA-AN-A0FS-01 | Breast | breast invasive carcinoma | Female | <65 | I/II | Unknown | Unknown | SD | ||
| SAYSD1 | insertion | Nonsense_Mutation | novel | c.144_145insTTATTCACTCCGAATTGAGTTATCGTGACGCCCTGTGGCATTGGG | p.Leu48_Lys49insLeuPheThrProAsnTerValIleValThrProCysGlyIleGly | p.L48_K49insLFTPN*VIVTPCGIG | Q9NPB0 | protein_coding | TCGA-AO-A0JB-01 | Breast | breast invasive carcinoma | Female | <65 | III/IV | Chemotherapy | cyclophosphamide | SD | ||
| SAYSD1 | SNV | Missense_Mutation | novel | c.352N>A | p.Glu118Lys | p.E118K | Q9NPB0 | protein_coding | deleterious(0) | possibly_damaging(0.836) | TCGA-VS-AA62-01 | Cervix | cervical & endocervical cancer | Female | <65 | I/II | Chemotherapy | cisplatin | PD |
| SAYSD1 | SNV | Missense_Mutation | novel | c.80N>A | p.Gly27Asp | p.G27D | Q9NPB0 | protein_coding | tolerated(0.4) | benign(0.011) | TCGA-AA-3845-01 | Colorectum | colon adenocarcinoma | Female | >=65 | I/II | Unknown | Unknown | PD |
| SAYSD1 | SNV | Missense_Mutation | c.422N>T | p.Pro141Leu | p.P141L | Q9NPB0 | protein_coding | deleterious(0) | probably_damaging(0.985) | TCGA-AA-3956-01 | Colorectum | colon adenocarcinoma | Male | >=65 | I/II | Unknown | Unknown | SD | |
| SAYSD1 | SNV | Missense_Mutation | rs756967804 | c.451G>A | p.Ala151Thr | p.A151T | Q9NPB0 | protein_coding | deleterious(0) | probably_damaging(0.999) | TCGA-AP-A059-01 | Endometrium | uterine corpus endometrioid carcinoma | Female | >=65 | I/II | Unknown | Unknown | SD |
| SAYSD1 | SNV | Missense_Mutation | c.128C>T | p.Ala43Val | p.A43V | Q9NPB0 | protein_coding | tolerated(0.34) | benign(0.003) | TCGA-AP-A059-01 | Endometrium | uterine corpus endometrioid carcinoma | Female | >=65 | I/II | Unknown | Unknown | SD | |
| SAYSD1 | SNV | Missense_Mutation | novel | c.268N>T | p.Pro90Ser | p.P90S | Q9NPB0 | protein_coding | tolerated(0.51) | benign(0.033) | TCGA-DI-A1BU-01 | Endometrium | uterine corpus endometrioid carcinoma | Female | <65 | I/II | Chemotherapy | paclitaxel | SD |
| SAYSD1 | SNV | Missense_Mutation | novel | c.319N>A | p.Leu107Ile | p.L107I | Q9NPB0 | protein_coding | deleterious(0.02) | possibly_damaging(0.538) | TCGA-E6-A1LX-01 | Endometrium | uterine corpus endometrioid carcinoma | Female | <65 | I/II | Unknown | Unknown | SD |
| Page: 1 2 |
Top |
Related drugs of malignant transformation related genes |
| Identification of chemicals and drugs interact with genes involved in malignant transfromation |
| (DGIdb 4.0) |
| Entrez ID | Symbol | Category | Interaction Types | Drug Claim Name | Drug Name | PMIDs |
| Page: 1 |

Copyright 2023-Present -The University of Texas Health Science Center at Houston |