
|
|||||
|
 | |
| |
| |
| |
| |
| |
|
Gene: SAV1 |
Gene summary for SAV1 |
| Gene information | Species | Human | Gene symbol | SAV1 | Gene ID | 60485 |
| Gene name | salvador family WW domain containing protein 1 | |
| Gene Alias | SAV | |
| Cytomap | 14q22.1 | |
| Gene Type | protein-coding | GO ID | GO:0001942 | UniProtAcc | Q9H4B6 |
Top |
Malignant transformation analysis |
| Identification of the aberrant gene expression in precancerous and cancerous lesions by comparing the gene expression of stem-like cells in diseased tissues with normal stem cells |
| Entrez ID | Symbol | Replicates | Species | Organ | Tissue | Adj P-value | Log2FC | Malignancy |
| 60485 | SAV1 | LZE4T | Human | Esophagus | ESCC | 1.21e-05 | 6.84e-02 | 0.0811 |
| 60485 | SAV1 | LZE5T | Human | Esophagus | ESCC | 1.86e-02 | 1.27e-03 | 0.0514 |
| 60485 | SAV1 | LZE20T | Human | Esophagus | ESCC | 7.47e-03 | 1.89e-02 | 0.0662 |
| 60485 | SAV1 | LZE21T | Human | Esophagus | ESCC | 1.27e-02 | 2.08e-01 | 0.0655 |
| 60485 | SAV1 | P1T-E | Human | Esophagus | ESCC | 1.67e-04 | -1.76e-02 | 0.0875 |
| 60485 | SAV1 | P2T-E | Human | Esophagus | ESCC | 6.28e-31 | 6.65e-01 | 0.1177 |
| 60485 | SAV1 | P4T-E | Human | Esophagus | ESCC | 4.29e-12 | 1.94e-01 | 0.1323 |
| 60485 | SAV1 | P5T-E | Human | Esophagus | ESCC | 6.52e-04 | 3.83e-03 | 0.1327 |
| 60485 | SAV1 | P8T-E | Human | Esophagus | ESCC | 1.65e-25 | 5.31e-01 | 0.0889 |
| 60485 | SAV1 | P9T-E | Human | Esophagus | ESCC | 1.82e-05 | 1.52e-01 | 0.1131 |
| 60485 | SAV1 | P10T-E | Human | Esophagus | ESCC | 3.84e-27 | 5.59e-01 | 0.116 |
| 60485 | SAV1 | P11T-E | Human | Esophagus | ESCC | 6.37e-09 | 2.57e-01 | 0.1426 |
| 60485 | SAV1 | P12T-E | Human | Esophagus | ESCC | 3.29e-16 | 3.02e-01 | 0.1122 |
| 60485 | SAV1 | P15T-E | Human | Esophagus | ESCC | 6.30e-19 | 6.59e-01 | 0.1149 |
| 60485 | SAV1 | P16T-E | Human | Esophagus | ESCC | 3.15e-32 | 6.82e-01 | 0.1153 |
| 60485 | SAV1 | P17T-E | Human | Esophagus | ESCC | 2.27e-03 | 4.81e-02 | 0.1278 |
| 60485 | SAV1 | P20T-E | Human | Esophagus | ESCC | 4.91e-11 | 5.24e-02 | 0.1124 |
| 60485 | SAV1 | P21T-E | Human | Esophagus | ESCC | 5.18e-16 | 1.46e-01 | 0.1617 |
| 60485 | SAV1 | P22T-E | Human | Esophagus | ESCC | 5.12e-16 | 4.56e-03 | 0.1236 |
| 60485 | SAV1 | P23T-E | Human | Esophagus | ESCC | 1.82e-17 | 2.41e-01 | 0.108 |
| Page: 1 2 3 4 5 6 |
| Tissue | Expression Dynamics | Abbreviation |
| Esophagus | 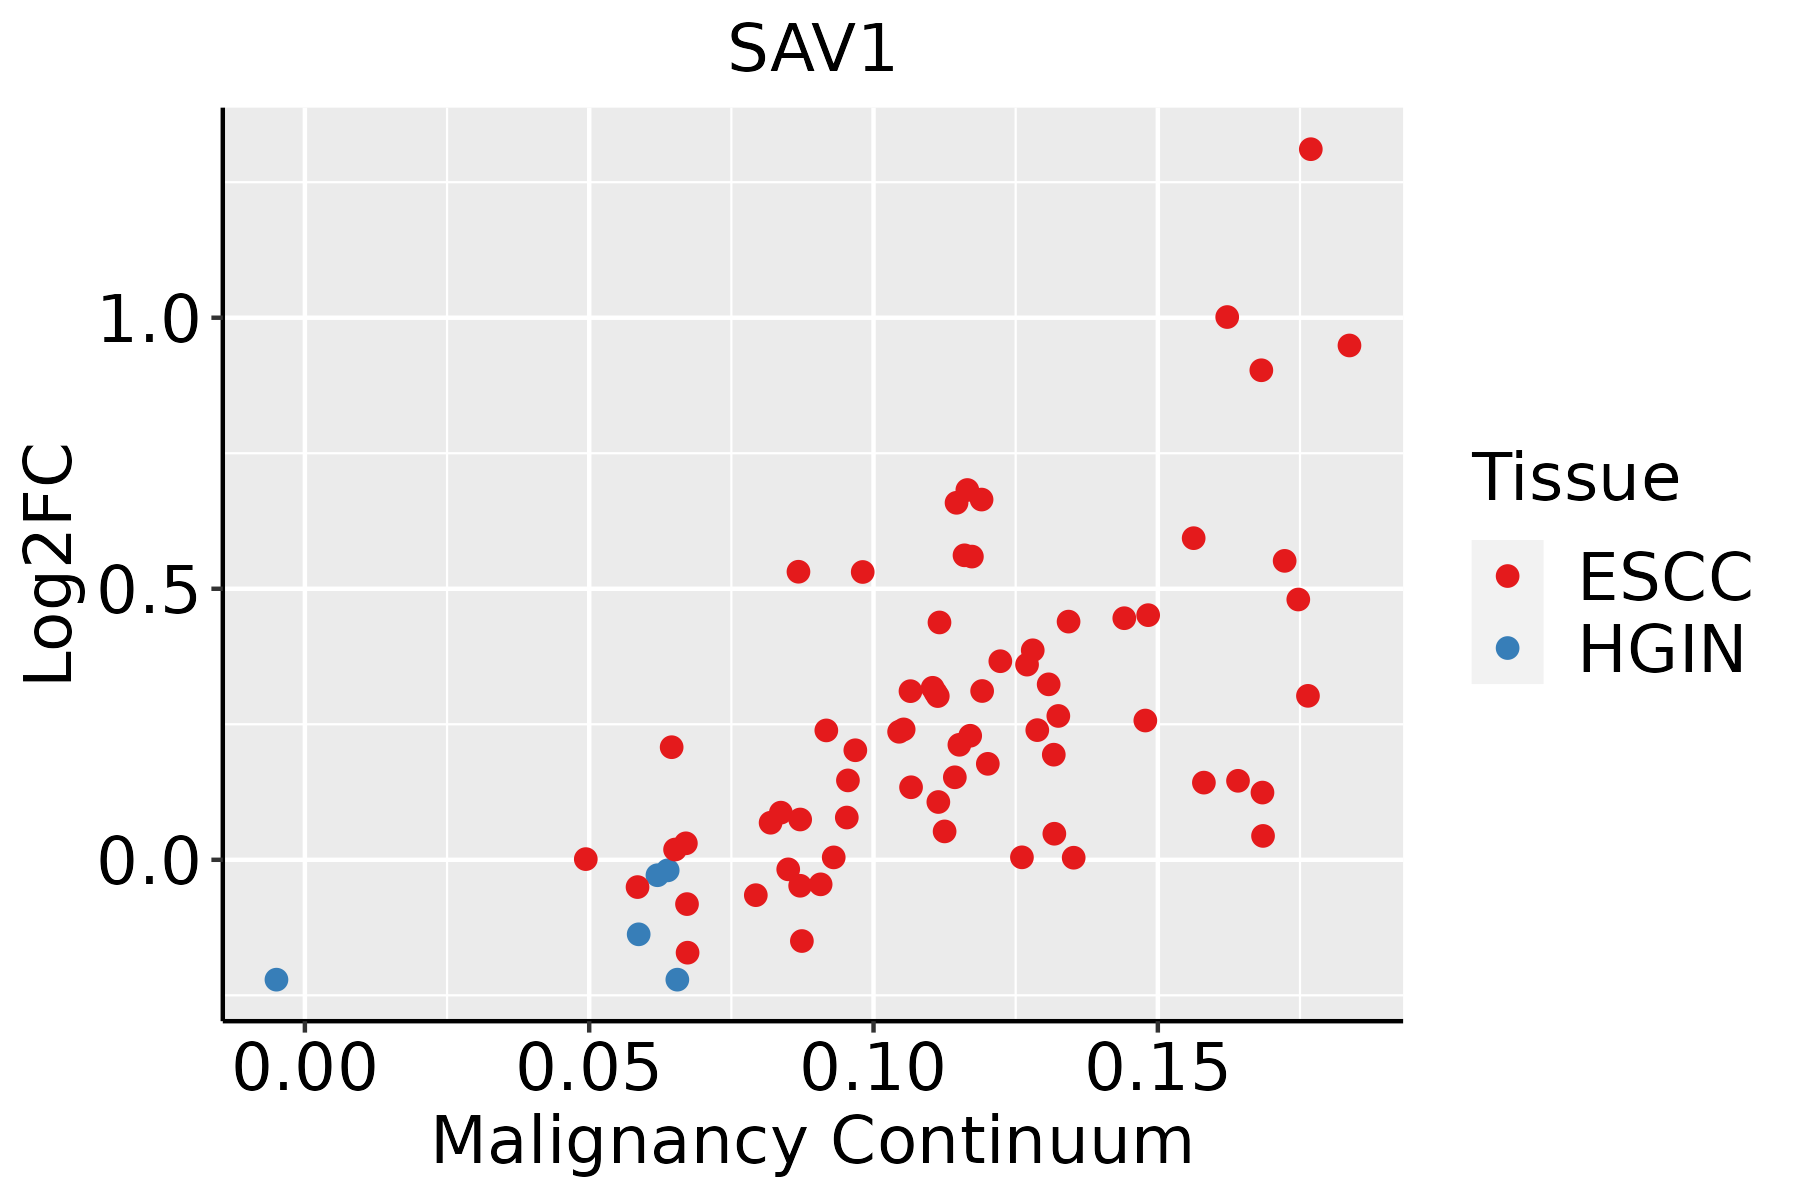 | ESCC: Esophageal squamous cell carcinoma |
| HGIN: High-grade intraepithelial neoplasias | ||
| LGIN: Low-grade intraepithelial neoplasias | ||
| Oral Cavity |  | EOLP: Erosive Oral lichen planus |
| LP: leukoplakia | ||
| NEOLP: Non-erosive oral lichen planus | ||
| OSCC: Oral squamous cell carcinoma | ||
| Prostate | 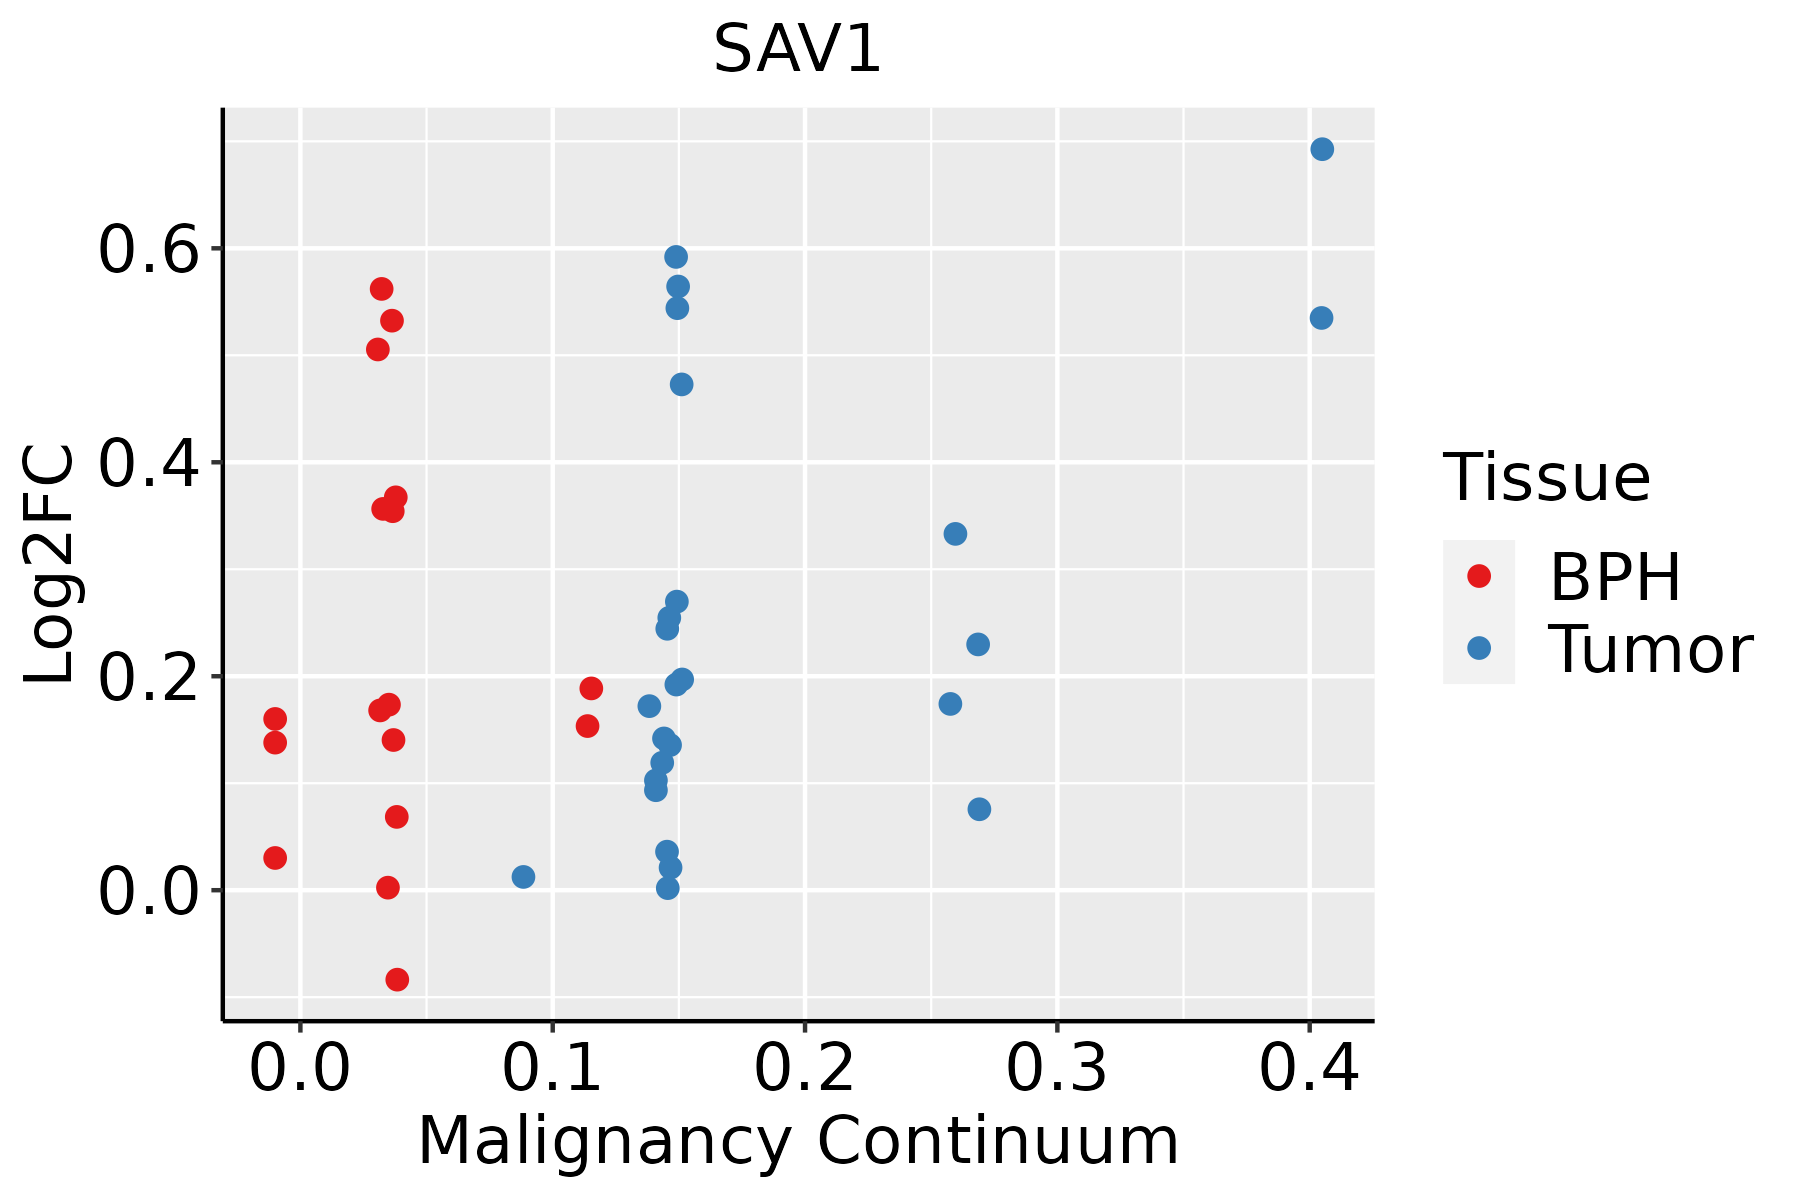 | BPH: Benign Prostatic Hyperplasia |
| Thyroid |  | ATC: Anaplastic thyroid cancer |
| HT: Hashimoto's thyroiditis | ||
| PTC: Papillary thyroid cancer |
| ∗log2FC in expression of this searched gene in stem-like cells from each diseased tissue sample relative to stem-like cells in normal samples in each tissue plotted against the malignancy continuum. Samples are colored based on if they are from different disease stage. |
Top |
Malignant transformation related pathway analysis |
| Find out the enriched GO biological processes and KEGG pathways involved in transition from healthy to precancer to cancer |
| Tissue | Disease Stage | Enriched GO biological Processes |
| Colorectum | AD |  |
| Colorectum | SER |  |
| Colorectum | MSS |  |
| Colorectum | MSI-H |  |
| Colorectum | FAP |  |
| ∗Top 15 enriched GO BP terms are showed in the bar plot of each disease state in each tissue. Each row represents a significant GO biological process which is colored according to the -log10(p.adjust). |
| Page: 1 2 3 4 5 6 7 8 9 |
| GO ID | Tissue | Disease Stage | Description | Gene Ratio | Bg Ratio | pvalue | p.adjust | Count |
| GO:0031647111 | Esophagus | ESCC | regulation of protein stability | 223/8552 | 298/18723 | 5.76e-25 | 1.52e-22 | 223 |
| GO:0050821111 | Esophagus | ESCC | protein stabilization | 140/8552 | 191/18723 | 6.50e-15 | 3.61e-13 | 140 |
| GO:00435888 | Esophagus | ESCC | skin development | 163/8552 | 263/18723 | 6.48e-08 | 1.14e-06 | 163 |
| GO:000854410 | Esophagus | ESCC | epidermis development | 193/8552 | 324/18723 | 2.87e-07 | 4.19e-06 | 193 |
| GO:009872714 | Esophagus | ESCC | maintenance of cell number | 90/8552 | 134/18723 | 3.94e-07 | 5.43e-06 | 90 |
| GO:00510908 | Esophagus | ESCC | regulation of DNA-binding transcription factor activity | 252/8552 | 440/18723 | 5.22e-07 | 6.97e-06 | 252 |
| GO:001982714 | Esophagus | ESCC | stem cell population maintenance | 88/8552 | 131/18723 | 5.23e-07 | 6.97e-06 | 88 |
| GO:00510918 | Esophagus | ESCC | positive regulation of DNA-binding transcription factor activity | 155/8552 | 260/18723 | 3.83e-06 | 4.14e-05 | 155 |
| GO:00303239 | Esophagus | ESCC | respiratory tube development | 112/8552 | 181/18723 | 7.82e-06 | 7.69e-05 | 112 |
| GO:00459267 | Esophagus | ESCC | negative regulation of growth | 148/8552 | 249/18723 | 7.88e-06 | 7.73e-05 | 148 |
| GO:00605417 | Esophagus | ESCC | respiratory system development | 123/8552 | 203/18723 | 1.26e-05 | 1.15e-04 | 123 |
| GO:00303249 | Esophagus | ESCC | lung development | 109/8552 | 177/18723 | 1.40e-05 | 1.27e-04 | 109 |
| GO:000991310 | Esophagus | ESCC | epidermal cell differentiation | 122/8552 | 202/18723 | 1.69e-05 | 1.51e-04 | 122 |
| GO:00454449 | Esophagus | ESCC | fat cell differentiation | 135/8552 | 229/18723 | 3.38e-05 | 2.78e-04 | 135 |
| GO:00456007 | Esophagus | ESCC | positive regulation of fat cell differentiation | 46/8552 | 66/18723 | 6.72e-05 | 5.11e-04 | 46 |
| GO:00302167 | Esophagus | ESCC | keratinocyte differentiation | 86/8552 | 139/18723 | 8.53e-05 | 6.19e-04 | 86 |
| GO:005067318 | Esophagus | ESCC | epithelial cell proliferation | 238/8552 | 437/18723 | 1.19e-04 | 8.20e-04 | 238 |
| GO:005067817 | Esophagus | ESCC | regulation of epithelial cell proliferation | 206/8552 | 381/18723 | 5.51e-04 | 3.02e-03 | 206 |
| GO:00604284 | Esophagus | ESCC | lung epithelium development | 27/8552 | 37/18723 | 7.00e-04 | 3.66e-03 | 27 |
| GO:00224043 | Esophagus | ESCC | molting cycle process | 53/8552 | 84/18723 | 9.62e-04 | 4.88e-03 | 53 |
| Page: 1 2 3 4 5 6 7 8 9 10 11 12 13 |
| Pathway ID | Tissue | Disease Stage | Description | Gene Ratio | Bg Ratio | pvalue | p.adjust | qvalue | Count |
| hsa0439018 | Esophagus | ESCC | Hippo signaling pathway | 92/4205 | 157/8465 | 1.46e-02 | 3.31e-02 | 1.69e-02 | 92 |
| hsa0439019 | Esophagus | ESCC | Hippo signaling pathway | 92/4205 | 157/8465 | 1.46e-02 | 3.31e-02 | 1.69e-02 | 92 |
| hsa0439016 | Oral cavity | OSCC | Hippo signaling pathway | 86/3704 | 157/8465 | 3.30e-03 | 8.24e-03 | 4.20e-03 | 86 |
| hsa0439017 | Oral cavity | OSCC | Hippo signaling pathway | 86/3704 | 157/8465 | 3.30e-03 | 8.24e-03 | 4.20e-03 | 86 |
| hsa0439025 | Oral cavity | NEOLP | Hippo signaling pathway | 35/1112 | 157/8465 | 9.91e-04 | 4.85e-03 | 3.05e-03 | 35 |
| hsa0439035 | Oral cavity | NEOLP | Hippo signaling pathway | 35/1112 | 157/8465 | 9.91e-04 | 4.85e-03 | 3.05e-03 | 35 |
| hsa0439010 | Prostate | BPH | Hippo signaling pathway | 52/1718 | 157/8465 | 9.93e-05 | 6.00e-04 | 3.71e-04 | 52 |
| hsa0439015 | Prostate | BPH | Hippo signaling pathway | 52/1718 | 157/8465 | 9.93e-05 | 6.00e-04 | 3.71e-04 | 52 |
| hsa0439024 | Prostate | Tumor | Hippo signaling pathway | 54/1791 | 157/8465 | 7.52e-05 | 5.30e-04 | 3.28e-04 | 54 |
| hsa0439034 | Prostate | Tumor | Hippo signaling pathway | 54/1791 | 157/8465 | 7.52e-05 | 5.30e-04 | 3.28e-04 | 54 |
| Page: 1 |
Top |
Cell-cell communication analysis |
| Identification of potential cell-cell interactions between two cell types and their ligand-receptor pairs for different disease states |
| Ligand | Receptor | LRpair | Pathway | Tissue | Disease Stage |
| Page: 1 |
Top |
Single-cell gene regulatory network inference analysis |
| Find out the significant the regulons (TFs) and the target genes of each regulon across cell types for different disease states |
| TF | Cell Type | Tissue | Disease Stage | Target Gene | RSS | Regulon Activity |
| ∗The dot plots of a searched regulon are shown for all cell subpopulations in each disease state of each tissue based on the regulon specific score inferred using pySCENIC and by calculating the average expression. |
| Page: 1 |
Top |
Somatic mutation of malignant transformation related genes |
| Annotation of somatic variants for genes involved in malignant transformation |
| Hugo Symbol | Variant Class | Variant Classification | dbSNP RS | HGVSc | HGVSp | HGVSp Short | SWISSPROT | BIOTYPE | SIFT | PolyPhen | Tumor Sample Barcode | Tissue | Histology | Sex | Age | Stage | Therapy Types | Drugs | Outcome |
| SAV1 | SNV | Missense_Mutation | novel | c.760N>C | p.Asp254His | p.D254H | Q9H4B6 | protein_coding | deleterious(0.01) | benign(0.08) | TCGA-B6-A402-01 | Breast | breast invasive carcinoma | Female | <65 | I/II | Chemotherapy | cyclophosphamide | PD |
| SAV1 | SNV | Missense_Mutation | novel | c.346T>C | p.Phe116Leu | p.F116L | Q9H4B6 | protein_coding | tolerated(0.48) | benign(0.003) | TCGA-PL-A8LV-01 | Breast | breast invasive carcinoma | Female | <65 | III/IV | Unknown | Unknown | SD |
| SAV1 | insertion | Frame_Shift_Ins | novel | c.553_554insAT | p.Ala185AspfsTer5 | p.A185Dfs*5 | Q9H4B6 | protein_coding | TCGA-AC-A3QQ-01 | Breast | breast invasive carcinoma | Female | <65 | I/II | Unknown | Unknown | SD | ||
| SAV1 | insertion | In_Frame_Ins | novel | c.552_553insTATTTGTGT | p.Ala184_Ala185insTyrLeuCys | p.A184_A185insYLC | Q9H4B6 | protein_coding | TCGA-AC-A3QQ-01 | Breast | breast invasive carcinoma | Female | <65 | I/II | Unknown | Unknown | SD | ||
| SAV1 | deletion | Frame_Shift_Del | novel | c.833delN | p.Pro278LeufsTer39 | p.P278Lfs*39 | Q9H4B6 | protein_coding | TCGA-D8-A27V-01 | Breast | breast invasive carcinoma | Female | <65 | I/II | Hormone Therapy | tamoxiphen | SD | ||
| SAV1 | SNV | Missense_Mutation | novel | c.1142N>C | p.Lys381Thr | p.K381T | Q9H4B6 | protein_coding | deleterious_low_confidence(0.01) | benign(0.179) | TCGA-AZ-4315-01 | Colorectum | colon adenocarcinoma | Male | <65 | I/II | Unknown | Unknown | SD |
| SAV1 | SNV | Missense_Mutation | c.914C>T | p.Pro305Leu | p.P305L | Q9H4B6 | protein_coding | deleterious(0) | probably_damaging(1) | TCGA-AG-A00Y-01 | Colorectum | rectum adenocarcinoma | Male | >=65 | I/II | Unknown | Unknown | PD | |
| SAV1 | insertion | Frame_Shift_Ins | novel | c.553_554insTGAT | p.Ala185ValfsTer10 | p.A185Vfs*10 | Q9H4B6 | protein_coding | TCGA-AM-5820-01 | Colorectum | colon adenocarcinoma | Female | <65 | I/II | Unknown | Unknown | SD | ||
| SAV1 | SNV | Missense_Mutation | novel | c.1084C>T | p.Leu362Phe | p.L362F | Q9H4B6 | protein_coding | tolerated(0.08) | benign(0.073) | TCGA-A5-A2K5-01 | Endometrium | uterine corpus endometrioid carcinoma | Female | >=65 | I/II | Unknown | Unknown | SD |
| SAV1 | SNV | Missense_Mutation | novel | c.1147N>G | p.Phe383Val | p.F383V | Q9H4B6 | protein_coding | deleterious_low_confidence(0.01) | benign(0.055) | TCGA-AJ-A3EL-01 | Endometrium | uterine corpus endometrioid carcinoma | Female | <65 | I/II | Unknown | Unknown | SD |
| Page: 1 2 3 |
Top |
Related drugs of malignant transformation related genes |
| Identification of chemicals and drugs interact with genes involved in malignant transfromation |
| (DGIdb 4.0) |
| Entrez ID | Symbol | Category | Interaction Types | Drug Claim Name | Drug Name | PMIDs |
| Page: 1 |

Copyright 2023-Present -The University of Texas Health Science Center at Houston |