
|
|||||
|
 | |
| |
| |
| |
| |
| |
|
Gene: SAT2 |
Gene summary for SAT2 |
| Gene information | Species | Human | Gene symbol | SAT2 | Gene ID | 112483 |
| Gene name | spermidine/spermine N1-acetyltransferase family member 2 | |
| Gene Alias | SSAT-2 | |
| Cytomap | 17p13.1 | |
| Gene Type | protein-coding | GO ID | GO:0006576 | UniProtAcc | Q502X4 |
Top |
Malignant transformation analysis |
| Identification of the aberrant gene expression in precancerous and cancerous lesions by comparing the gene expression of stem-like cells in diseased tissues with normal stem cells |
| Entrez ID | Symbol | Replicates | Species | Organ | Tissue | Adj P-value | Log2FC | Malignancy |
| 112483 | SAT2 | AEH-subject1 | Human | Endometrium | AEH | 8.48e-04 | -2.29e-01 | -0.3059 |
| 112483 | SAT2 | AEH-subject2 | Human | Endometrium | AEH | 5.12e-11 | -3.12e-01 | -0.2525 |
| 112483 | SAT2 | AEH-subject3 | Human | Endometrium | AEH | 3.00e-12 | -3.15e-01 | -0.2576 |
| 112483 | SAT2 | AEH-subject4 | Human | Endometrium | AEH | 1.85e-09 | -3.81e-01 | -0.2657 |
| 112483 | SAT2 | AEH-subject5 | Human | Endometrium | AEH | 4.56e-18 | -4.18e-01 | -0.2953 |
| 112483 | SAT2 | EEC-subject1 | Human | Endometrium | EEC | 2.25e-12 | -4.10e-01 | -0.2682 |
| 112483 | SAT2 | EEC-subject2 | Human | Endometrium | EEC | 1.45e-10 | -3.04e-01 | -0.2607 |
| 112483 | SAT2 | EEC-subject3 | Human | Endometrium | EEC | 3.37e-37 | -5.24e-01 | -0.2525 |
| 112483 | SAT2 | EEC-subject4 | Human | Endometrium | EEC | 5.49e-05 | -2.06e-01 | -0.2571 |
| 112483 | SAT2 | EEC-subject5 | Human | Endometrium | EEC | 4.15e-02 | -1.41e-01 | -0.249 |
| 112483 | SAT2 | GSM5276934 | Human | Endometrium | EEC | 1.23e-08 | -3.15e-01 | -0.0913 |
| 112483 | SAT2 | GSM5276937 | Human | Endometrium | EEC | 1.19e-04 | -2.60e-01 | -0.0897 |
| 112483 | SAT2 | GSM6177620_NYU_UCEC1_lib1_lib1 | Human | Endometrium | EEC | 2.03e-37 | -5.45e-01 | -0.1869 |
| 112483 | SAT2 | GSM6177620_NYU_UCEC1_lib2_lib2 | Human | Endometrium | EEC | 2.29e-31 | -4.46e-01 | -0.1875 |
| 112483 | SAT2 | GSM6177620_NYU_UCEC1_lib3_lib3 | Human | Endometrium | EEC | 5.90e-36 | -5.60e-01 | -0.1883 |
| 112483 | SAT2 | GSM6177621_NYU_UCEC2_lib1_lib1 | Human | Endometrium | EEC | 4.58e-31 | -3.79e-01 | -0.1934 |
| 112483 | SAT2 | GSM6177622_NYU_UCEC3_lib1_lib1 | Human | Endometrium | EEC | 3.06e-52 | -5.33e-01 | -0.1917 |
| 112483 | SAT2 | GSM6177622_NYU_UCEC3_lib2_lib2 | Human | Endometrium | EEC | 9.90e-50 | -5.08e-01 | -0.1916 |
| 112483 | SAT2 | GSM6177623_NYU_UCEC3_Vis | Human | Endometrium | EEC | 2.85e-08 | -1.84e-01 | -0.1269 |
| 112483 | SAT2 | LZE3D | Human | Esophagus | HGIN | 3.77e-03 | 7.56e-01 | 0.0668 |
| Page: 1 2 3 4 5 6 7 8 9 |
| Tissue | Expression Dynamics | Abbreviation |
| Endometrium | 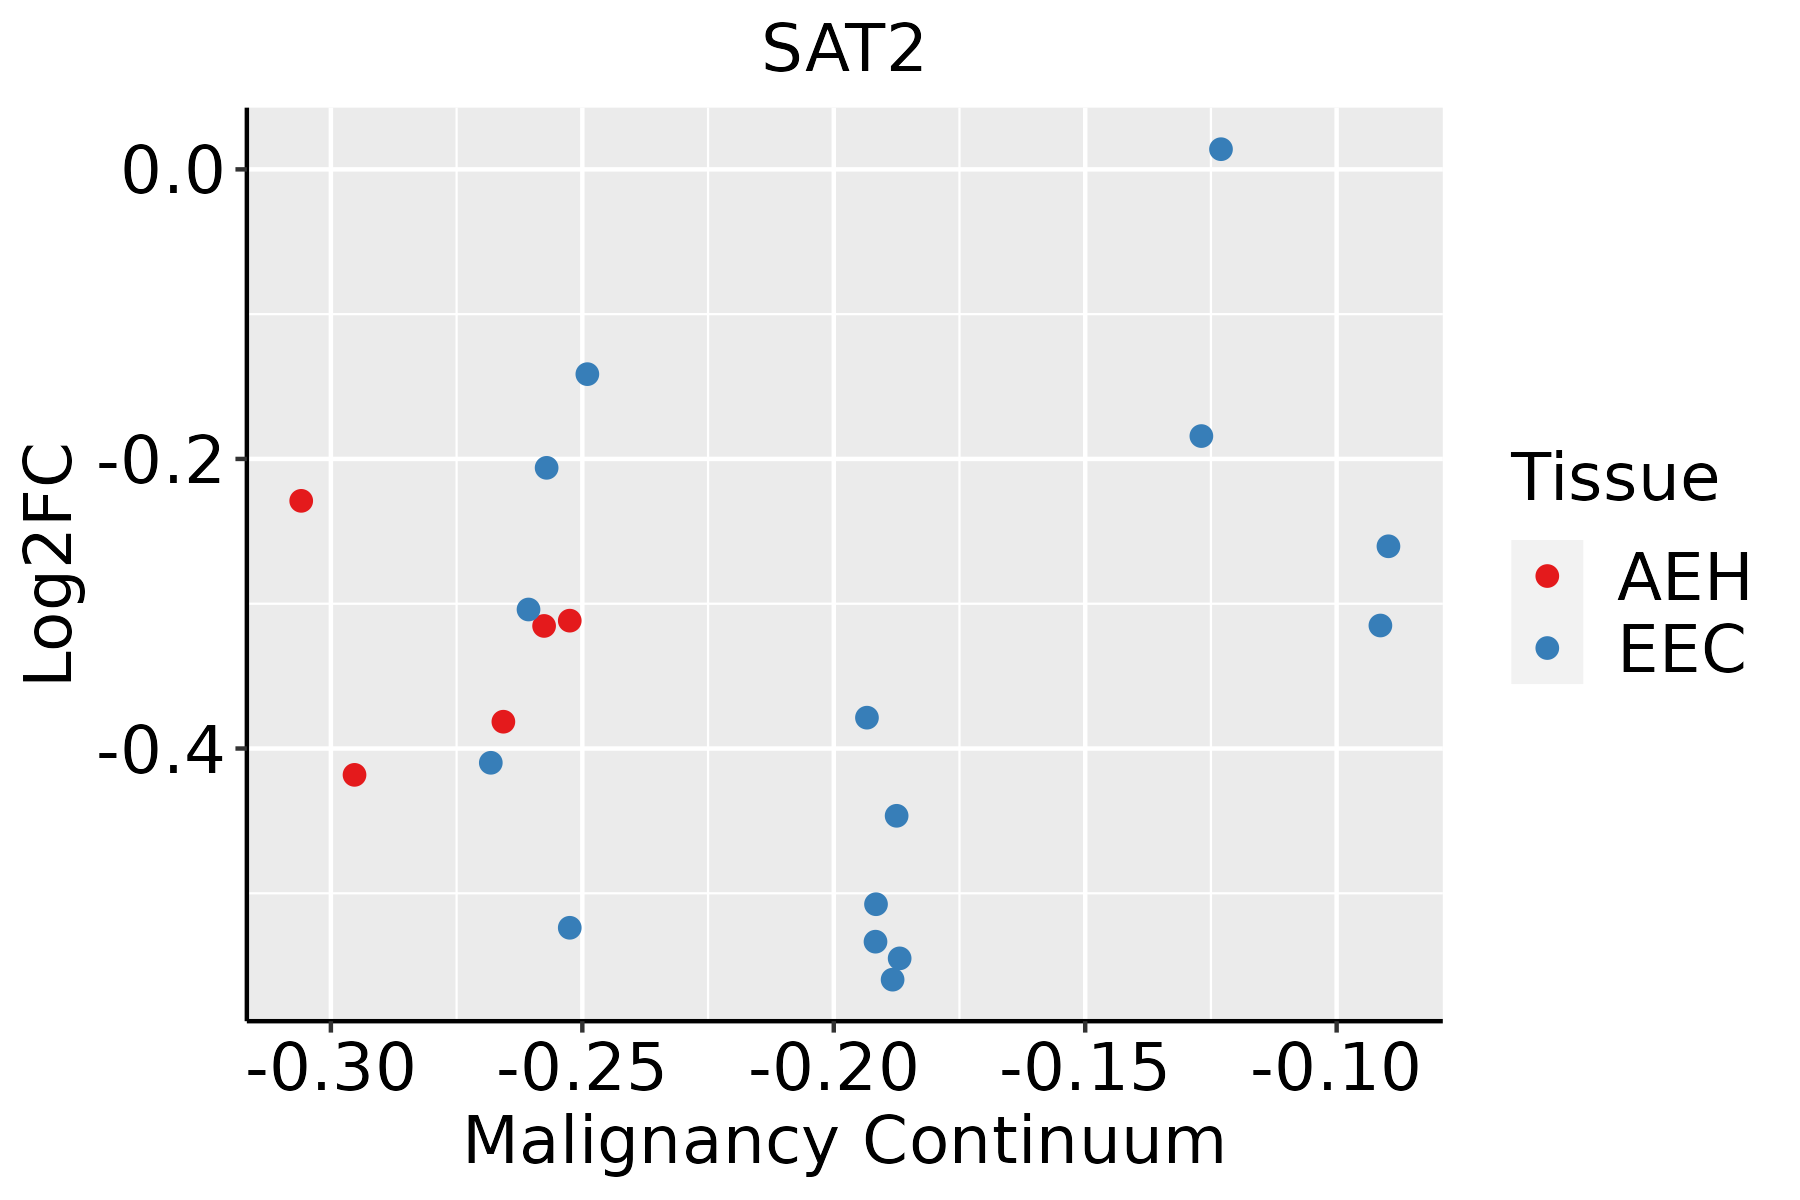 | AEH: Atypical endometrial hyperplasia |
| EEC: Endometrioid Cancer | ||
| Esophagus | 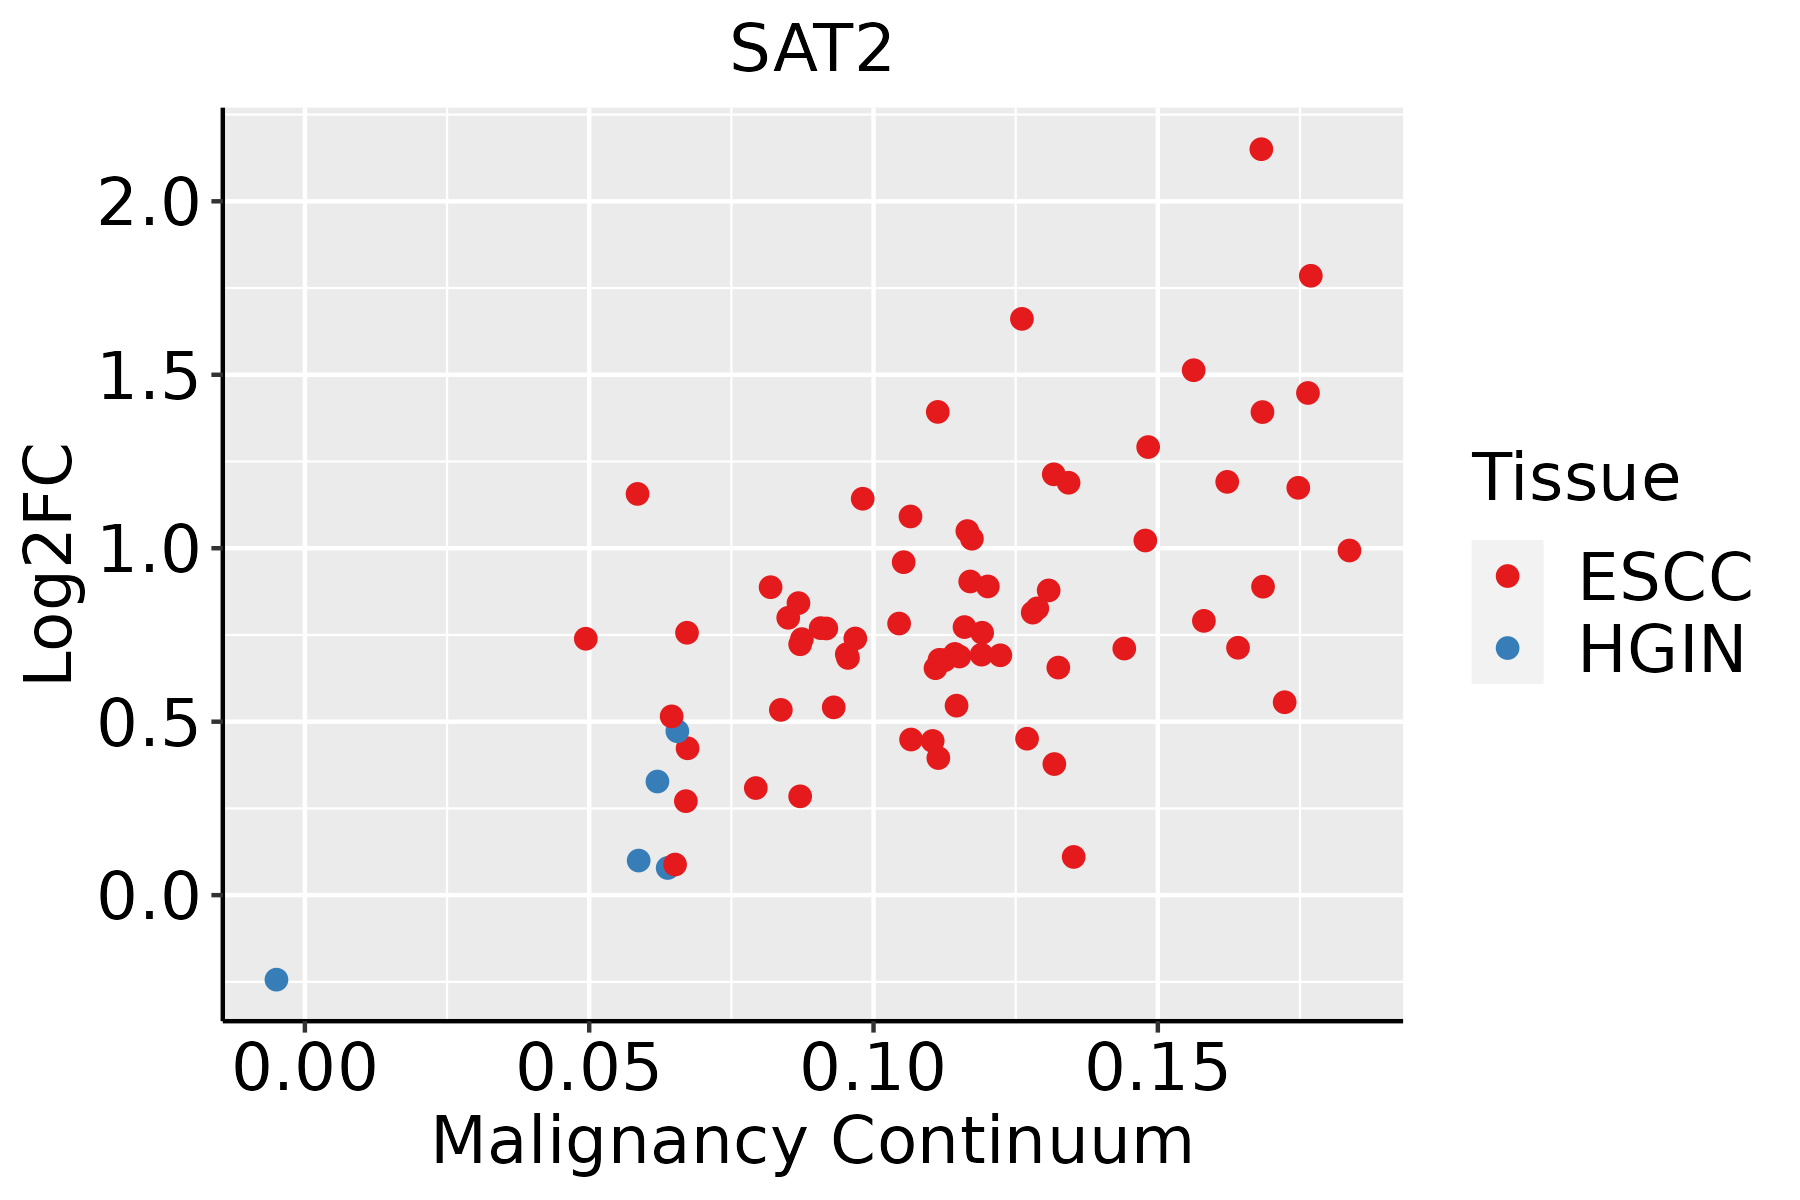 | ESCC: Esophageal squamous cell carcinoma |
| HGIN: High-grade intraepithelial neoplasias | ||
| LGIN: Low-grade intraepithelial neoplasias | ||
| GC | 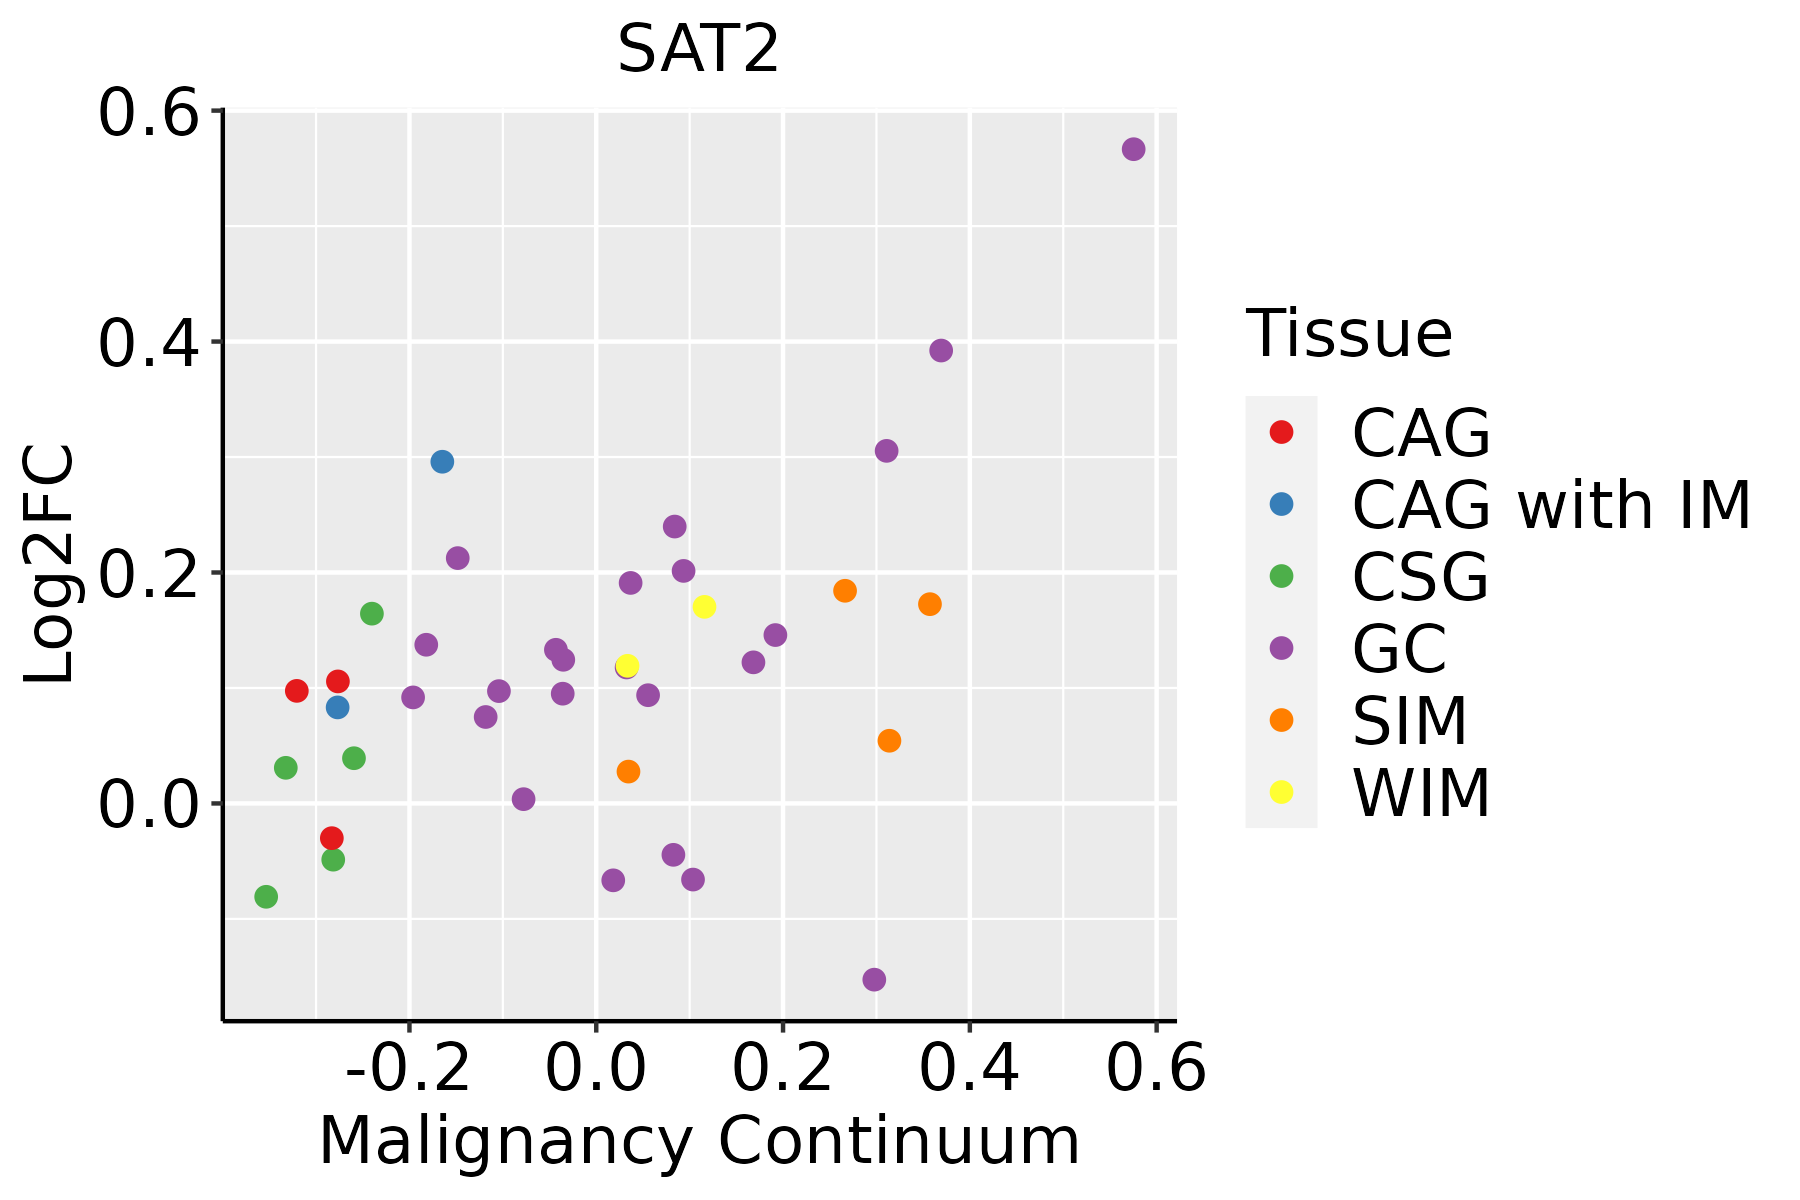 | CAG: Chronic atrophic gastritis |
| CAG with IM: Chronic atrophic gastritis with intestinal metaplasia | ||
| CSG: Chronic superficial gastritis | ||
| GC: Gastric cancer | ||
| SIM: Severe intestinal metaplasia | ||
| WIM: Wild intestinal metaplasia | ||
| Liver | 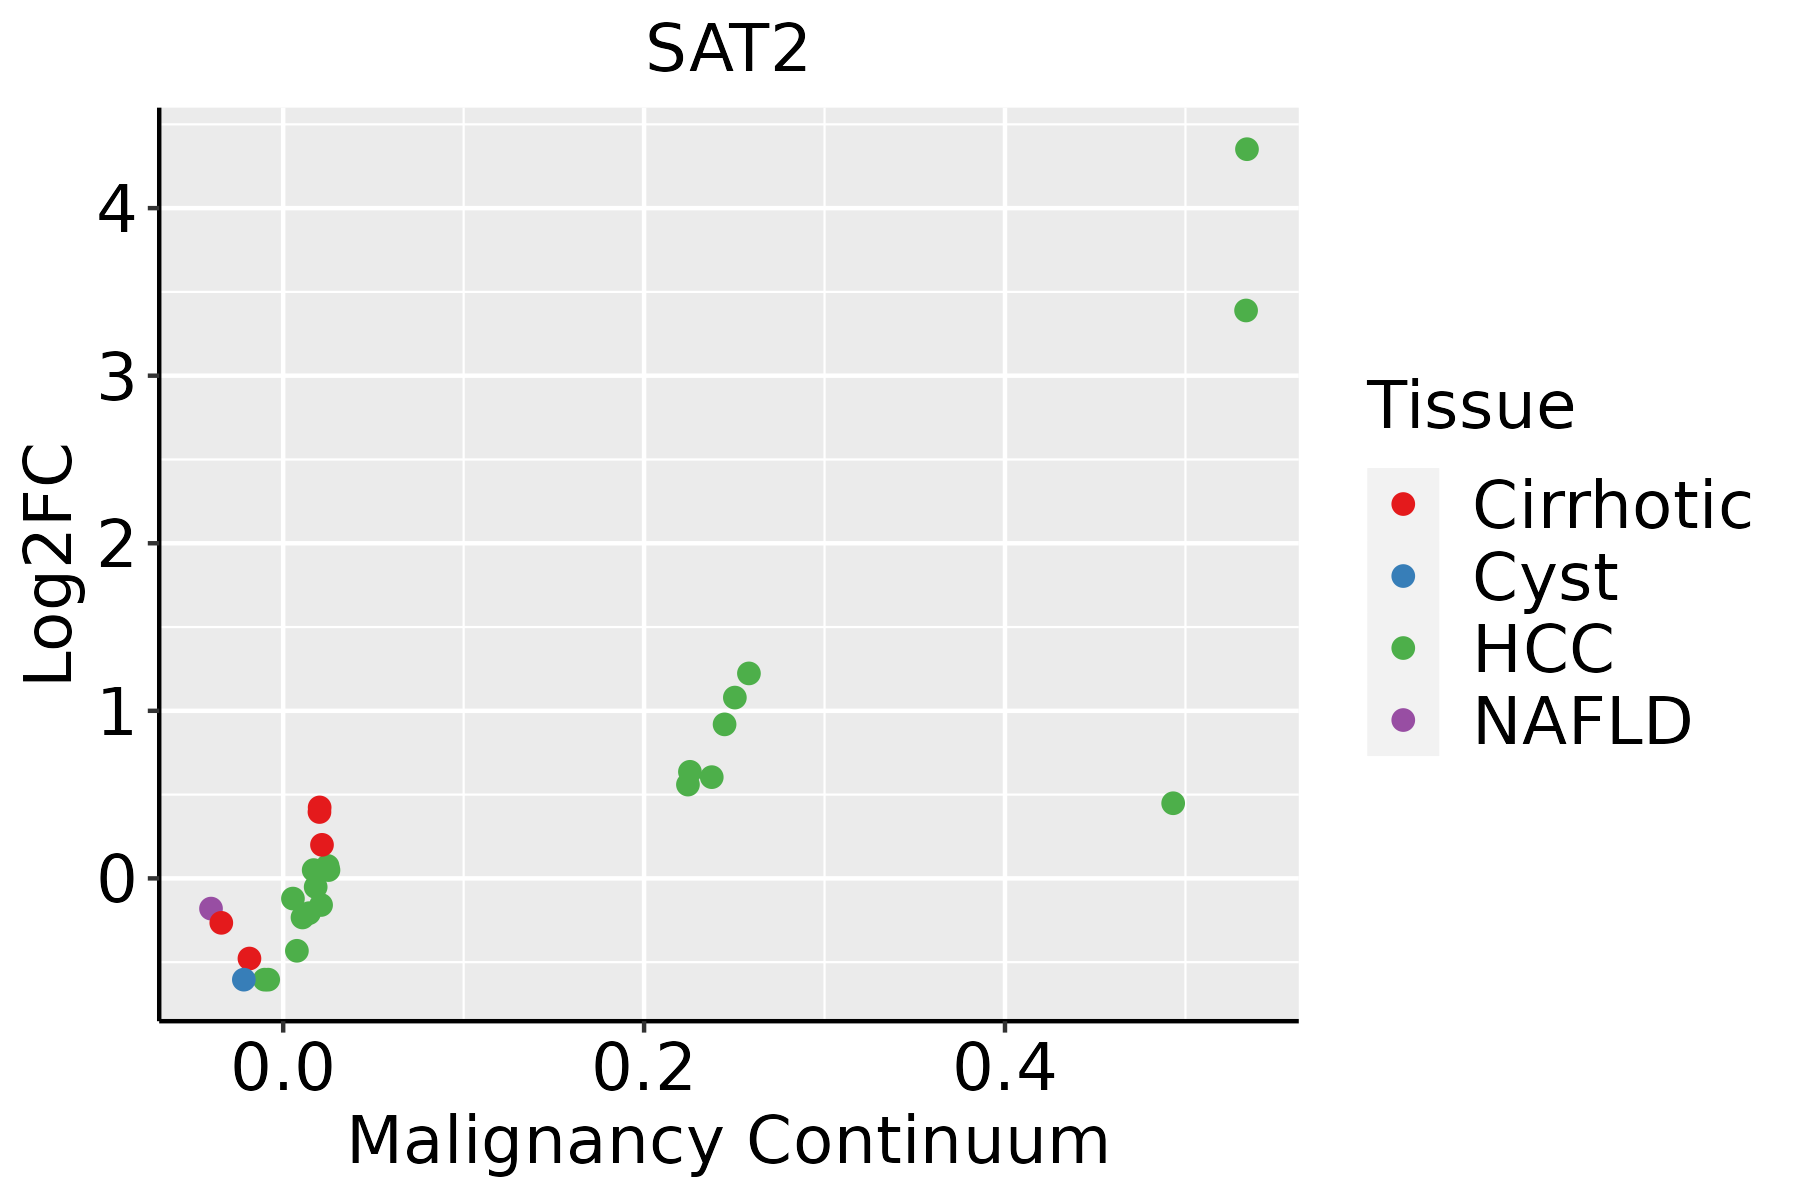 | HCC: Hepatocellular carcinoma |
| NAFLD: Non-alcoholic fatty liver disease | ||
| Oral Cavity | 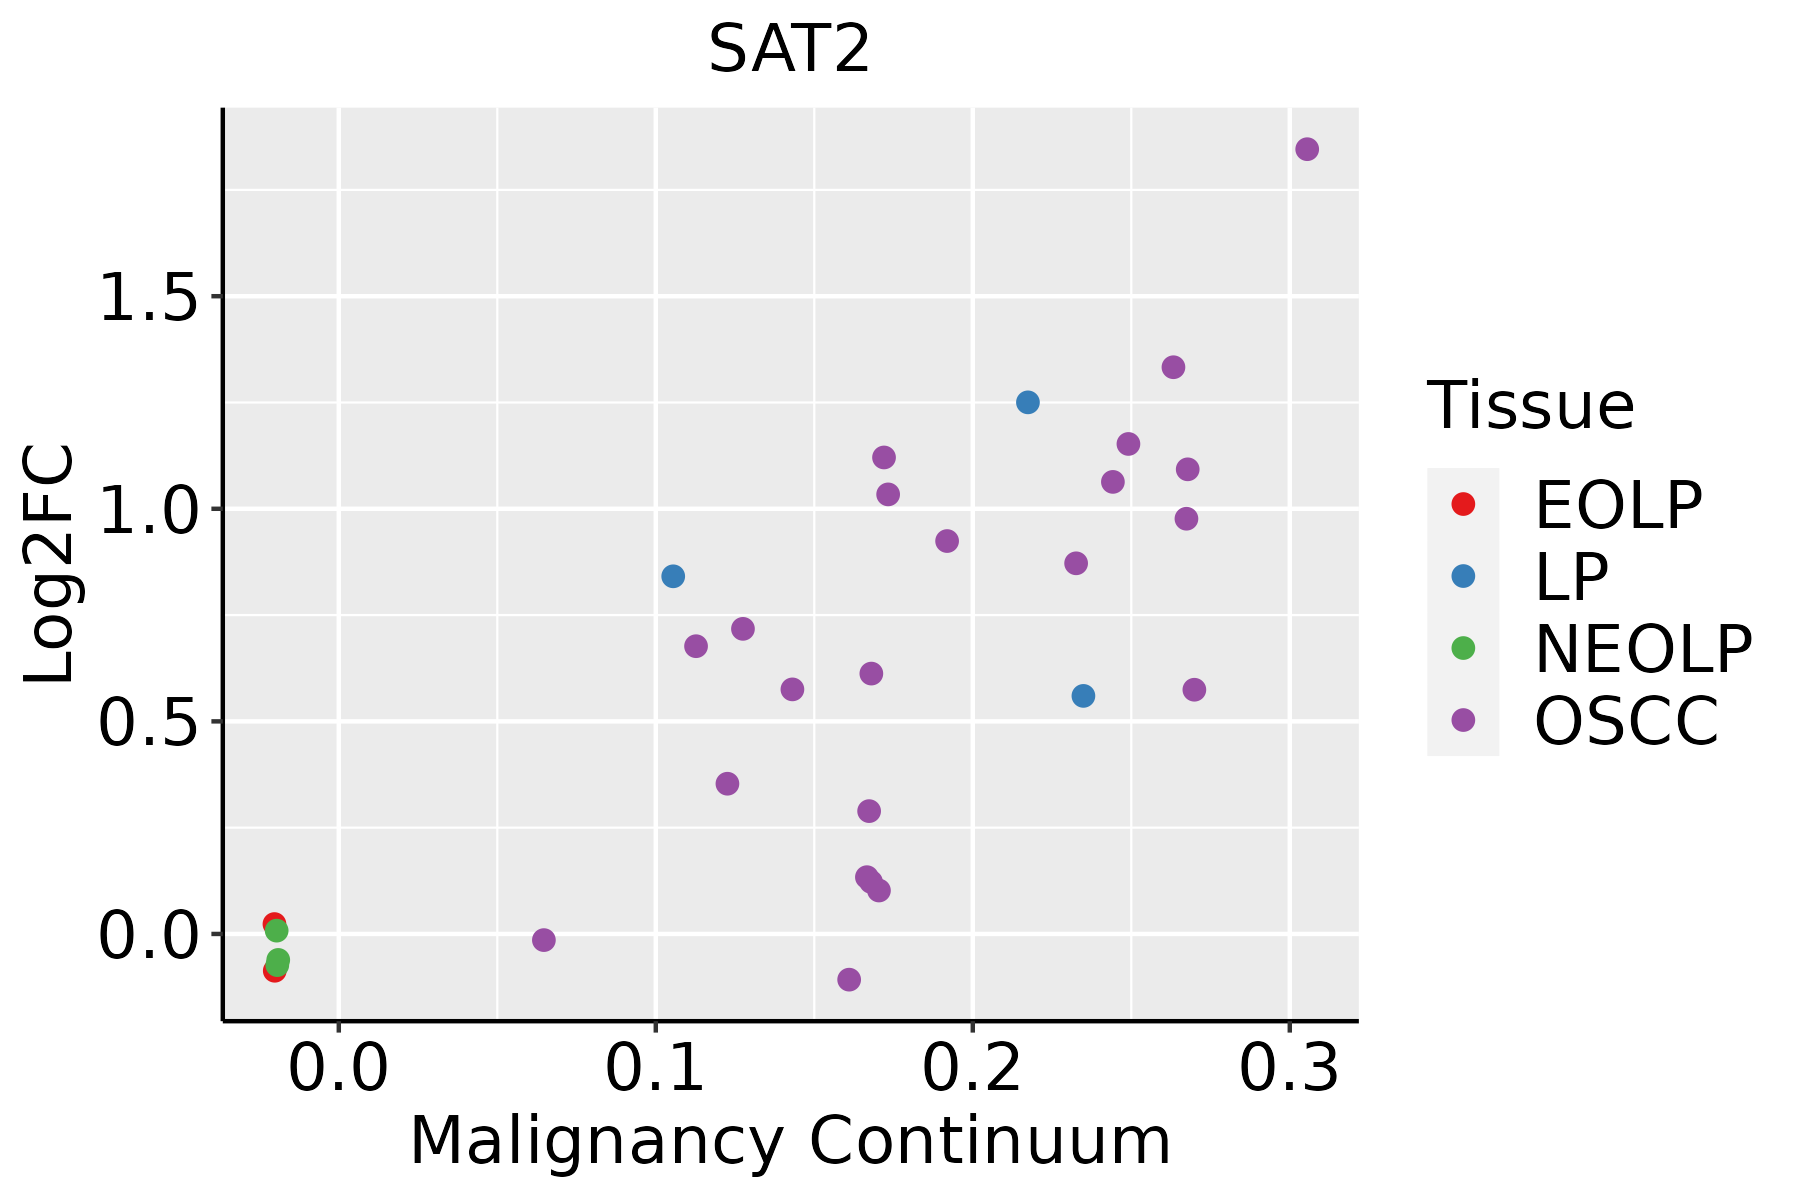 | EOLP: Erosive Oral lichen planus |
| LP: leukoplakia | ||
| NEOLP: Non-erosive oral lichen planus | ||
| OSCC: Oral squamous cell carcinoma | ||
| Prostate | 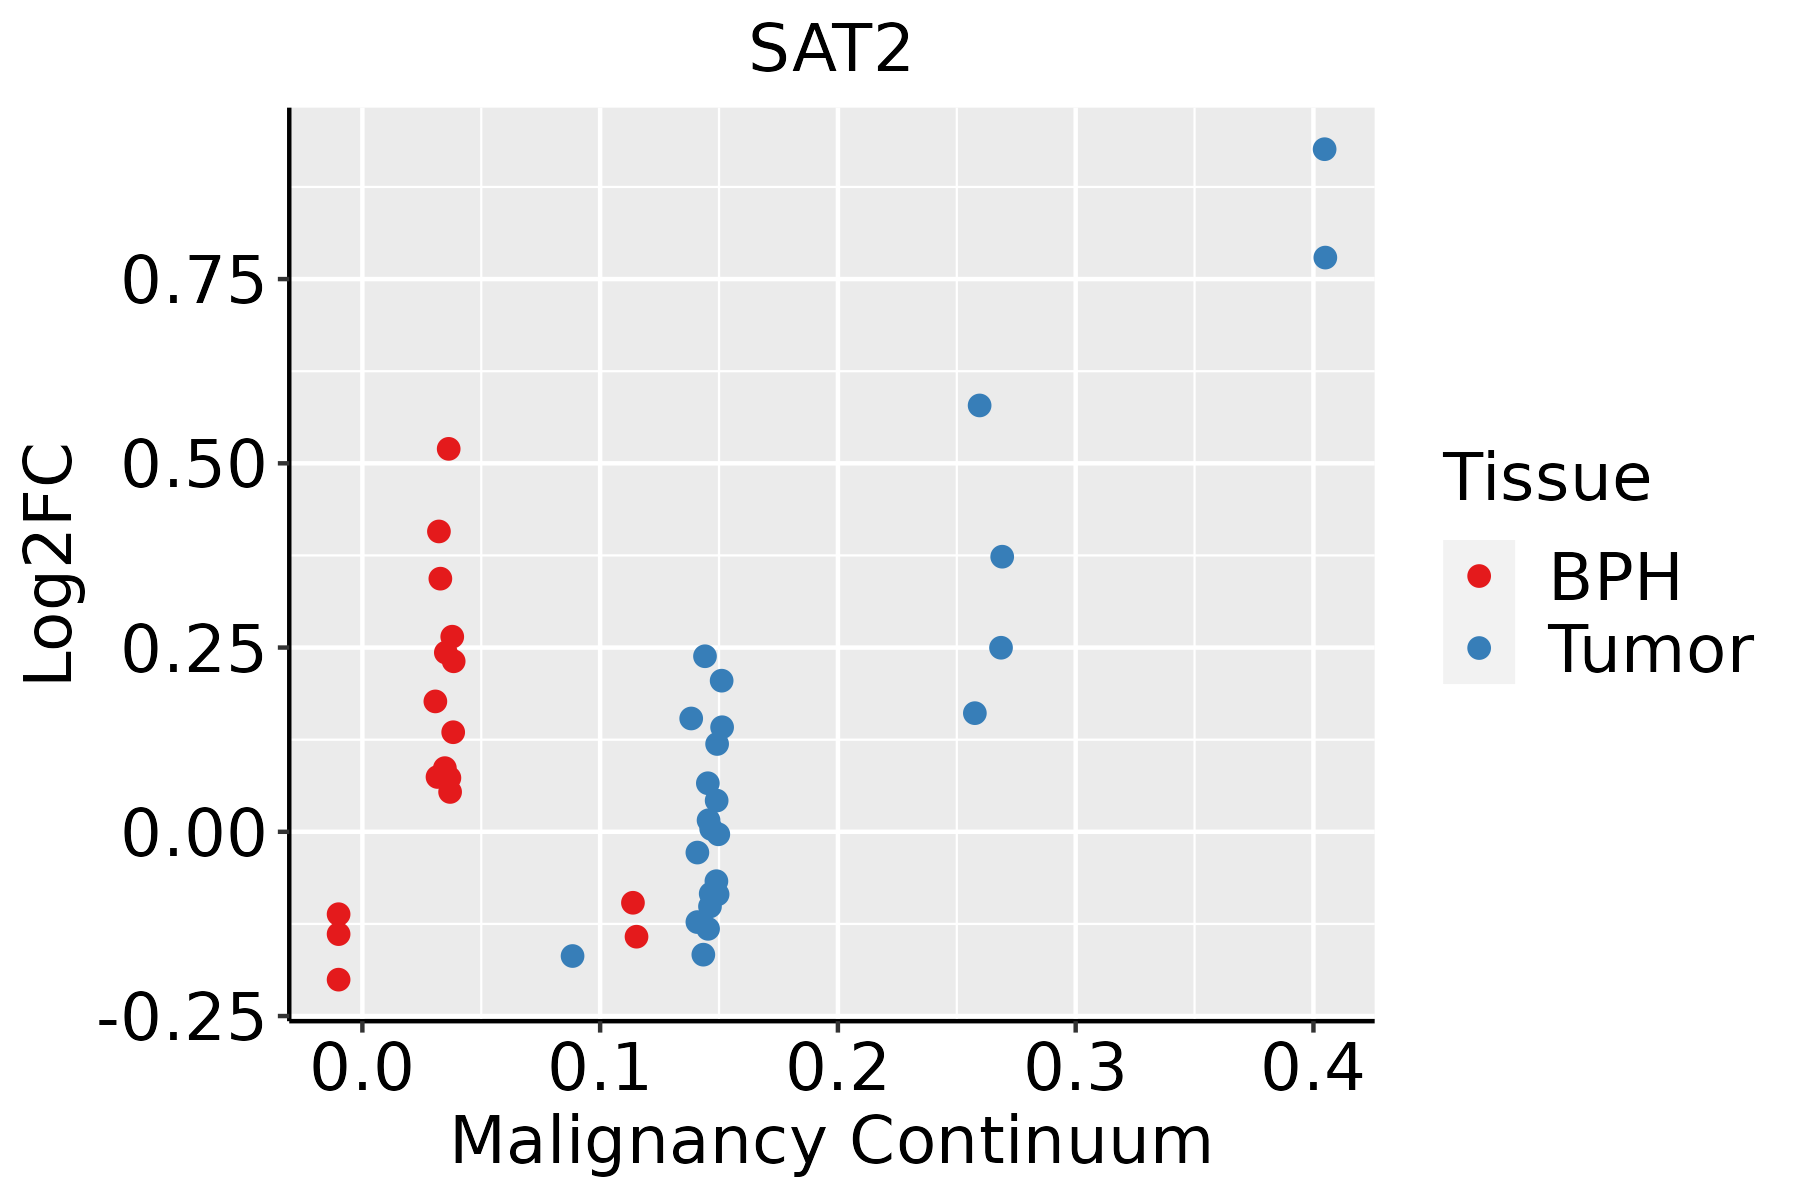 | BPH: Benign Prostatic Hyperplasia |
| Skin | 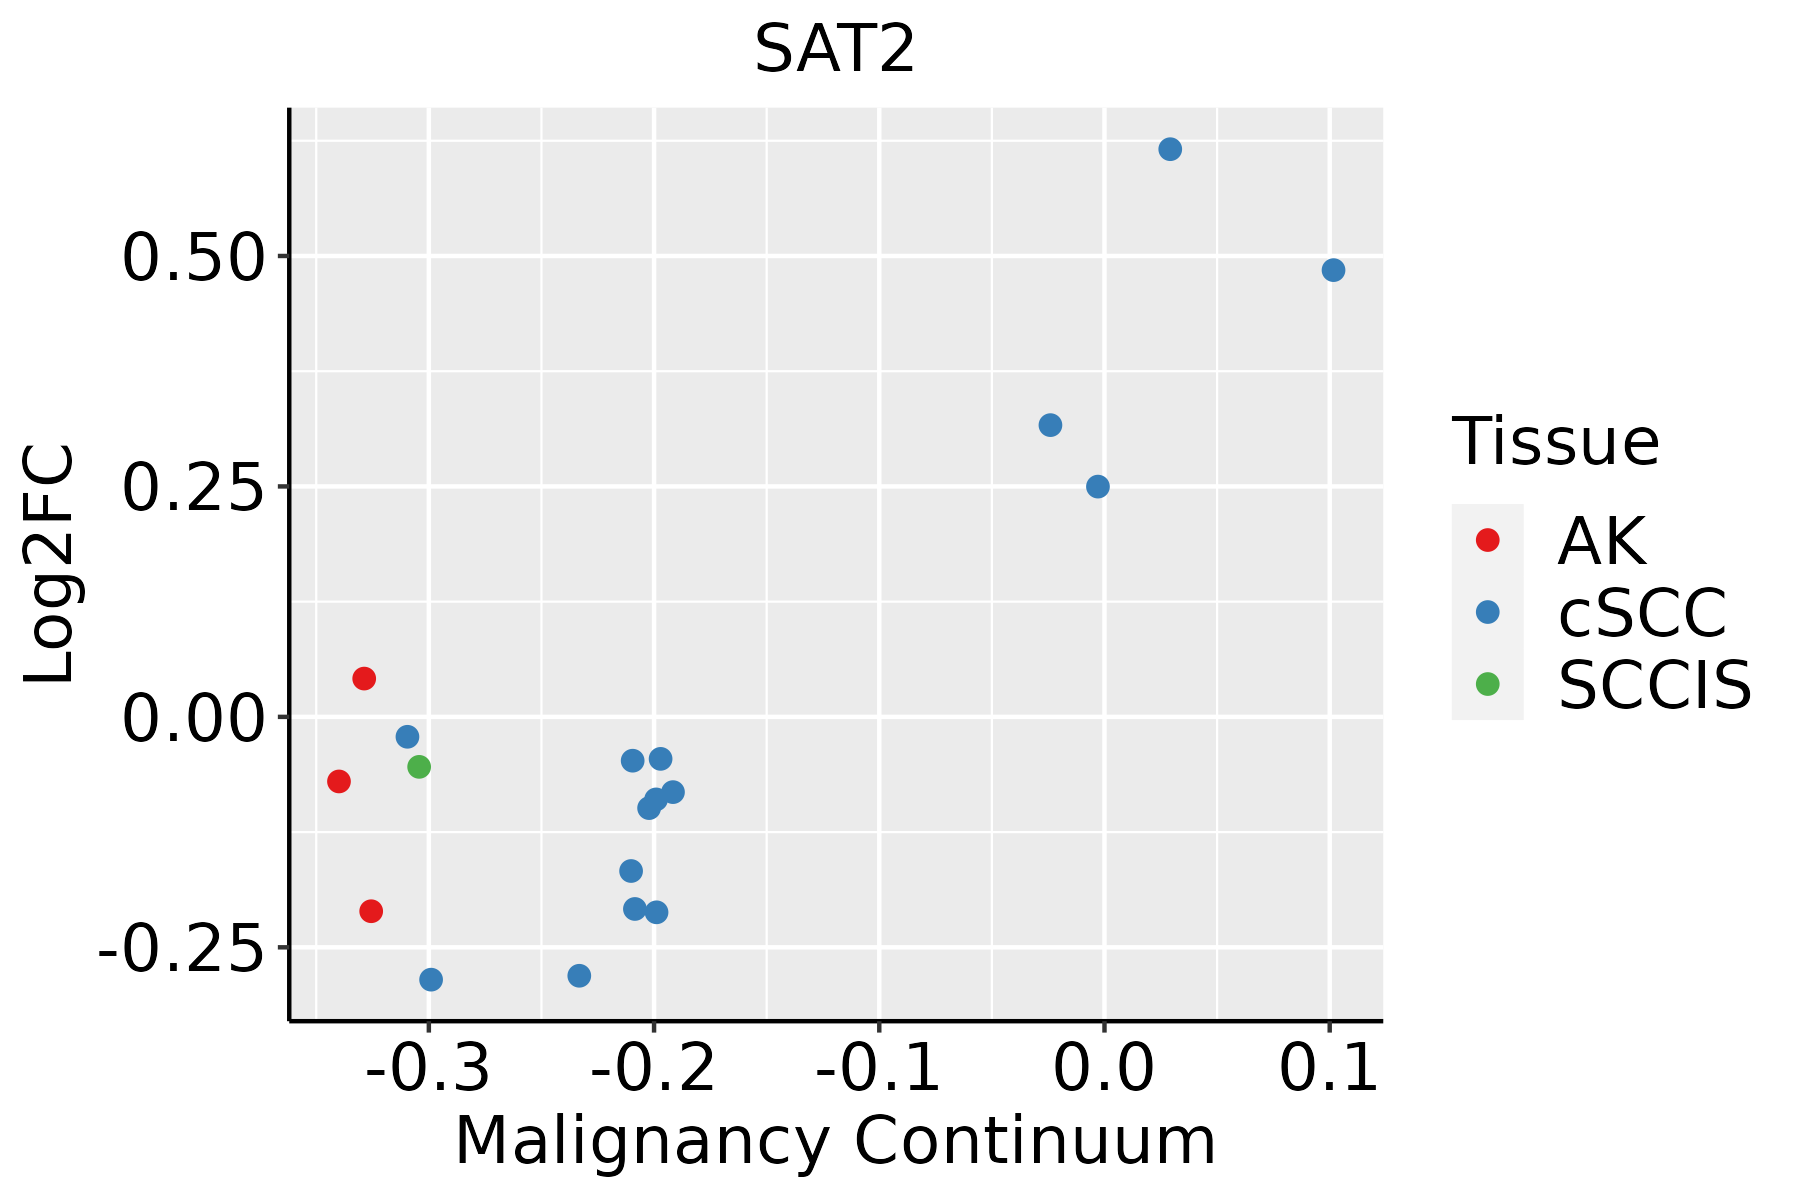 | AK: Actinic keratosis |
| cSCC: Cutaneous squamous cell carcinoma | ||
| SCCIS:squamous cell carcinoma in situ | ||
| Thyroid | 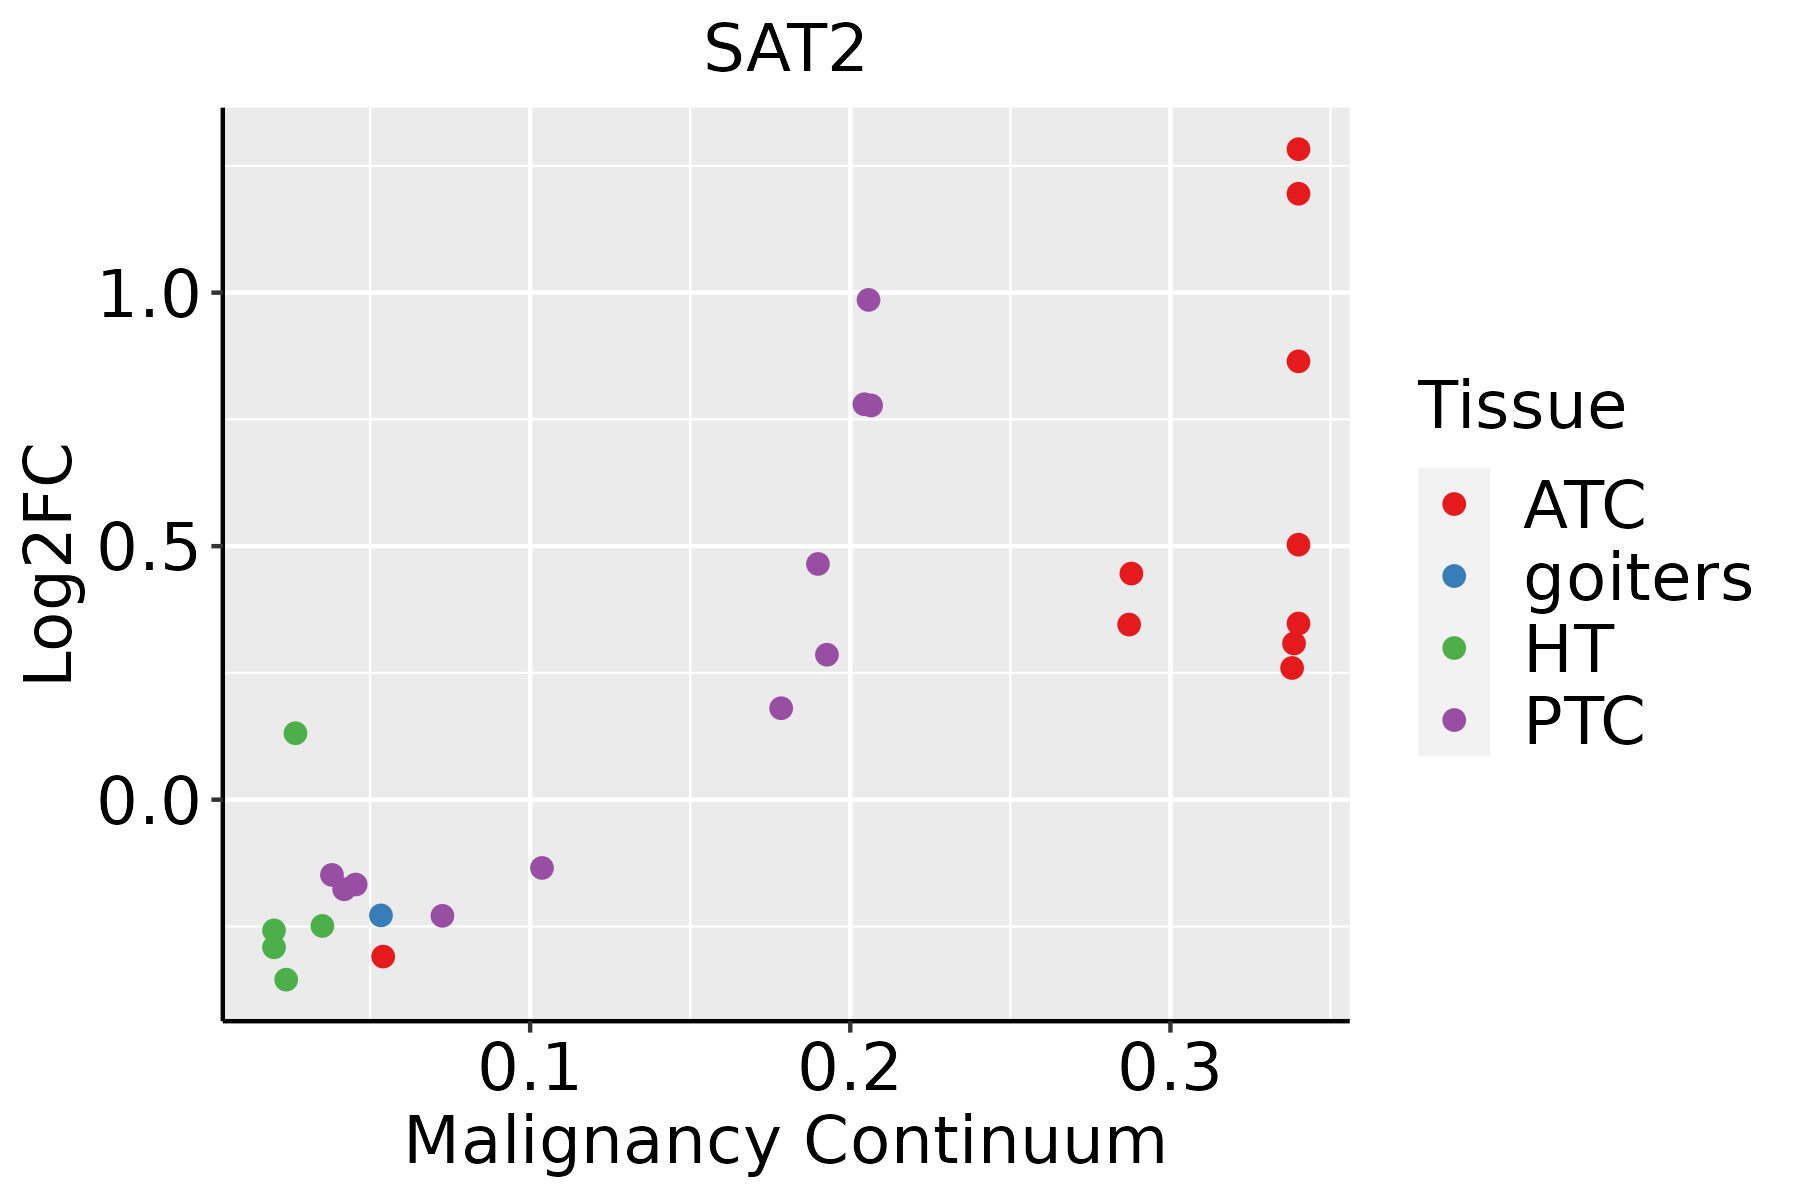 | ATC: Anaplastic thyroid cancer |
| HT: Hashimoto's thyroiditis | ||
| PTC: Papillary thyroid cancer |
| ∗log2FC in expression of this searched gene in stem-like cells from each diseased tissue sample relative to stem-like cells in normal samples in each tissue plotted against the malignancy continuum. Samples are colored based on if they are from different disease stage. |
Top |
Malignant transformation related pathway analysis |
| Find out the enriched GO biological processes and KEGG pathways involved in transition from healthy to precancer to cancer |
| Tissue | Disease Stage | Enriched GO biological Processes |
| Colorectum | AD |  |
| Colorectum | SER |  |
| Colorectum | MSS |  |
| Colorectum | MSI-H |  |
| Colorectum | FAP |  |
| ∗Top 15 enriched GO BP terms are showed in the bar plot of each disease state in each tissue. Each row represents a significant GO biological process which is colored according to the -log10(p.adjust). |
| Page: 1 2 3 4 5 6 7 8 9 |
| GO ID | Tissue | Disease Stage | Description | Gene Ratio | Bg Ratio | pvalue | p.adjust | Count |
| GO:00065952 | Endometrium | EEC | polyamine metabolic process | 7/2168 | 18/18723 | 2.76e-03 | 1.97e-02 | 7 |
| GO:0006595 | Liver | Cirrhotic | polyamine metabolic process | 12/4634 | 18/18723 | 2.07e-04 | 1.90e-03 | 12 |
| GO:0044106 | Liver | Cirrhotic | cellular amine metabolic process | 43/4634 | 113/18723 | 1.15e-03 | 7.83e-03 | 43 |
| GO:0006576 | Liver | Cirrhotic | cellular biogenic amine metabolic process | 38/4634 | 101/18723 | 2.72e-03 | 1.59e-02 | 38 |
| GO:0009308 | Liver | Cirrhotic | amine metabolic process | 43/4634 | 118/18723 | 3.03e-03 | 1.72e-02 | 43 |
| GO:00065951 | Liver | HCC | polyamine metabolic process | 14/7958 | 18/18723 | 2.57e-03 | 1.23e-02 | 14 |
| GO:00065954 | Oral cavity | OSCC | polyamine metabolic process | 13/7305 | 18/18723 | 4.45e-03 | 1.79e-02 | 13 |
| GO:000659512 | Oral cavity | LP | polyamine metabolic process | 13/4623 | 18/18723 | 2.94e-05 | 4.58e-04 | 13 |
| GO:00065953 | Prostate | BPH | polyamine metabolic process | 10/3107 | 18/18723 | 1.87e-04 | 1.55e-03 | 10 |
| GO:000659511 | Prostate | Tumor | polyamine metabolic process | 11/3246 | 18/18723 | 4.01e-05 | 4.60e-04 | 11 |
| GO:00065761 | Prostate | Tumor | cellular biogenic amine metabolic process | 27/3246 | 101/18723 | 1.18e-02 | 4.81e-02 | 27 |
| GO:000659513 | Skin | cSCC | polyamine metabolic process | 11/4864 | 18/18723 | 1.74e-03 | 1.06e-02 | 11 |
| Page: 1 |
| Pathway ID | Tissue | Disease Stage | Description | Gene Ratio | Bg Ratio | pvalue | p.adjust | qvalue | Count |
| hsa0421616 | Endometrium | AEH | Ferroptosis | 15/1197 | 41/8465 | 2.83e-04 | 2.30e-03 | 1.68e-03 | 15 |
| hsa0421617 | Endometrium | AEH | Ferroptosis | 15/1197 | 41/8465 | 2.83e-04 | 2.30e-03 | 1.68e-03 | 15 |
| hsa0421625 | Endometrium | EEC | Ferroptosis | 16/1237 | 41/8465 | 1.09e-04 | 1.08e-03 | 8.08e-04 | 16 |
| hsa0421635 | Endometrium | EEC | Ferroptosis | 16/1237 | 41/8465 | 1.09e-04 | 1.08e-03 | 8.08e-04 | 16 |
| hsa0421628 | Esophagus | HGIN | Ferroptosis | 15/1383 | 41/8465 | 1.35e-03 | 1.26e-02 | 1.00e-02 | 15 |
| hsa04216111 | Esophagus | HGIN | Ferroptosis | 15/1383 | 41/8465 | 1.35e-03 | 1.26e-02 | 1.00e-02 | 15 |
| hsa0421629 | Esophagus | ESCC | Ferroptosis | 33/4205 | 41/8465 | 4.58e-05 | 1.99e-04 | 1.02e-04 | 33 |
| hsa0421638 | Esophagus | ESCC | Ferroptosis | 33/4205 | 41/8465 | 4.58e-05 | 1.99e-04 | 1.02e-04 | 33 |
| hsa0421621 | Liver | Cirrhotic | Ferroptosis | 23/2530 | 41/8465 | 4.09e-04 | 2.57e-03 | 1.58e-03 | 23 |
| hsa003308 | Liver | Cirrhotic | Arginine and proline metabolism | 25/2530 | 50/8465 | 2.18e-03 | 9.41e-03 | 5.80e-03 | 25 |
| hsa0421631 | Liver | Cirrhotic | Ferroptosis | 23/2530 | 41/8465 | 4.09e-04 | 2.57e-03 | 1.58e-03 | 23 |
| hsa0033011 | Liver | Cirrhotic | Arginine and proline metabolism | 25/2530 | 50/8465 | 2.18e-03 | 9.41e-03 | 5.80e-03 | 25 |
| hsa0421641 | Liver | HCC | Ferroptosis | 33/4020 | 41/8465 | 1.42e-05 | 9.88e-05 | 5.50e-05 | 33 |
| hsa0033021 | Liver | HCC | Arginine and proline metabolism | 33/4020 | 50/8465 | 6.28e-03 | 1.77e-02 | 9.83e-03 | 33 |
| hsa0421651 | Liver | HCC | Ferroptosis | 33/4020 | 41/8465 | 1.42e-05 | 9.88e-05 | 5.50e-05 | 33 |
| hsa0033031 | Liver | HCC | Arginine and proline metabolism | 33/4020 | 50/8465 | 6.28e-03 | 1.77e-02 | 9.83e-03 | 33 |
| hsa0421620 | Oral cavity | OSCC | Ferroptosis | 29/3704 | 41/8465 | 4.26e-04 | 1.30e-03 | 6.60e-04 | 29 |
| hsa0033010 | Oral cavity | OSCC | Arginine and proline metabolism | 30/3704 | 50/8465 | 1.50e-02 | 3.26e-02 | 1.66e-02 | 30 |
| hsa04216110 | Oral cavity | OSCC | Ferroptosis | 29/3704 | 41/8465 | 4.26e-04 | 1.30e-03 | 6.60e-04 | 29 |
| hsa0033013 | Oral cavity | OSCC | Arginine and proline metabolism | 30/3704 | 50/8465 | 1.50e-02 | 3.26e-02 | 1.66e-02 | 30 |
| Page: 1 2 |
Top |
Cell-cell communication analysis |
| Identification of potential cell-cell interactions between two cell types and their ligand-receptor pairs for different disease states |
| Ligand | Receptor | LRpair | Pathway | Tissue | Disease Stage |
| Page: 1 |
Top |
Single-cell gene regulatory network inference analysis |
| Find out the significant the regulons (TFs) and the target genes of each regulon across cell types for different disease states |
| TF | Cell Type | Tissue | Disease Stage | Target Gene | RSS | Regulon Activity |
| ∗The dot plots of a searched regulon are shown for all cell subpopulations in each disease state of each tissue based on the regulon specific score inferred using pySCENIC and by calculating the average expression. |
| Page: 1 |
Top |
Somatic mutation of malignant transformation related genes |
| Annotation of somatic variants for genes involved in malignant transformation |
| Hugo Symbol | Variant Class | Variant Classification | dbSNP RS | HGVSc | HGVSp | HGVSp Short | SWISSPROT | BIOTYPE | SIFT | PolyPhen | Tumor Sample Barcode | Tissue | Histology | Sex | Age | Stage | Therapy Types | Drugs | Outcome |
| SAT2 | SNV | Missense_Mutation | c.55N>T | p.Arg19Trp | p.R19W | Q96F10 | protein_coding | deleterious(0) | probably_damaging(0.981) | TCGA-BH-A0BZ-01 | Breast | breast invasive carcinoma | Female | <65 | III/IV | Chemotherapy | doxorubicin | CR | |
| SAT2 | SNV | Missense_Mutation | rs781342459 | c.260G>A | p.Arg87His | p.R87H | Q96F10 | protein_coding | deleterious(0) | probably_damaging(0.988) | TCGA-AA-A010-01 | Colorectum | colon adenocarcinoma | Female | <65 | I/II | Chemotherapy | folinic | CR |
| SAT2 | SNV | Missense_Mutation | rs777816800 | c.385N>A | p.Val129Ile | p.V129I | Q96F10 | protein_coding | deleterious(0.04) | possibly_damaging(0.749) | TCGA-AG-3999-01 | Colorectum | rectum adenocarcinoma | Female | <65 | III/IV | Unspecific | PD | |
| SAT2 | SNV | Missense_Mutation | novel | c.81N>A | p.Phe27Leu | p.F27L | Q96F10 | protein_coding | deleterious(0.01) | benign(0.021) | TCGA-AP-A1E0-01 | Endometrium | uterine corpus endometrioid carcinoma | Female | <65 | III/IV | Chemotherapy | paclitaxel | SD |
| SAT2 | SNV | Missense_Mutation | c.364N>C | p.Cys122Arg | p.C122R | Q96F10 | protein_coding | deleterious(0) | probably_damaging(0.998) | TCGA-AX-A1CE-01 | Endometrium | uterine corpus endometrioid carcinoma | Female | <65 | I/II | Unspecific | Paclitaxel | SD | |
| SAT2 | SNV | Missense_Mutation | c.237C>A | p.Phe79Leu | p.F79L | Q96F10 | protein_coding | deleterious(0.04) | benign(0.02) | TCGA-BS-A0UV-01 | Endometrium | uterine corpus endometrioid carcinoma | Female | <65 | III/IV | Unknown | Unknown | SD | |
| SAT2 | SNV | Missense_Mutation | novel | c.105N>T | p.Lys35Asn | p.K35N | Q96F10 | protein_coding | deleterious(0.01) | possibly_damaging(0.608) | TCGA-EO-A22X-01 | Endometrium | uterine corpus endometrioid carcinoma | Female | <65 | III/IV | Unspecific | Carboplatin | Complete Response |
| SAT2 | SNV | Missense_Mutation | novel | c.127N>A | p.Ala43Thr | p.A43T | Q96F10 | protein_coding | tolerated(0.54) | benign(0.001) | TCGA-EO-A3B0-01 | Endometrium | uterine corpus endometrioid carcinoma | Female | <65 | III/IV | Unknown | Unknown | SD |
| SAT2 | SNV | Missense_Mutation | novel | c.63N>G | p.Ile21Met | p.I21M | Q96F10 | protein_coding | deleterious(0.03) | benign(0.255) | TCGA-34-8454-01 | Lung | lung squamous cell carcinoma | Female | <65 | III/IV | Chemotherapy | cisplatin | SD |
| SAT2 | SNV | Missense_Mutation | novel | c.486N>C | p.Glu162Asp | p.E162D | Q96F10 | protein_coding | tolerated(0.12) | benign(0.003) | TCGA-CV-A461-01 | Oral cavity | head & neck squamous cell carcinoma | Male | >=65 | I/II | Unknown | Unknown | SD |
| Page: 1 2 |
Top |
Related drugs of malignant transformation related genes |
| Identification of chemicals and drugs interact with genes involved in malignant transfromation |
| (DGIdb 4.0) |
| Entrez ID | Symbol | Category | Interaction Types | Drug Claim Name | Drug Name | PMIDs |
| Page: 1 |

Copyright 2023-Present -The University of Texas Health Science Center at Houston |