
|
|||||
|
 | |
| |
| |
| |
| |
| |
|
Gene: SASS6 |
Gene summary for SASS6 |
| Gene information | Species | Human | Gene symbol | SASS6 | Gene ID | 163786 |
| Gene name | SAS-6 centriolar assembly protein | |
| Gene Alias | MCPH14 | |
| Cytomap | 1p21.2 | |
| Gene Type | protein-coding | GO ID | GO:0000226 | UniProtAcc | Q495U0 |
Top |
Malignant transformation analysis |
| Identification of the aberrant gene expression in precancerous and cancerous lesions by comparing the gene expression of stem-like cells in diseased tissues with normal stem cells |
| Entrez ID | Symbol | Replicates | Species | Organ | Tissue | Adj P-value | Log2FC | Malignancy |
| 163786 | SASS6 | LZE2T | Human | Esophagus | ESCC | 9.54e-06 | 5.58e-01 | 0.082 |
| 163786 | SASS6 | P2T-E | Human | Esophagus | ESCC | 2.27e-21 | 3.76e-01 | 0.1177 |
| 163786 | SASS6 | P4T-E | Human | Esophagus | ESCC | 6.27e-06 | 1.66e-01 | 0.1323 |
| 163786 | SASS6 | P5T-E | Human | Esophagus | ESCC | 4.98e-10 | 2.45e-01 | 0.1327 |
| 163786 | SASS6 | P8T-E | Human | Esophagus | ESCC | 4.40e-09 | 1.83e-01 | 0.0889 |
| 163786 | SASS6 | P10T-E | Human | Esophagus | ESCC | 1.85e-18 | 2.80e-01 | 0.116 |
| 163786 | SASS6 | P12T-E | Human | Esophagus | ESCC | 2.67e-13 | 3.42e-01 | 0.1122 |
| 163786 | SASS6 | P16T-E | Human | Esophagus | ESCC | 9.35e-10 | 2.05e-01 | 0.1153 |
| 163786 | SASS6 | P17T-E | Human | Esophagus | ESCC | 1.49e-02 | 1.53e-01 | 0.1278 |
| 163786 | SASS6 | P20T-E | Human | Esophagus | ESCC | 3.20e-07 | 1.86e-01 | 0.1124 |
| 163786 | SASS6 | P21T-E | Human | Esophagus | ESCC | 2.97e-02 | 1.14e-01 | 0.1617 |
| 163786 | SASS6 | P23T-E | Human | Esophagus | ESCC | 2.33e-11 | 2.86e-01 | 0.108 |
| 163786 | SASS6 | P26T-E | Human | Esophagus | ESCC | 2.17e-03 | 1.38e-01 | 0.1276 |
| 163786 | SASS6 | P27T-E | Human | Esophagus | ESCC | 9.20e-06 | 1.41e-01 | 0.1055 |
| 163786 | SASS6 | P28T-E | Human | Esophagus | ESCC | 6.08e-15 | 3.43e-01 | 0.1149 |
| 163786 | SASS6 | P30T-E | Human | Esophagus | ESCC | 7.79e-07 | 2.51e-01 | 0.137 |
| 163786 | SASS6 | P31T-E | Human | Esophagus | ESCC | 6.50e-08 | 2.49e-01 | 0.1251 |
| 163786 | SASS6 | P32T-E | Human | Esophagus | ESCC | 6.74e-08 | 2.82e-01 | 0.1666 |
| 163786 | SASS6 | P36T-E | Human | Esophagus | ESCC | 2.09e-07 | 2.32e-01 | 0.1187 |
| 163786 | SASS6 | P37T-E | Human | Esophagus | ESCC | 2.57e-08 | 1.95e-01 | 0.1371 |
| Page: 1 2 3 |
| Tissue | Expression Dynamics | Abbreviation |
| Esophagus | 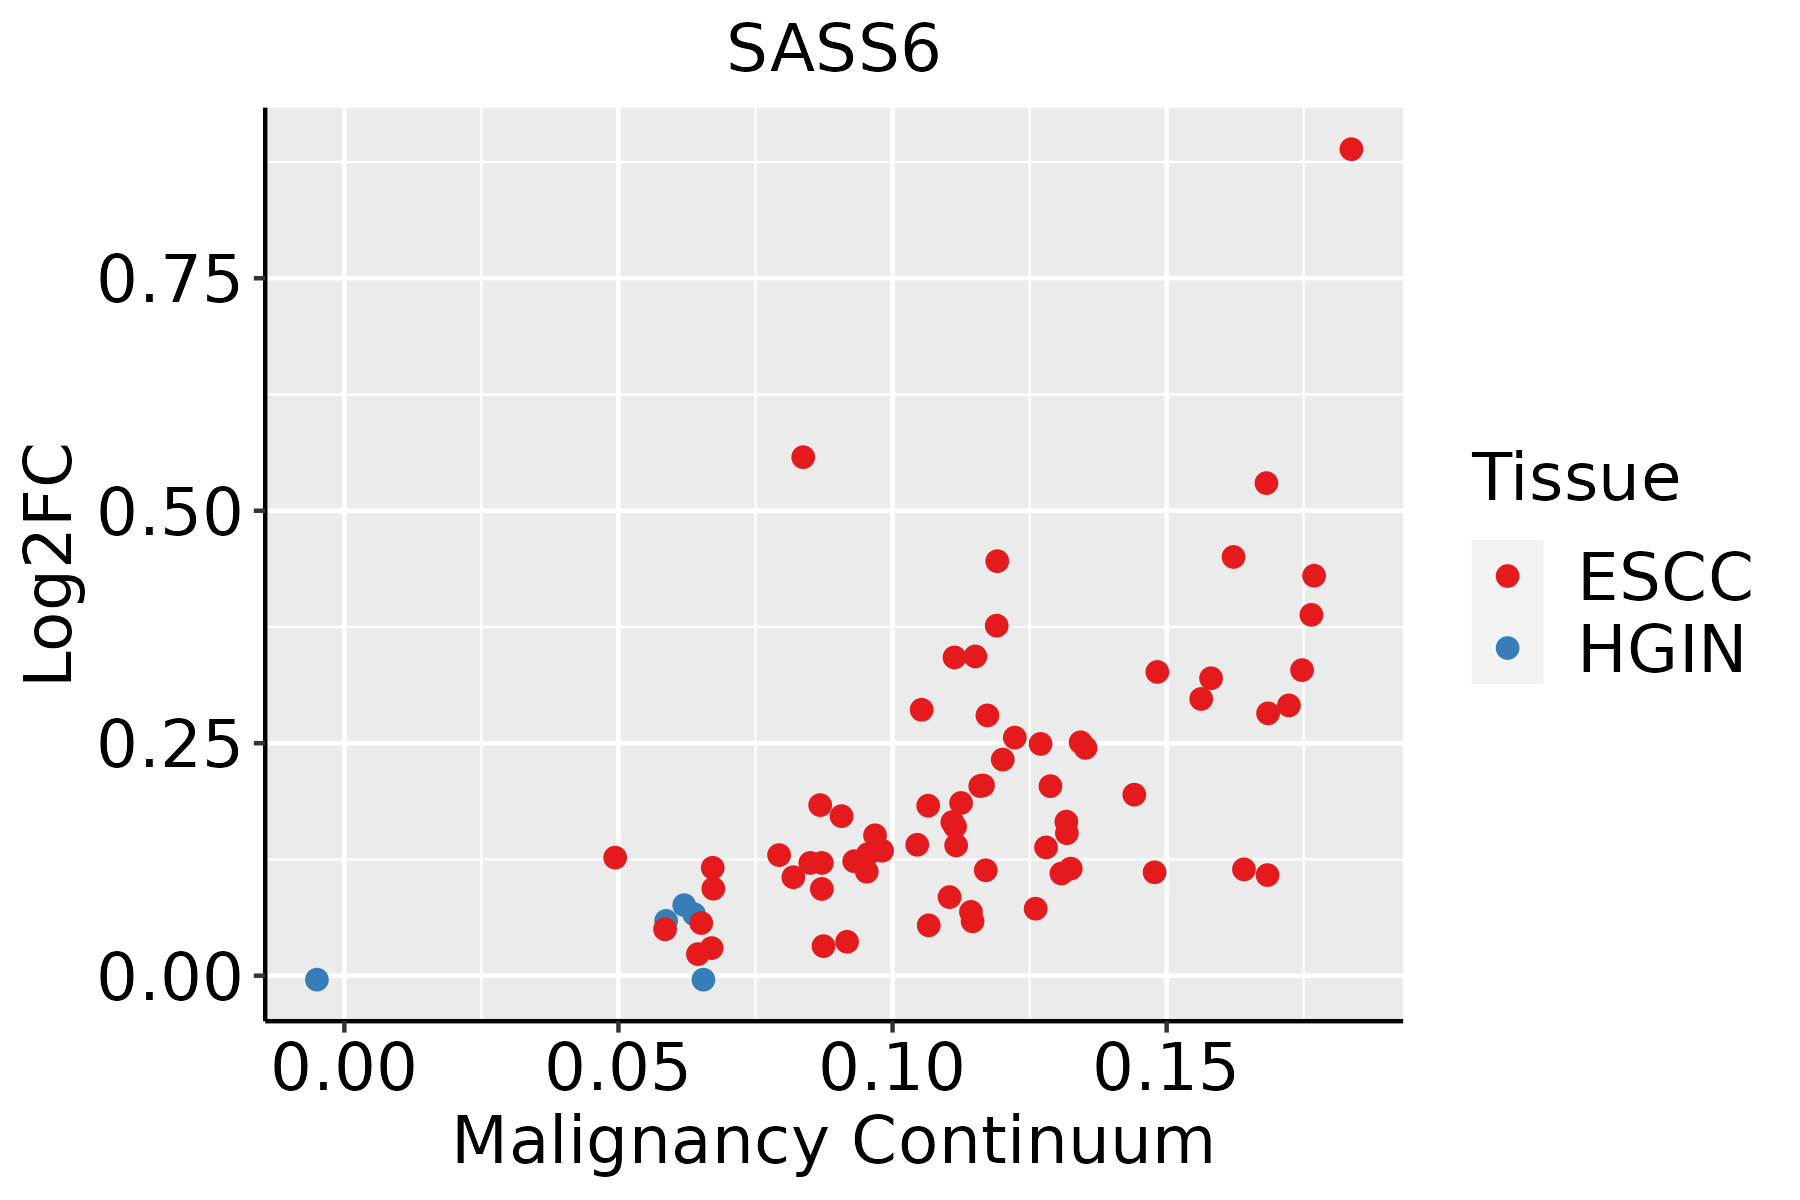 | ESCC: Esophageal squamous cell carcinoma |
| HGIN: High-grade intraepithelial neoplasias | ||
| LGIN: Low-grade intraepithelial neoplasias | ||
| Oral Cavity | 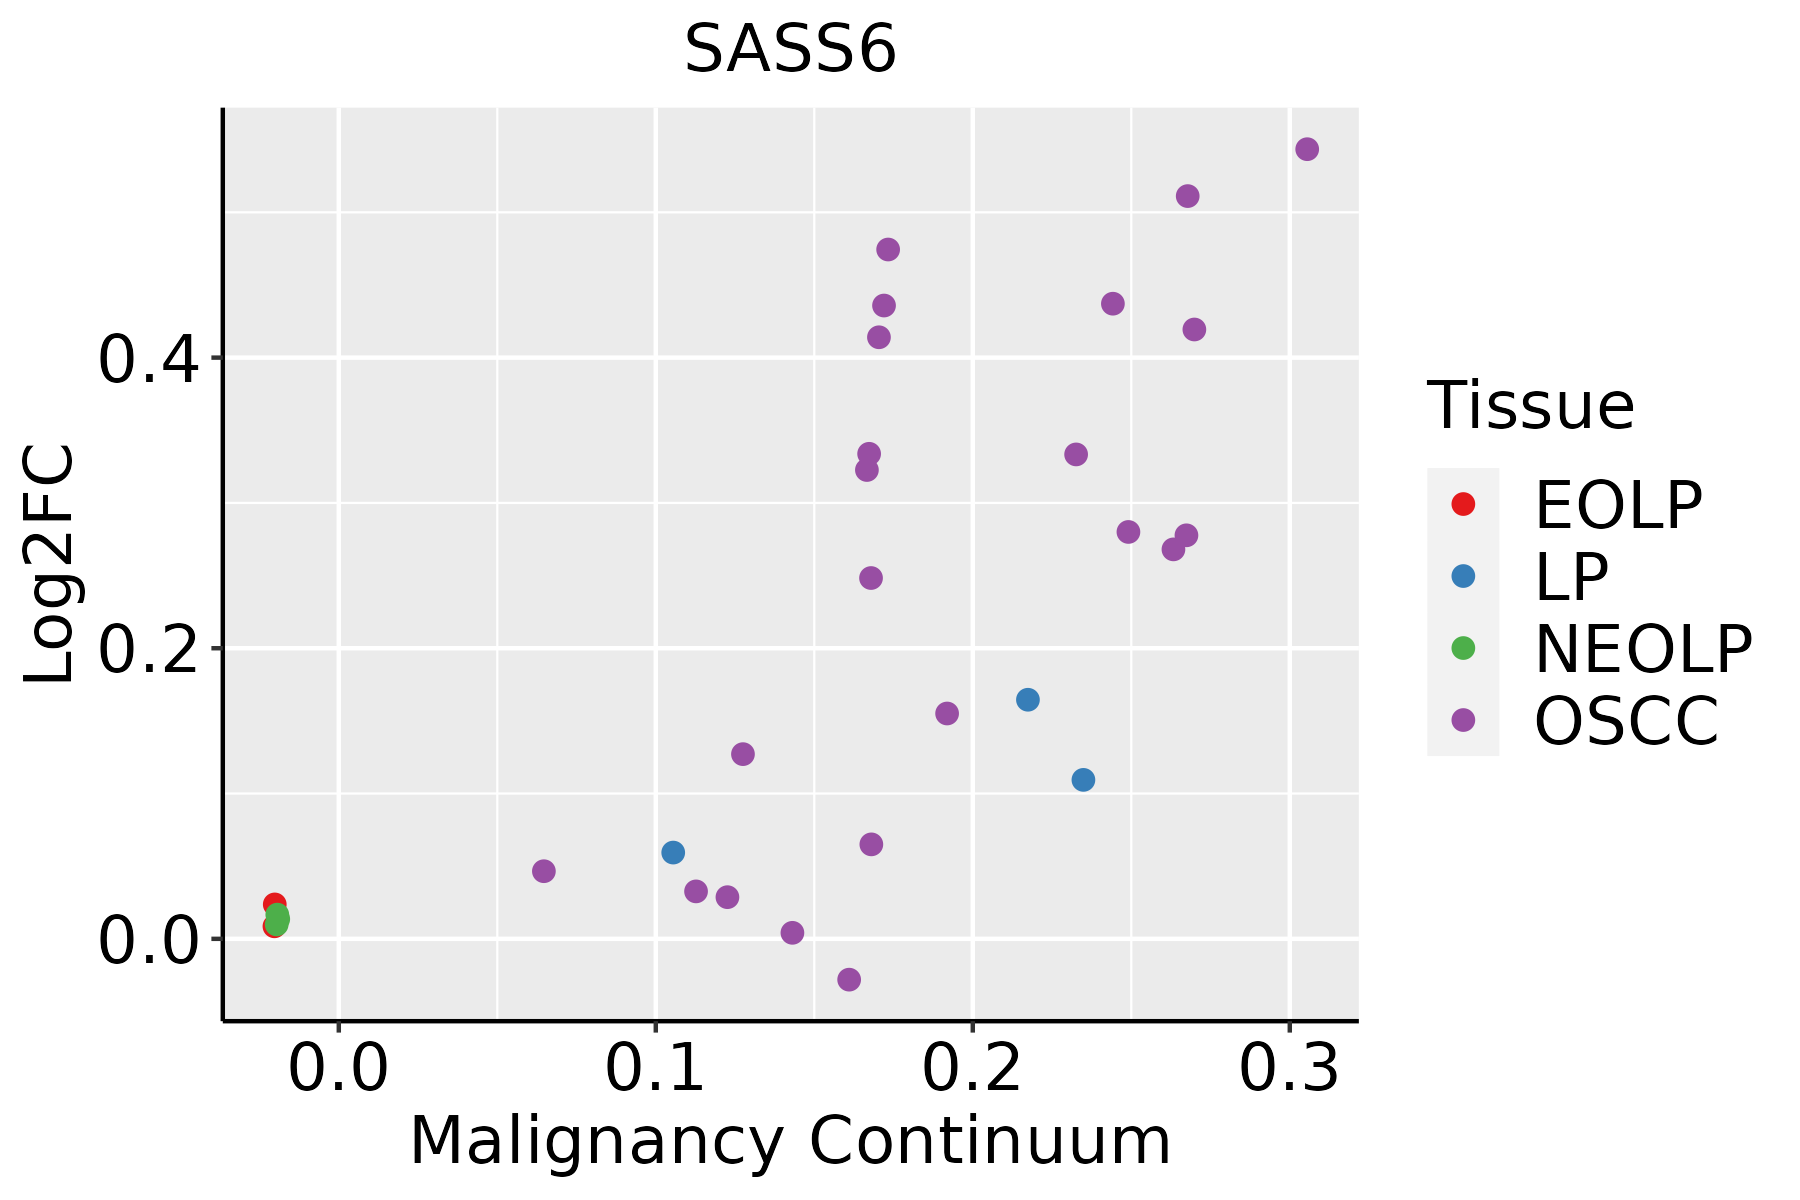 | EOLP: Erosive Oral lichen planus |
| LP: leukoplakia | ||
| NEOLP: Non-erosive oral lichen planus | ||
| OSCC: Oral squamous cell carcinoma |
| ∗log2FC in expression of this searched gene in stem-like cells from each diseased tissue sample relative to stem-like cells in normal samples in each tissue plotted against the malignancy continuum. Samples are colored based on if they are from different disease stage. |
Top |
Malignant transformation related pathway analysis |
| Find out the enriched GO biological processes and KEGG pathways involved in transition from healthy to precancer to cancer |
| Tissue | Disease Stage | Enriched GO biological Processes |
| Colorectum | AD |  |
| Colorectum | SER |  |
| Colorectum | MSS |  |
| Colorectum | MSI-H |  |
| Colorectum | FAP |  |
| ∗Top 15 enriched GO BP terms are showed in the bar plot of each disease state in each tissue. Each row represents a significant GO biological process which is colored according to the -log10(p.adjust). |
| Page: 1 2 3 4 5 6 7 8 9 |
| GO ID | Tissue | Disease Stage | Description | Gene Ratio | Bg Ratio | pvalue | p.adjust | Count |
| GO:00070982 | Esophagus | ESCC | centrosome cycle | 85/8552 | 130/18723 | 4.41e-06 | 4.69e-05 | 85 |
| GO:00310233 | Esophagus | ESCC | microtubule organizing center organization | 92/8552 | 143/18723 | 5.04e-06 | 5.31e-05 | 92 |
| GO:00070981 | Oral cavity | OSCC | centrosome cycle | 66/7305 | 130/18723 | 4.17e-03 | 1.70e-02 | 66 |
| GO:00310232 | Oral cavity | OSCC | microtubule organizing center organization | 70/7305 | 143/18723 | 9.71e-03 | 3.44e-02 | 70 |
| Page: 1 |
| Pathway ID | Tissue | Disease Stage | Description | Gene Ratio | Bg Ratio | pvalue | p.adjust | qvalue | Count |
| Page: 1 |
Top |
Cell-cell communication analysis |
| Identification of potential cell-cell interactions between two cell types and their ligand-receptor pairs for different disease states |
| Ligand | Receptor | LRpair | Pathway | Tissue | Disease Stage |
| Page: 1 |
Top |
Single-cell gene regulatory network inference analysis |
| Find out the significant the regulons (TFs) and the target genes of each regulon across cell types for different disease states |
| TF | Cell Type | Tissue | Disease Stage | Target Gene | RSS | Regulon Activity |
| ∗The dot plots of a searched regulon are shown for all cell subpopulations in each disease state of each tissue based on the regulon specific score inferred using pySCENIC and by calculating the average expression. |
| Page: 1 |
Top |
Somatic mutation of malignant transformation related genes |
| Annotation of somatic variants for genes involved in malignant transformation |
| Hugo Symbol | Variant Class | Variant Classification | dbSNP RS | HGVSc | HGVSp | HGVSp Short | SWISSPROT | BIOTYPE | SIFT | PolyPhen | Tumor Sample Barcode | Tissue | Histology | Sex | Age | Stage | Therapy Types | Drugs | Outcome |
| SASS6 | SNV | Missense_Mutation | c.1254N>T | p.Lys418Asn | p.K418N | Q6UVJ0 | protein_coding | deleterious(0.01) | possibly_damaging(0.798) | TCGA-B6-A1KN-01 | Breast | breast invasive carcinoma | Female | <65 | III/IV | Unknown | Unknown | SD | |
| SASS6 | SNV | Missense_Mutation | c.544N>G | p.Arg182Gly | p.R182G | Q6UVJ0 | protein_coding | deleterious(0) | benign(0.023) | TCGA-B6-A1KN-01 | Breast | breast invasive carcinoma | Female | <65 | III/IV | Unknown | Unknown | SD | |
| SASS6 | insertion | Frame_Shift_Ins | rs778258887 | c.567_568insA | p.Gln190ThrfsTer5 | p.Q190Tfs*5 | Q6UVJ0 | protein_coding | TCGA-AN-A0AK-01 | Breast | breast invasive carcinoma | Female | >=65 | I/II | Unknown | Unknown | SD | ||
| SASS6 | insertion | Nonsense_Mutation | novel | c.259_260insGATCCAATCACCTACCACAGG | p.Phe87delinsTer | p.F87delins* | Q6UVJ0 | protein_coding | TCGA-BH-A0AY-01 | Breast | breast invasive carcinoma | Female | <65 | I/II | Chemotherapy | SD | |||
| SASS6 | SNV | Missense_Mutation | c.457N>T | p.Leu153Phe | p.L153F | Q6UVJ0 | protein_coding | deleterious(0) | probably_damaging(0.999) | TCGA-IR-A3LA-01 | Cervix | cervical & endocervical cancer | Female | <65 | I/II | Chemotherapy | cisplatin | CR | |
| SASS6 | SNV | Missense_Mutation | novel | c.158A>T | p.Asp53Val | p.D53V | Q6UVJ0 | protein_coding | deleterious(0) | probably_damaging(1) | TCGA-VS-A9V4-01 | Cervix | cervical & endocervical cancer | Female | <65 | I/II | Chemotherapy | cisplatin | PD |
| SASS6 | deletion | Frame_Shift_Del | novel | c.567delA | p.Lys189AsnfsTer4 | p.K189Nfs*4 | Q6UVJ0 | protein_coding | TCGA-VS-A9U6-01 | Cervix | cervical & endocervical cancer | Female | <65 | I/II | Chemotherapy | cisplatin | PD | ||
| SASS6 | deletion | Frame_Shift_Del | rs763290832 | c.170delT | p.Leu57TyrfsTer14 | p.L57Yfs*14 | Q6UVJ0 | protein_coding | TCGA-VS-A9U6-01 | Cervix | cervical & endocervical cancer | Female | <65 | I/II | Chemotherapy | cisplatin | PD | ||
| SASS6 | SNV | Missense_Mutation | rs749784408 | c.1640C>T | p.Ala547Val | p.A547V | Q6UVJ0 | protein_coding | tolerated(0.41) | benign(0.067) | TCGA-A6-5661-01 | Colorectum | colon adenocarcinoma | Female | >=65 | I/II | Unknown | Unknown | SD |
| SASS6 | SNV | Missense_Mutation | rs374162430 | c.545G>A | p.Arg182Gln | p.R182Q | Q6UVJ0 | protein_coding | tolerated(1) | benign(0) | TCGA-AA-3510-01 | Colorectum | colon adenocarcinoma | Male | >=65 | I/II | Unknown | Unknown | SD |
| Page: 1 2 3 4 5 6 7 8 9 |
Top |
Related drugs of malignant transformation related genes |
| Identification of chemicals and drugs interact with genes involved in malignant transfromation |
| (DGIdb 4.0) |
| Entrez ID | Symbol | Category | Interaction Types | Drug Claim Name | Drug Name | PMIDs |
| Page: 1 |

Copyright 2023-Present -The University of Texas Health Science Center at Houston |