
|
|||||
|
 | |
| |
| |
| |
| |
| |
|
Gene: SASH1 |
Gene summary for SASH1 |
| Gene information | Species | Human | Gene symbol | SASH1 | Gene ID | 23328 |
| Gene name | SAM and SH3 domain containing 1 | |
| Gene Alias | CAPOK | |
| Cytomap | 6q24.3-q25.1 | |
| Gene Type | protein-coding | GO ID | GO:0000165 | UniProtAcc | O94885 |
Top |
Malignant transformation analysis |
| Identification of the aberrant gene expression in precancerous and cancerous lesions by comparing the gene expression of stem-like cells in diseased tissues with normal stem cells |
| Entrez ID | Symbol | Replicates | Species | Organ | Tissue | Adj P-value | Log2FC | Malignancy |
| 23328 | SASH1 | AEH-subject1 | Human | Endometrium | AEH | 8.18e-18 | 5.02e-01 | -0.3059 |
| 23328 | SASH1 | AEH-subject2 | Human | Endometrium | AEH | 9.53e-03 | 2.91e-01 | -0.2525 |
| 23328 | SASH1 | AEH-subject3 | Human | Endometrium | AEH | 3.10e-03 | 2.27e-01 | -0.2576 |
| 23328 | SASH1 | AEH-subject4 | Human | Endometrium | AEH | 2.44e-07 | 4.34e-01 | -0.2657 |
| 23328 | SASH1 | AEH-subject5 | Human | Endometrium | AEH | 4.69e-17 | 4.91e-01 | -0.2953 |
| 23328 | SASH1 | EEC-subject1 | Human | Endometrium | EEC | 2.89e-03 | 2.60e-01 | -0.2682 |
| 23328 | SASH1 | EEC-subject2 | Human | Endometrium | EEC | 2.51e-07 | 3.43e-01 | -0.2607 |
| 23328 | SASH1 | EEC-subject4 | Human | Endometrium | EEC | 1.33e-02 | 2.22e-01 | -0.2571 |
| 23328 | SASH1 | GSM6177620_NYU_UCEC1_lib1_lib1 | Human | Endometrium | EEC | 1.97e-02 | 1.94e-01 | -0.1869 |
| 23328 | SASH1 | GSM6177620_NYU_UCEC1_lib2_lib2 | Human | Endometrium | EEC | 2.29e-03 | 1.97e-01 | -0.1875 |
| 23328 | SASH1 | GSM6177620_NYU_UCEC1_lib3_lib3 | Human | Endometrium | EEC | 2.09e-02 | 9.95e-02 | -0.1883 |
| 23328 | SASH1 | GSM6177622_NYU_UCEC3_lib1_lib1 | Human | Endometrium | EEC | 8.90e-06 | 2.28e-01 | -0.1917 |
| 23328 | SASH1 | GSM6177622_NYU_UCEC3_lib2_lib2 | Human | Endometrium | EEC | 1.35e-05 | 2.64e-01 | -0.1916 |
| 23328 | SASH1 | RNA-P25T1-P25T1-1 | Human | Lung | AIS | 1.37e-07 | 5.22e-01 | -0.2116 |
| 23328 | SASH1 | RNA-P25T1-P25T1-4 | Human | Lung | AIS | 4.31e-04 | 3.83e-01 | -0.2119 |
| 23328 | SASH1 | RNA-P6T1-P6T1-1 | Human | Lung | MIAC | 6.82e-03 | 8.35e-01 | -0.0238 |
| 23328 | SASH1 | RNA-P6T1-P6T1-3 | Human | Lung | MIAC | 9.01e-06 | 9.65e-01 | -0.0296 |
| 23328 | SASH1 | RNA-P6T1-P6T1-4 | Human | Lung | MIAC | 2.91e-04 | 7.39e-01 | -0.0263 |
| 23328 | SASH1 | RNA-P6T2-P6T2-1 | Human | Lung | IAC | 7.62e-09 | 3.55e-01 | -0.0166 |
| 23328 | SASH1 | RNA-P6T2-P6T2-2 | Human | Lung | IAC | 2.66e-06 | 3.34e-01 | -0.0132 |
| Page: 1 2 3 |
| Tissue | Expression Dynamics | Abbreviation |
| Endometrium |  | AEH: Atypical endometrial hyperplasia |
| EEC: Endometrioid Cancer | ||
| Lung | 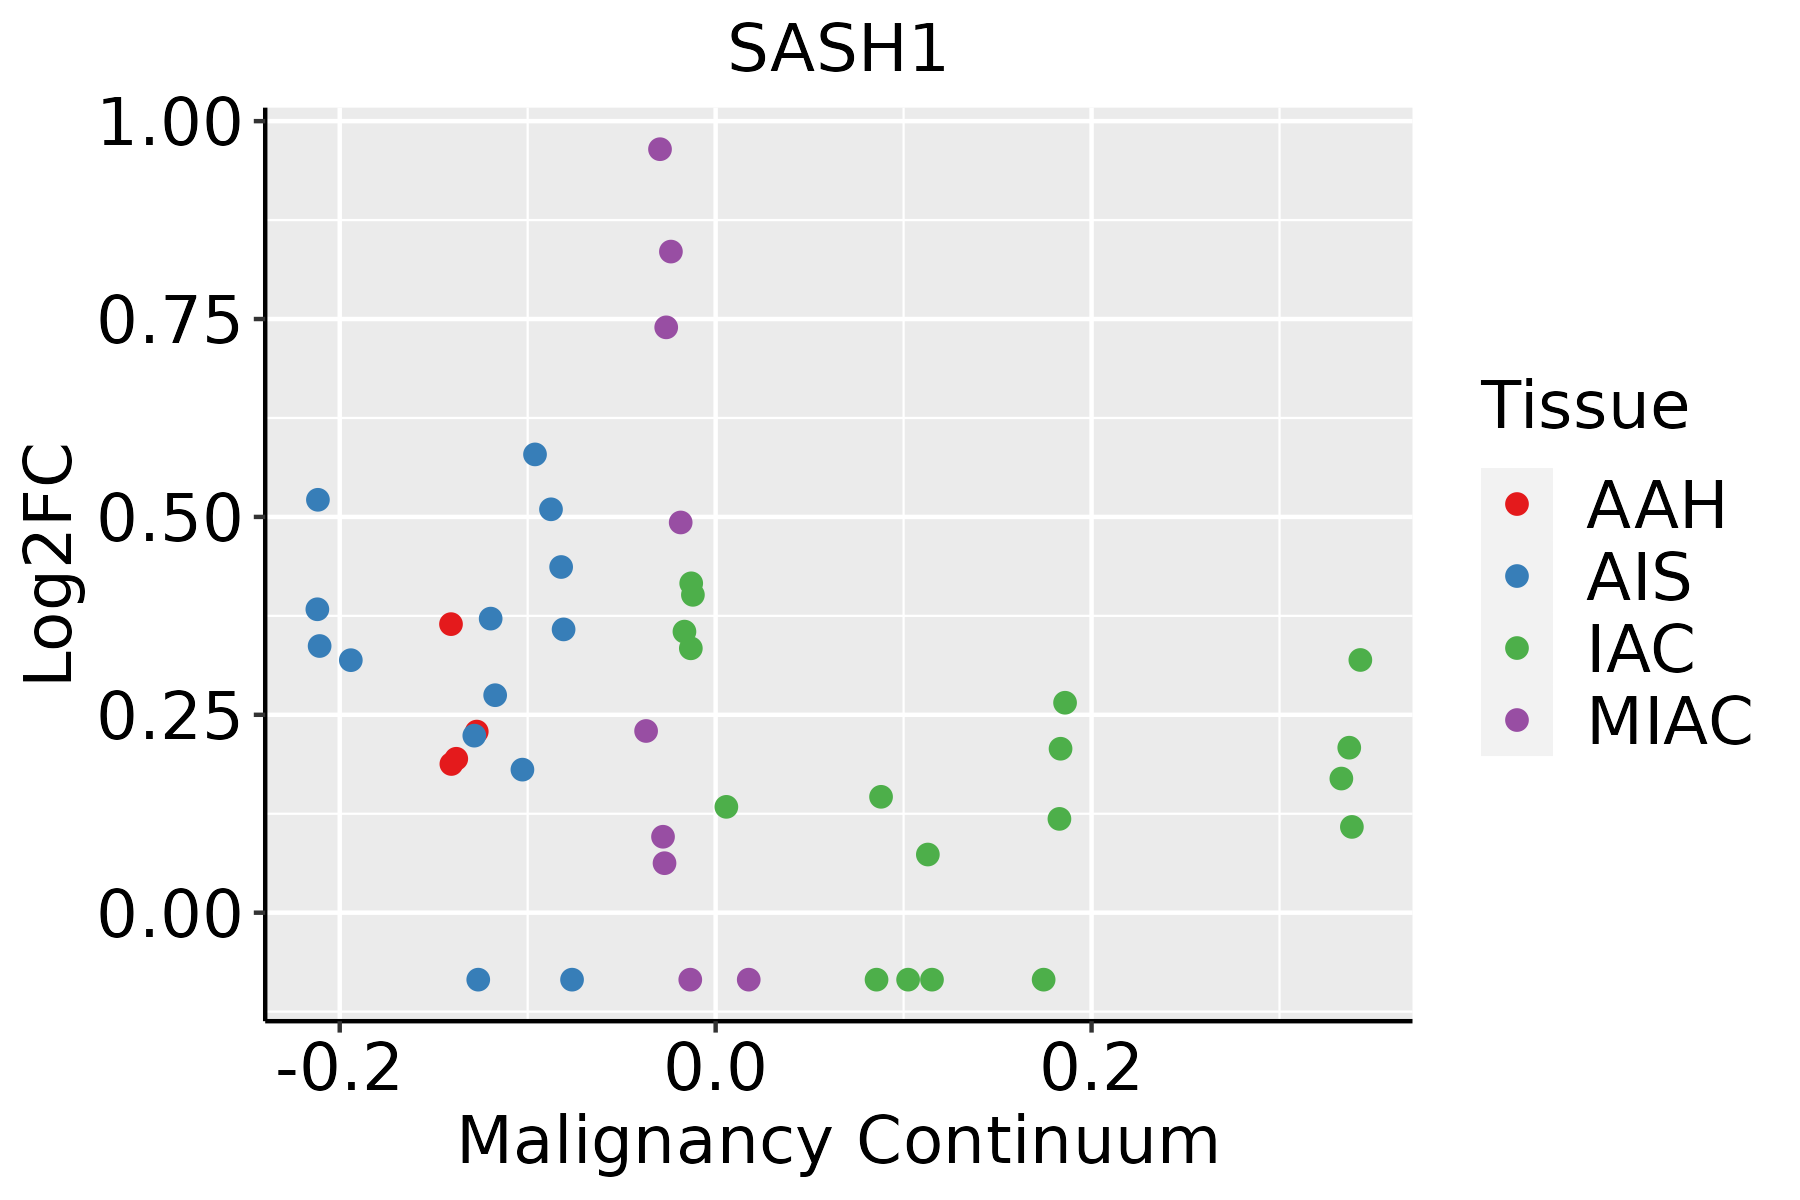 | AAH: Atypical adenomatous hyperplasia |
| AIS: Adenocarcinoma in situ | ||
| IAC: Invasive lung adenocarcinoma | ||
| MIA: Minimally invasive adenocarcinoma | ||
| Thyroid |  | ATC: Anaplastic thyroid cancer |
| HT: Hashimoto's thyroiditis | ||
| PTC: Papillary thyroid cancer |
| ∗log2FC in expression of this searched gene in stem-like cells from each diseased tissue sample relative to stem-like cells in normal samples in each tissue plotted against the malignancy continuum. Samples are colored based on if they are from different disease stage. |
Top |
Malignant transformation related pathway analysis |
| Find out the enriched GO biological processes and KEGG pathways involved in transition from healthy to precancer to cancer |
| Tissue | Disease Stage | Enriched GO biological Processes |
| Colorectum | AD |  |
| Colorectum | SER |  |
| Colorectum | MSS |  |
| Colorectum | MSI-H |  |
| Colorectum | FAP |  |
| ∗Top 15 enriched GO BP terms are showed in the bar plot of each disease state in each tissue. Each row represents a significant GO biological process which is colored according to the -log10(p.adjust). |
| Page: 1 2 3 4 5 6 7 8 9 |
| GO ID | Tissue | Disease Stage | Description | Gene Ratio | Bg Ratio | pvalue | p.adjust | Count |
| GO:190332016 | Endometrium | AEH | regulation of protein modification by small protein conjugation or removal | 67/2100 | 242/18723 | 1.10e-12 | 2.26e-10 | 67 |
| GO:003139616 | Endometrium | AEH | regulation of protein ubiquitination | 57/2100 | 210/18723 | 1.24e-10 | 1.40e-08 | 57 |
| GO:000166710 | Endometrium | AEH | ameboidal-type cell migration | 90/2100 | 475/18723 | 3.73e-07 | 1.57e-05 | 90 |
| GO:009013014 | Endometrium | AEH | tissue migration | 73/2100 | 365/18723 | 5.79e-07 | 2.20e-05 | 73 |
| GO:009013214 | Endometrium | AEH | epithelium migration | 72/2100 | 360/18723 | 6.90e-07 | 2.55e-05 | 72 |
| GO:001063114 | Endometrium | AEH | epithelial cell migration | 71/2100 | 357/18723 | 1.02e-06 | 3.52e-05 | 71 |
| GO:001063214 | Endometrium | AEH | regulation of epithelial cell migration | 60/2100 | 292/18723 | 2.31e-06 | 6.77e-05 | 60 |
| GO:001063410 | Endometrium | AEH | positive regulation of epithelial cell migration | 41/2100 | 176/18723 | 3.79e-06 | 1.01e-04 | 41 |
| GO:00514039 | Endometrium | AEH | stress-activated MAPK cascade | 50/2100 | 239/18723 | 9.33e-06 | 2.18e-04 | 50 |
| GO:00310989 | Endometrium | AEH | stress-activated protein kinase signaling cascade | 51/2100 | 247/18723 | 1.12e-05 | 2.52e-04 | 51 |
| GO:00328728 | Endometrium | AEH | regulation of stress-activated MAPK cascade | 42/2100 | 192/18723 | 1.53e-05 | 3.23e-04 | 42 |
| GO:00380665 | Endometrium | AEH | p38MAPK cascade | 18/2100 | 55/18723 | 1.77e-05 | 3.65e-04 | 18 |
| GO:00435428 | Endometrium | AEH | endothelial cell migration | 55/2100 | 279/18723 | 2.11e-05 | 4.15e-04 | 55 |
| GO:00105955 | Endometrium | AEH | positive regulation of endothelial cell migration | 32/2100 | 133/18723 | 2.12e-05 | 4.15e-04 | 32 |
| GO:00434105 | Endometrium | AEH | positive regulation of MAPK cascade | 84/2100 | 480/18723 | 2.19e-05 | 4.25e-04 | 84 |
| GO:00703028 | Endometrium | AEH | regulation of stress-activated protein kinase signaling cascade | 42/2100 | 195/18723 | 2.27e-05 | 4.35e-04 | 42 |
| GO:00105945 | Endometrium | AEH | regulation of endothelial cell migration | 47/2100 | 232/18723 | 4.02e-05 | 6.91e-04 | 47 |
| GO:000223710 | Endometrium | AEH | response to molecule of bacterial origin | 65/2100 | 363/18723 | 9.00e-05 | 1.30e-03 | 65 |
| GO:003249610 | Endometrium | AEH | response to lipopolysaccharide | 62/2100 | 343/18723 | 9.82e-05 | 1.41e-03 | 62 |
| GO:19007443 | Endometrium | AEH | regulation of p38MAPK cascade | 15/2100 | 47/18723 | 1.21e-04 | 1.67e-03 | 15 |
| Page: 1 2 3 4 5 6 7 8 9 10 11 12 |
| Pathway ID | Tissue | Disease Stage | Description | Gene Ratio | Bg Ratio | pvalue | p.adjust | qvalue | Count |
| Page: 1 |
Top |
Cell-cell communication analysis |
| Identification of potential cell-cell interactions between two cell types and their ligand-receptor pairs for different disease states |
| Ligand | Receptor | LRpair | Pathway | Tissue | Disease Stage |
| Page: 1 |
Top |
Single-cell gene regulatory network inference analysis |
| Find out the significant the regulons (TFs) and the target genes of each regulon across cell types for different disease states |
| TF | Cell Type | Tissue | Disease Stage | Target Gene | RSS | Regulon Activity |
| ∗The dot plots of a searched regulon are shown for all cell subpopulations in each disease state of each tissue based on the regulon specific score inferred using pySCENIC and by calculating the average expression. |
| Page: 1 |
Top |
Somatic mutation of malignant transformation related genes |
| Annotation of somatic variants for genes involved in malignant transformation |
| Hugo Symbol | Variant Class | Variant Classification | dbSNP RS | HGVSc | HGVSp | HGVSp Short | SWISSPROT | BIOTYPE | SIFT | PolyPhen | Tumor Sample Barcode | Tissue | Histology | Sex | Age | Stage | Therapy Types | Drugs | Outcome |
| SASH1 | SNV | Missense_Mutation | c.2098N>T | p.Asn700Tyr | p.N700Y | O94885 | protein_coding | deleterious(0) | probably_damaging(0.983) | TCGA-A1-A0SO-01 | Breast | breast invasive carcinoma | Female | >=65 | I/II | Chemotherapy | SD | ||
| SASH1 | SNV | Missense_Mutation | rs771773054 | c.2579N>T | p.Pro860Leu | p.P860L | O94885 | protein_coding | deleterious_low_confidence(0.01) | benign(0.012) | TCGA-A8-A076-01 | Breast | breast invasive carcinoma | Female | >=65 | I/II | Hormone Therapy | anastrozole | SD |
| SASH1 | SNV | Missense_Mutation | rs587781245 | c.1849G>A | p.Glu617Lys | p.E617K | O94885 | protein_coding | deleterious(0.02) | benign(0.085) | TCGA-AN-A046-01 | Breast | breast invasive carcinoma | Female | >=65 | I/II | Unknown | Unknown | SD |
| SASH1 | SNV | Missense_Mutation | novel | c.2696G>T | p.Arg899Ile | p.R899I | O94885 | protein_coding | deleterious_low_confidence(0.01) | benign(0) | TCGA-AN-A046-01 | Breast | breast invasive carcinoma | Female | >=65 | I/II | Unknown | Unknown | SD |
| SASH1 | SNV | Missense_Mutation | novel | c.2467N>A | p.Glu823Lys | p.E823K | O94885 | protein_coding | deleterious_low_confidence(0) | probably_damaging(0.994) | TCGA-D8-A27V-01 | Breast | breast invasive carcinoma | Female | <65 | I/II | Hormone Therapy | tamoxiphen | SD |
| SASH1 | SNV | Missense_Mutation | rs569499786 | c.1013N>T | p.Ser338Phe | p.S338F | O94885 | protein_coding | tolerated_low_confidence(0.08) | benign(0.024) | TCGA-D8-A4Z1-01 | Breast | breast invasive carcinoma | Female | >=65 | I/II | Hormone Therapy | tamoxiphen | SD |
| SASH1 | SNV | Missense_Mutation | novel | c.1627N>T | p.Asp543Tyr | p.D543Y | O94885 | protein_coding | deleterious(0) | probably_damaging(1) | TCGA-E2-A14X-01 | Breast | breast invasive carcinoma | Female | <65 | III/IV | Chemotherapy | doxorubicin | SD |
| SASH1 | SNV | Missense_Mutation | rs534390155 | c.1535G>A | p.Arg512His | p.R512H | O94885 | protein_coding | deleterious(0.03) | probably_damaging(0.999) | TCGA-E2-A1B0-01 | Breast | breast invasive carcinoma | Female | <65 | III/IV | Chemotherapy | cytoxan | SD |
| SASH1 | SNV | Missense_Mutation | novel | c.3675G>C | p.Glu1225Asp | p.E1225D | O94885 | protein_coding | deleterious_low_confidence(0.01) | probably_damaging(0.952) | TCGA-OL-A6VQ-01 | Breast | breast invasive carcinoma | Female | <65 | I/II | Unknown | Unknown | SD |
| SASH1 | SNV | Missense_Mutation | novel | c.115G>A | p.Glu39Lys | p.E39K | O94885 | protein_coding | deleterious_low_confidence(0.04) | benign(0.001) | TCGA-PE-A5DE-01 | Breast | breast invasive carcinoma | Female | <65 | I/II | Chemotherapy | taxotere | CR |
| Page: 1 2 3 4 5 6 7 8 9 10 11 12 13 14 15 16 |
Top |
Related drugs of malignant transformation related genes |
| Identification of chemicals and drugs interact with genes involved in malignant transfromation |
| (DGIdb 4.0) |
| Entrez ID | Symbol | Category | Interaction Types | Drug Claim Name | Drug Name | PMIDs |
| Page: 1 |

Copyright 2023-Present -The University of Texas Health Science Center at Houston |