Schematic overview of the cellular and molecular mechanisms involved in the cancer progression, including the proposed cellular and molecular mechanisms in cancer cells trajectory. AT1: alveolar type 1 cells; AT2: alveolar type 2 cells; AAH: atypical adenomatous hyperplasia; AIS: adenocarcinoma in situ; MIA: minimally invasive adenocarcinoma; IA: invasive adenocarcinoma; EMT: epithelial-mesenchymal transition

Home

Download

Statistics

Help

Contact

Center for Computational Systems Medicine
leaf

Gene summary

leaf

Malignant transformation analysis

leaf

Malignant transformation related pathway analysis

leaf

Cell-cell communication analysis

leaf

Single-cell gene regulatory network inference analysis

leaf

Somatic mutation of malignant transformation related genes

leaf

Related drugs of malignant transformation related genes

Gene: SART3

Gene summary for SART3

check button Gene summary.

Gene informationSpeciesHuman
Gene symbol

SART3

Gene ID

9733

Gene namespliceosome associated factor 3, U4/U6 recycling protein
Gene AliasDSAP1
Cytomap12q23.3
Gene Typeprotein-coding
GO ID

GO:0000244

UniProtAcc

Q15020


Top

Malignant transformation analysis

check button Identification of the aberrant gene expression in precancerous and cancerous lesions by comparing the gene expression of stem-like cells in diseased tissues with normal stem cells
check button Malignant transformation involving gene list.
Entrez IDSymbolReplicatesSpeciesOrganTissueAdj P-valueLog2FCMalignancy
9733SART3LZE2THumanEsophagusESCC6.99e-043.54e-010.082
9733SART3LZE4THumanEsophagusESCC1.19e-122.84e-010.0811
9733SART3LZE7THumanEsophagusESCC1.05e-063.70e-010.0667
9733SART3LZE24THumanEsophagusESCC3.94e-112.81e-010.0596
9733SART3LZE21THumanEsophagusESCC5.66e-032.39e-010.0655
9733SART3LZE6THumanEsophagusESCC3.85e-042.20e-010.0845
9733SART3P1T-EHumanEsophagusESCC6.63e-032.34e-010.0875
9733SART3P2T-EHumanEsophagusESCC2.01e-417.64e-010.1177
9733SART3P4T-EHumanEsophagusESCC8.28e-153.82e-010.1323
9733SART3P5T-EHumanEsophagusESCC8.25e-091.82e-010.1327
9733SART3P8T-EHumanEsophagusESCC1.99e-122.75e-010.0889
9733SART3P9T-EHumanEsophagusESCC4.03e-081.08e-010.1131
9733SART3P10T-EHumanEsophagusESCC4.86e-142.79e-010.116
9733SART3P11T-EHumanEsophagusESCC1.52e-154.89e-010.1426
9733SART3P12T-EHumanEsophagusESCC1.94e-203.02e-010.1122
9733SART3P15T-EHumanEsophagusESCC1.25e-144.24e-010.1149
9733SART3P16T-EHumanEsophagusESCC3.32e-254.68e-010.1153
9733SART3P17T-EHumanEsophagusESCC6.69e-042.39e-010.1278
9733SART3P20T-EHumanEsophagusESCC8.28e-224.02e-010.1124
9733SART3P21T-EHumanEsophagusESCC3.48e-214.54e-010.1617
Page: 1 2 3 4 5 

check button Transcriptomic changes along malignancy continuum.
TissueExpression DynamicsAbbreviation
EsophagusThe image shows the transcriptomic changes along malignancy continuum.log2FC in expression of this searched gene in stem-like cells from each diseased tissue sample relative to stem-like cells in normal samples in each tissue plotted against the malignancy continuum. Samples are colored based on if they are from different disease stage.ESCC: Esophageal squamous cell carcinoma
HGIN: High-grade intraepithelial neoplasias
LGIN: Low-grade intraepithelial neoplasias
LiverThe image shows the transcriptomic changes along malignancy continuum.log2FC in expression of this searched gene in stem-like cells from each diseased tissue sample relative to stem-like cells in normal samples in each tissue plotted against the malignancy continuum. Samples are colored based on if they are from different disease stage.
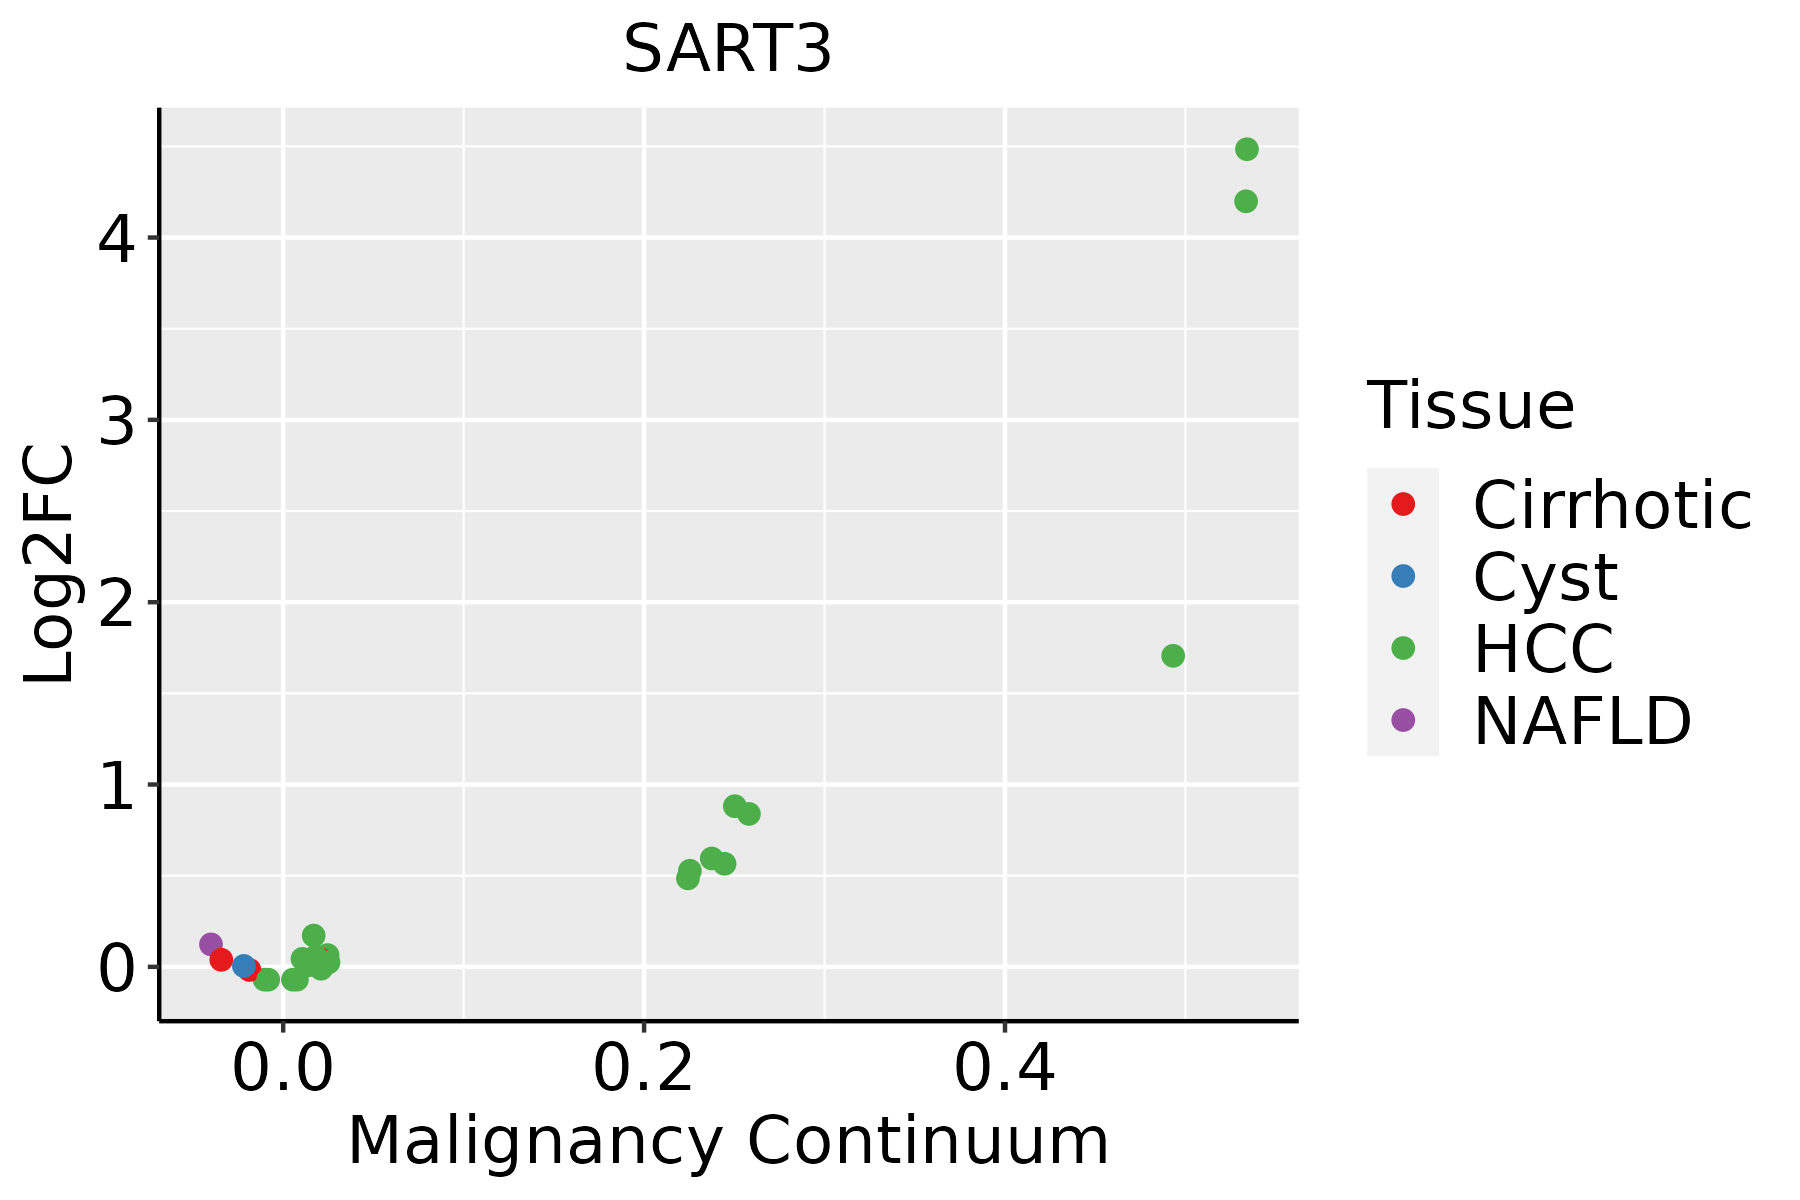
HCC: Hepatocellular carcinoma
NAFLD: Non-alcoholic fatty liver disease
Oral CavityThe image shows the transcriptomic changes along malignancy continuum.log2FC in expression of this searched gene in stem-like cells from each diseased tissue sample relative to stem-like cells in normal samples in each tissue plotted against the malignancy continuum. Samples are colored based on if they are from different disease stage.
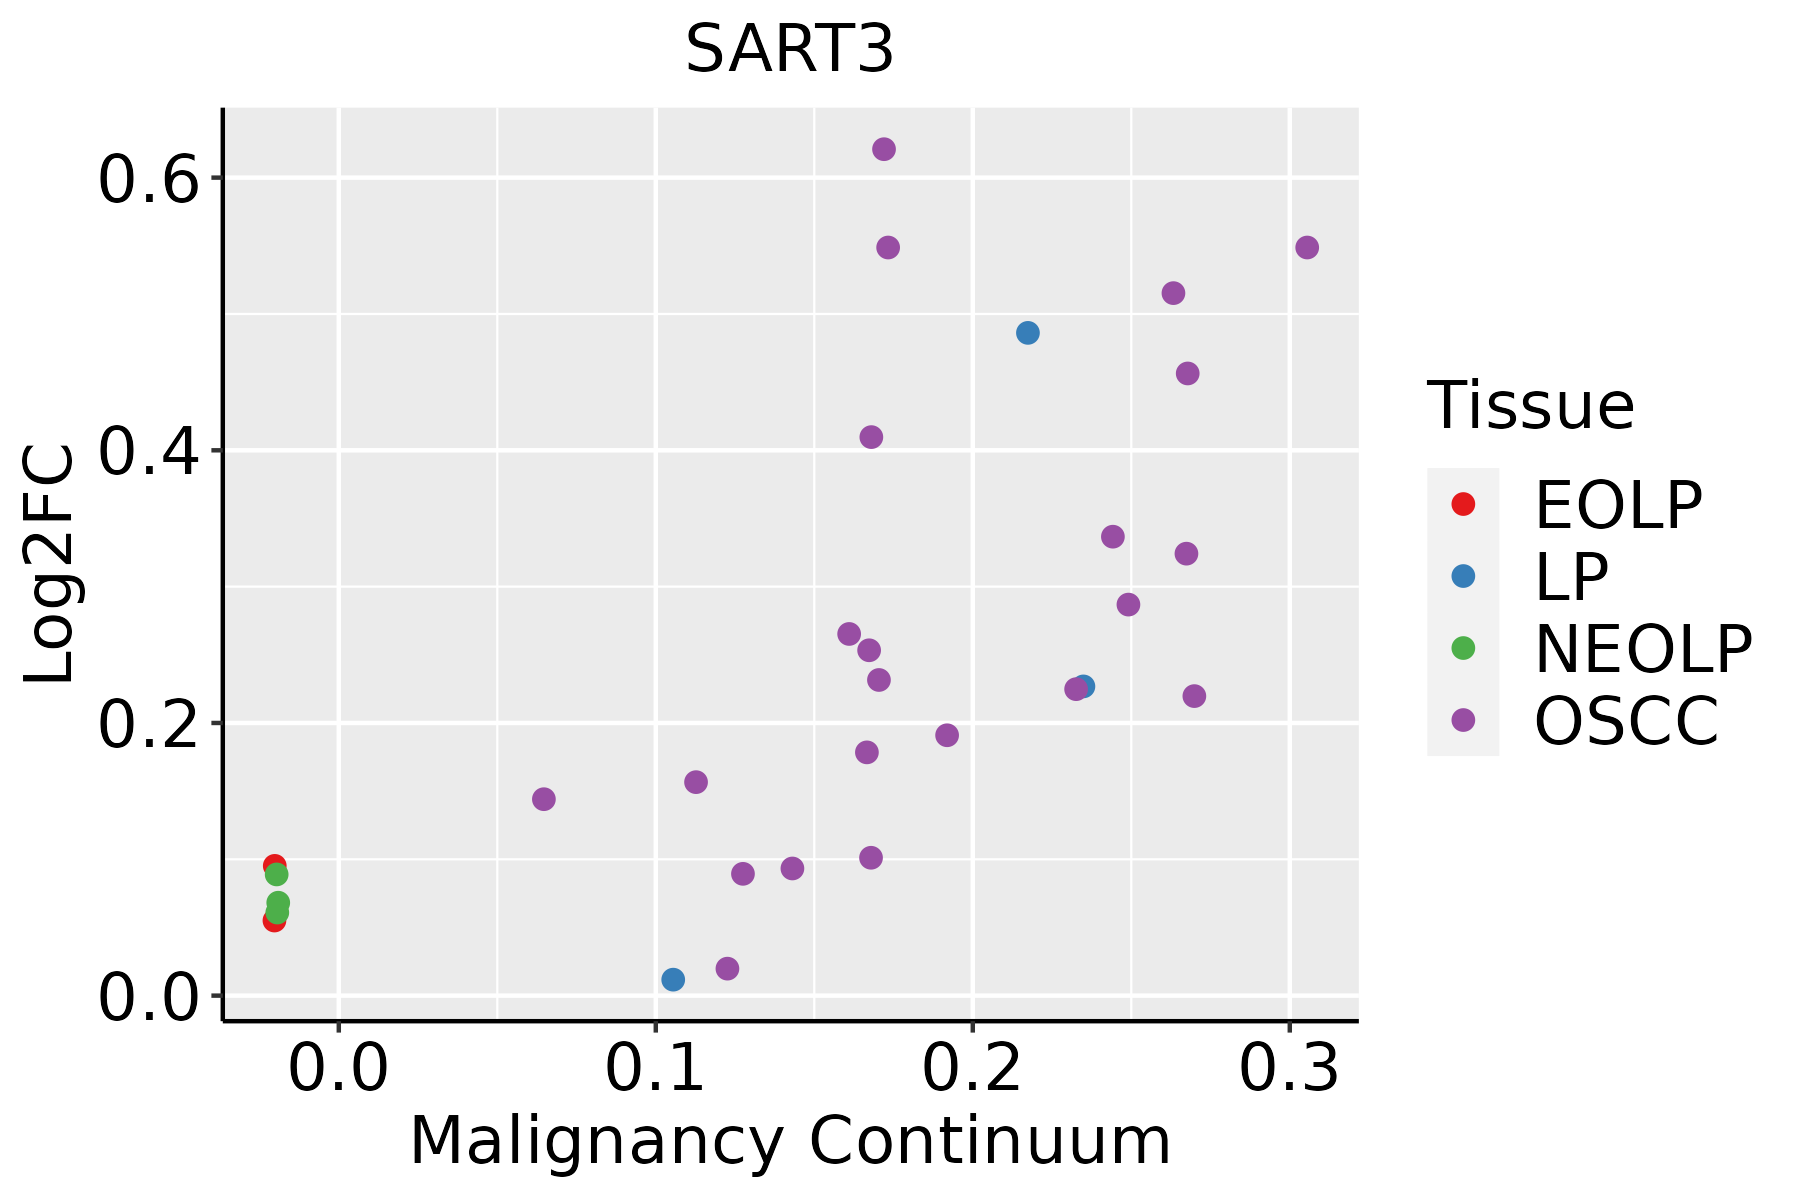
EOLP: Erosive Oral lichen planus
LP: leukoplakia
NEOLP: Non-erosive oral lichen planus
OSCC: Oral squamous cell carcinoma
ProstateThe image shows the transcriptomic changes along malignancy continuum.log2FC in expression of this searched gene in stem-like cells from each diseased tissue sample relative to stem-like cells in normal samples in each tissue plotted against the malignancy continuum. Samples are colored based on if they are from different disease stage.BPH: Benign Prostatic Hyperplasia
∗log2FC in expression of this searched gene in stem-like cells from each diseased tissue sample relative to stem-like cells in normal samples in each tissue plotted against the malignancy continuum. Samples are colored based on if they are from different disease stage.

Top

Malignant transformation related pathway analysis

check buttonFind out the enriched GO biological processes and KEGG pathways involved in transition from healthy to precancer to cancer
check button Figure of enriched GO biological processes.
TissueDisease StageEnriched GO biological Processes
ColorectumADGO analysis - Figure of enriched GO biological processes: Top 15 enriched GO BP terms are showed in the bar plot of each disease state in each tissue. Each row represents a significant GO biological process which is colored according to the -log10(p.adjust).
ColorectumSERGO analysis - Figure of enriched GO biological processes: Top 15 enriched GO BP terms are showed in the bar plot of each disease state in each tissue. Each row represents a significant GO biological process which is colored according to the -log10(p.adjust).
ColorectumMSSGO analysis - Figure of enriched GO biological processes: Top 15 enriched GO BP terms are showed in the bar plot of each disease state in each tissue. Each row represents a significant GO biological process which is colored according to the -log10(p.adjust).
ColorectumMSI-HGO analysis - Figure of enriched GO biological processes: Top 15 enriched GO BP terms are showed in the bar plot of each disease state in each tissue. Each row represents a significant GO biological process which is colored according to the -log10(p.adjust).
ColorectumFAPGO analysis - Figure of enriched GO biological processes: Top 15 enriched GO BP terms are showed in the bar plot of each disease state in each tissue. Each row represents a significant GO biological process which is colored according to the -log10(p.adjust).
∗Top 15 enriched GO BP terms are showed in the bar plot of each disease state in each tissue. Each row represents a significant GO biological process which is colored according to the -log10(p.adjust).
Page: 1 2 3 4 5 6 7 8 9 

check button Enriched GO biological processes.
GO IDTissueDisease StageDescriptionGene RatioBg Ratiopvaluep.adjustCount
GO:0022613111EsophagusESCCribonucleoprotein complex biogenesis365/8552463/187231.74e-491.11e-45365
GO:0008380111EsophagusESCCRNA splicing336/8552434/187231.74e-423.67e-39336
GO:0000375111EsophagusESCCRNA splicing, via transesterification reactions248/8552324/187233.05e-301.49e-27248
GO:0000377111EsophagusESCCRNA splicing, via transesterification reactions with bulged adenosine as nucleophile244/8552320/187232.52e-291.07e-26244
GO:0000398111EsophagusESCCmRNA splicing, via spliceosome244/8552320/187232.52e-291.07e-26244
GO:001657015EsophagusESCChistone modification323/8552463/187232.61e-267.88e-24323
GO:1903320111EsophagusESCCregulation of protein modification by small protein conjugation or removal181/8552242/187231.80e-202.60e-18181
GO:0045862111EsophagusESCCpositive regulation of proteolysis256/8552372/187237.88e-209.43e-18256
GO:0071826111EsophagusESCCribonucleoprotein complex subunit organization166/8552227/187232.94e-172.42e-15166
GO:0022618111EsophagusESCCribonucleoprotein complex assembly159/8552220/187238.19e-165.71e-14159
GO:190332216EsophagusESCCpositive regulation of protein modification by small protein conjugation or removal99/8552138/187234.39e-101.16e-0899
GO:003105614EsophagusESCCregulation of histone modification106/8552152/187231.52e-093.55e-08106
GO:000632517EsophagusESCCchromatin organization240/8552409/187236.52e-081.14e-06240
GO:00310583EsophagusESCCpositive regulation of histone modification65/855292/187231.04e-061.31e-0565
GO:0048872111EsophagusESCChomeostasis of number of cells163/8552272/187231.40e-061.69e-05163
GO:007064612EsophagusESCCprotein modification by small protein removal95/8552157/187231.25e-048.56e-0495
GO:009008515EsophagusESCCregulation of protein deubiquitination11/855212/187231.26e-036.06e-0311
GO:00165783EsophagusESCChistone deubiquitination18/855223/187231.50e-037.06e-0318
GO:00165793EsophagusESCCprotein deubiquitination79/8552139/187235.23e-031.97e-0279
GO:00003875EsophagusESCCspliceosomal snRNP assembly32/855250/187236.90e-032.52e-0232
Page: 1 2 3 4 5 6 

check button Enriched KEGG pathways.
Pathway IDTissueDisease StageDescriptionGene RatioBg Ratiopvaluep.adjustqvalueCount
Page: 1 

Top

Cell-cell communication analysis

check buttonIdentification of potential cell-cell interactions between two cell types and their ligand-receptor pairs for different disease states
LigandReceptorLRpairPathwayTissueDisease Stage
Page: 1 

Top

Single-cell gene regulatory network inference analysis

check buttonFind out the significant the regulons (TFs) and the target genes of each regulon across cell types for different disease states
TFCell TypeTissueDisease StageTarget GeneRSSRegulon Activity
∗The dot plots of a searched regulon are shown for all cell subpopulations in each disease state of each tissue based on the regulon specific score inferred using pySCENIC and by calculating the average expression.
Page: 1 

Top

Somatic mutation of malignant transformation related genes

check buttonAnnotation of somatic variants for genes involved in malignant transformation
Hugo SymbolVariant ClassVariant ClassificationdbSNP RSHGVScHGVSpHGVSp ShortSWISSPROTBIOTYPESIFTPolyPhenTumor Sample BarcodeTissueHistologySexAgeStageTherapy TypesDrugsOutcome
SART3SNVMissense_Mutationc.2214N>Gp.Ile738Metp.I738MQ15020protein_codingdeleterious(0)possibly_damaging(0.839)TCGA-A2-A0CX-01Breastbreast invasive carcinomaFemale<65I/IIChemotherapyadriamycinSD
SART3SNVMissense_Mutationc.2114N>Tp.Thr705Ilep.T705IQ15020protein_codingdeleterious(0)possibly_damaging(0.701)TCGA-A2-A25E-01Breastbreast invasive carcinomaFemale<65III/IVChemotherapycytoxanPD
SART3SNVMissense_Mutationc.1739N>Tp.Arg580Ilep.R580IQ15020protein_codingdeleterious(0)probably_damaging(0.999)TCGA-AN-A046-01Breastbreast invasive carcinomaFemale>=65I/IIUnknownUnknownSD
SART3SNVMissense_Mutationnovelc.1396N>Ap.Glu466Lysp.E466KQ15020protein_codingtolerated(0.44)probably_damaging(0.997)TCGA-B6-A0I1-01Breastbreast invasive carcinomaFemale>=65I/IIUnknownUnknownPD
SART3SNVMissense_Mutationrs771158811c.236C>Tp.Ser79Phep.S79FQ15020protein_codingdeleterious_low_confidence(0.01)possibly_damaging(0.564)TCGA-BH-A0BR-01Breastbreast invasive carcinomaFemale<65I/IIUnknownUnknownSD
SART3SNVMissense_Mutationrs765674787c.2630A>Gp.Asn877Serp.N877SQ15020protein_codingdeleterious(0.01)probably_damaging(0.995)TCGA-D8-A1XQ-01Breastbreast invasive carcinomaFemale>=65I/IIUnknownUnknownSD
SART3insertionIn_Frame_Insnovelc.37_38insTTTCCTGTCAAGGATTGAGGTGGGGGAAGAp.Glu13delinsValSerCysGlnGlyLeuArgTrpGlyLysLysp.E13delinsVSCQGLRWGKKQ15020protein_codingTCGA-A2-A0CQ-01Breastbreast invasive carcinomaFemale<65I/IIChemotherapyadriamycinSD
SART3insertionIn_Frame_Insnovelc.2150_2151insAACACAAGCTGTTCATCTCAGp.Glu717_Pro718insThrGlnAlaValHisLeuArgp.E717_P718insTQAVHLRQ15020protein_codingTCGA-A8-A07Z-01Breastbreast invasive carcinomaFemale>=65I/IIUnspecificExemestaneSD
SART3insertionIn_Frame_Insnovelc.2788_2789insTTTTCTATATTTTTTTAAp.Ala930delinsValPheTyrIlePheLeuThrp.A930delinsVFYIFLTQ15020protein_codingTCGA-A8-A08H-01Breastbreast invasive carcinomaFemale>=65I/IIUnknownUnknownSD
SART3insertionNonsense_Mutationnovelc.2534_2535insACGAGAACACACTGTTTTTGAGACACAGTTGTCCAAATGTTTCTGp.Tyr845delinsTerp.Y845delins*Q15020protein_codingTCGA-AR-A0TY-01Breastbreast invasive carcinomaFemale<65I/IIUnspecificPaclitaxelPD
Page: 1 2 3 4 5 6 7 8 9 10 

Top

Related drugs of malignant transformation related genes

check buttonIdentification of chemicals and drugs interact with genes involved in malignant transfromation
(DGIdb 4.0)
Entrez IDSymbolCategoryInteraction TypesDrug Claim NameDrug NamePMIDs
Page: 1