
|
|||||
|
 | |
| |
| |
| |
| |
| |
|
Gene: SART1 |
Gene summary for SART1 |
| Gene information | Species | Human | Gene symbol | SART1 | Gene ID | 9092 |
| Gene name | spliceosome associated factor 1, recruiter of U4/U6.U5 tri-snRNP | |
| Gene Alias | Ara1 | |
| Cytomap | 11q13.1 | |
| Gene Type | protein-coding | GO ID | GO:0000375 | UniProtAcc | O43290 |
Top |
Malignant transformation analysis |
| Identification of the aberrant gene expression in precancerous and cancerous lesions by comparing the gene expression of stem-like cells in diseased tissues with normal stem cells |
| Entrez ID | Symbol | Replicates | Species | Organ | Tissue | Adj P-value | Log2FC | Malignancy |
| 9092 | SART1 | LZE4T | Human | Esophagus | ESCC | 2.97e-08 | 1.52e-01 | 0.0811 |
| 9092 | SART1 | LZE7T | Human | Esophagus | ESCC | 1.33e-06 | 2.48e-01 | 0.0667 |
| 9092 | SART1 | LZE20T | Human | Esophagus | ESCC | 7.65e-09 | 4.03e-01 | 0.0662 |
| 9092 | SART1 | LZE22T | Human | Esophagus | ESCC | 1.12e-05 | 3.71e-01 | 0.068 |
| 9092 | SART1 | LZE24T | Human | Esophagus | ESCC | 4.51e-21 | 5.02e-01 | 0.0596 |
| 9092 | SART1 | P1T-E | Human | Esophagus | ESCC | 2.07e-02 | 2.26e-01 | 0.0875 |
| 9092 | SART1 | P2T-E | Human | Esophagus | ESCC | 5.73e-23 | 3.66e-01 | 0.1177 |
| 9092 | SART1 | P4T-E | Human | Esophagus | ESCC | 8.76e-22 | 5.25e-01 | 0.1323 |
| 9092 | SART1 | P5T-E | Human | Esophagus | ESCC | 8.82e-20 | 4.45e-01 | 0.1327 |
| 9092 | SART1 | P8T-E | Human | Esophagus | ESCC | 1.49e-27 | 5.58e-01 | 0.0889 |
| 9092 | SART1 | P9T-E | Human | Esophagus | ESCC | 7.28e-14 | 3.60e-01 | 0.1131 |
| 9092 | SART1 | P10T-E | Human | Esophagus | ESCC | 2.35e-21 | 3.58e-01 | 0.116 |
| 9092 | SART1 | P11T-E | Human | Esophagus | ESCC | 3.22e-11 | 4.20e-01 | 0.1426 |
| 9092 | SART1 | P12T-E | Human | Esophagus | ESCC | 2.99e-29 | 5.76e-01 | 0.1122 |
| 9092 | SART1 | P15T-E | Human | Esophagus | ESCC | 3.35e-28 | 6.98e-01 | 0.1149 |
| 9092 | SART1 | P16T-E | Human | Esophagus | ESCC | 5.51e-26 | 4.92e-01 | 0.1153 |
| 9092 | SART1 | P17T-E | Human | Esophagus | ESCC | 6.42e-14 | 5.27e-01 | 0.1278 |
| 9092 | SART1 | P19T-E | Human | Esophagus | ESCC | 1.10e-10 | 5.79e-01 | 0.1662 |
| 9092 | SART1 | P20T-E | Human | Esophagus | ESCC | 9.88e-05 | 1.62e-01 | 0.1124 |
| 9092 | SART1 | P21T-E | Human | Esophagus | ESCC | 1.99e-19 | 4.35e-01 | 0.1617 |
| Page: 1 2 3 4 5 6 |
| Tissue | Expression Dynamics | Abbreviation |
| Esophagus |  | ESCC: Esophageal squamous cell carcinoma |
| HGIN: High-grade intraepithelial neoplasias | ||
| LGIN: Low-grade intraepithelial neoplasias | ||
| Liver | 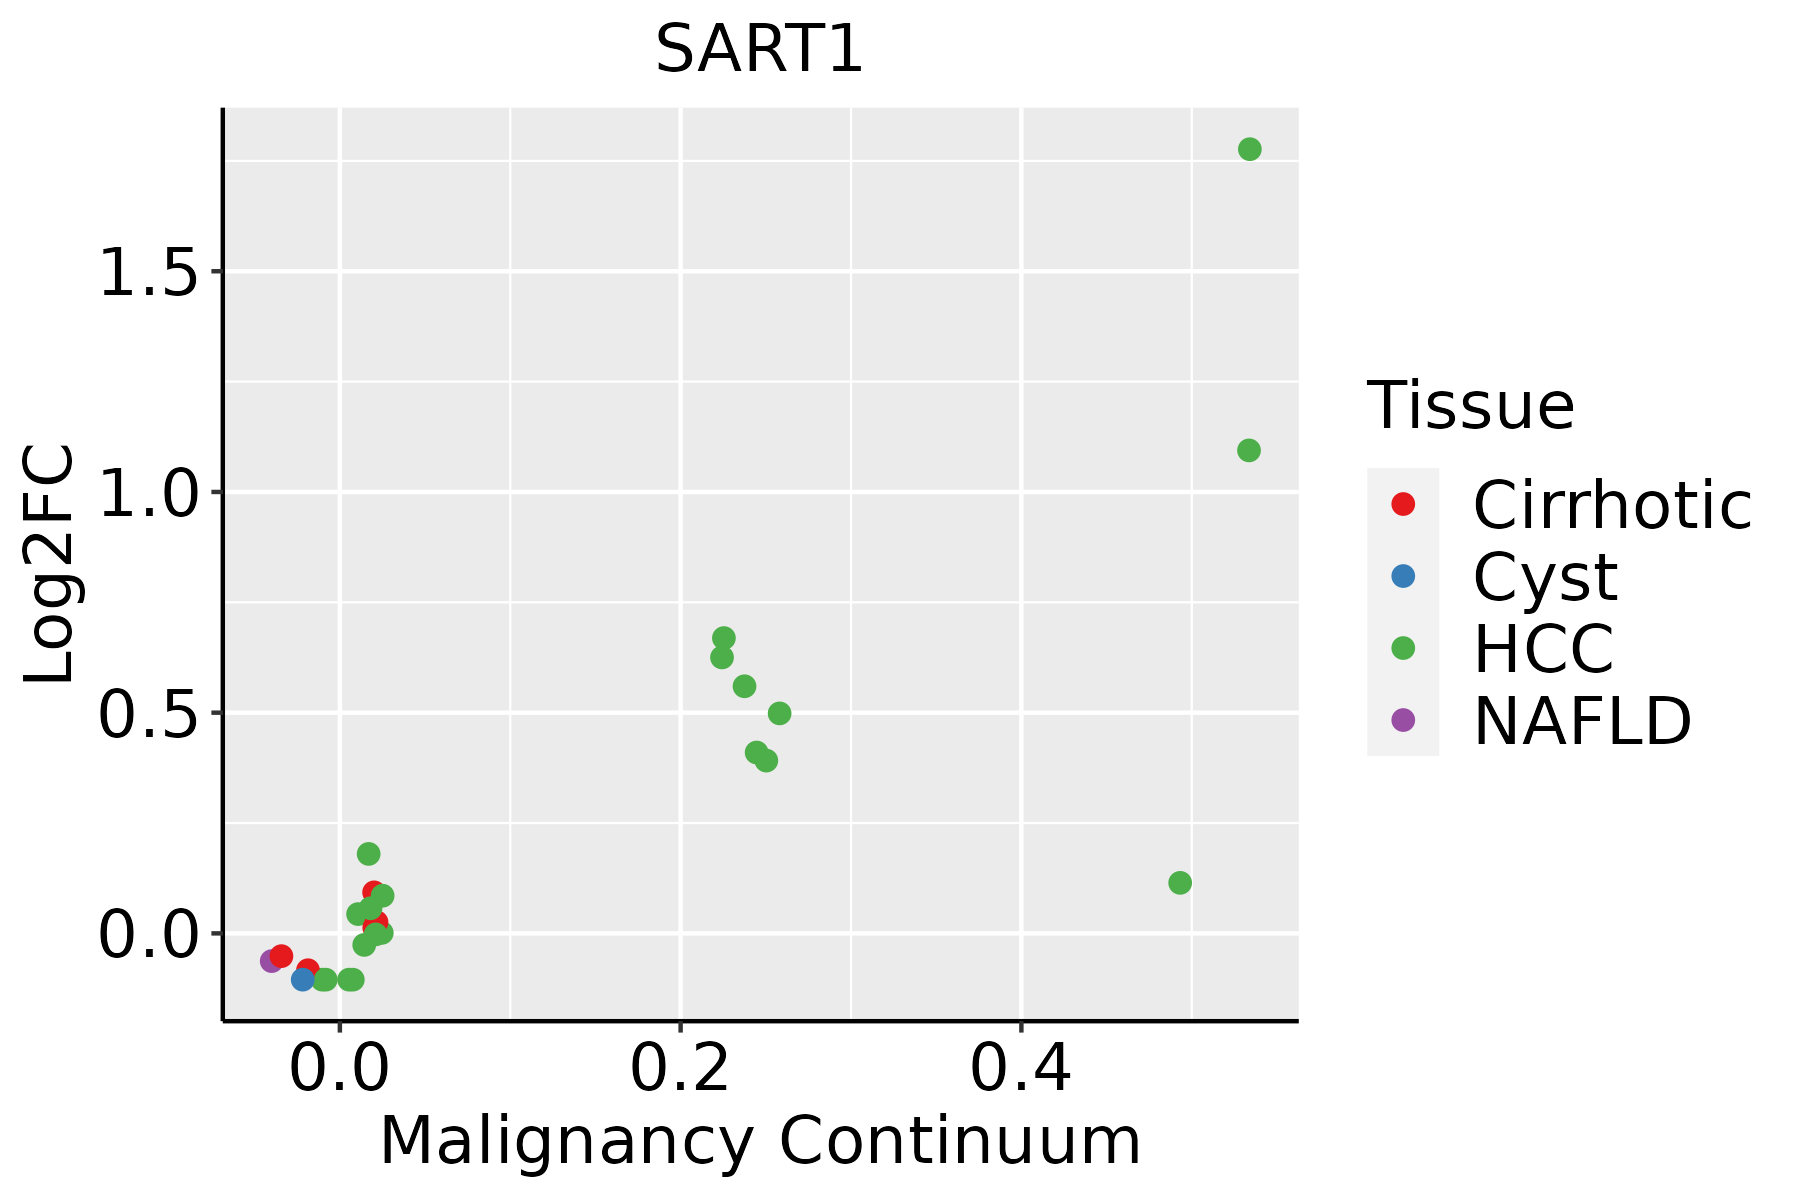 | HCC: Hepatocellular carcinoma |
| NAFLD: Non-alcoholic fatty liver disease | ||
| Oral Cavity | 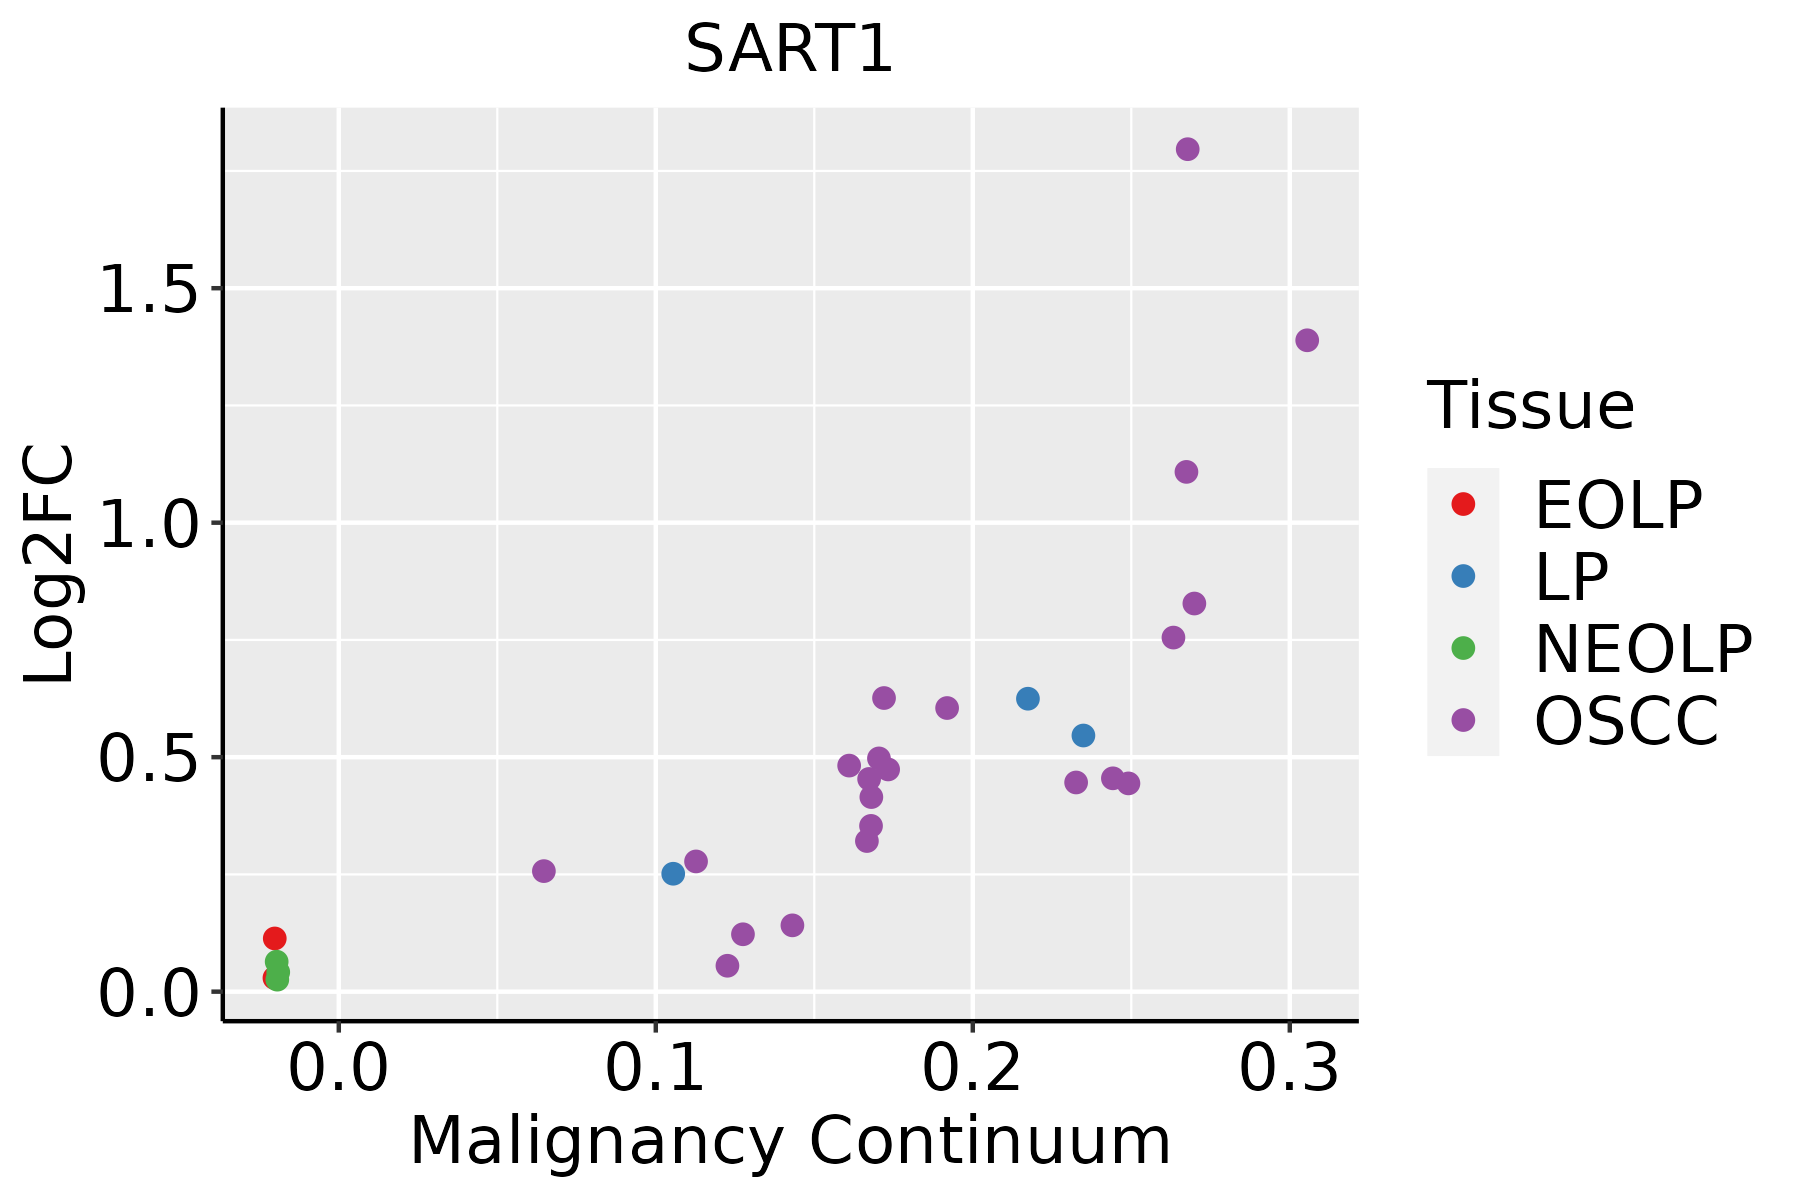 | EOLP: Erosive Oral lichen planus |
| LP: leukoplakia | ||
| NEOLP: Non-erosive oral lichen planus | ||
| OSCC: Oral squamous cell carcinoma | ||
| Skin | 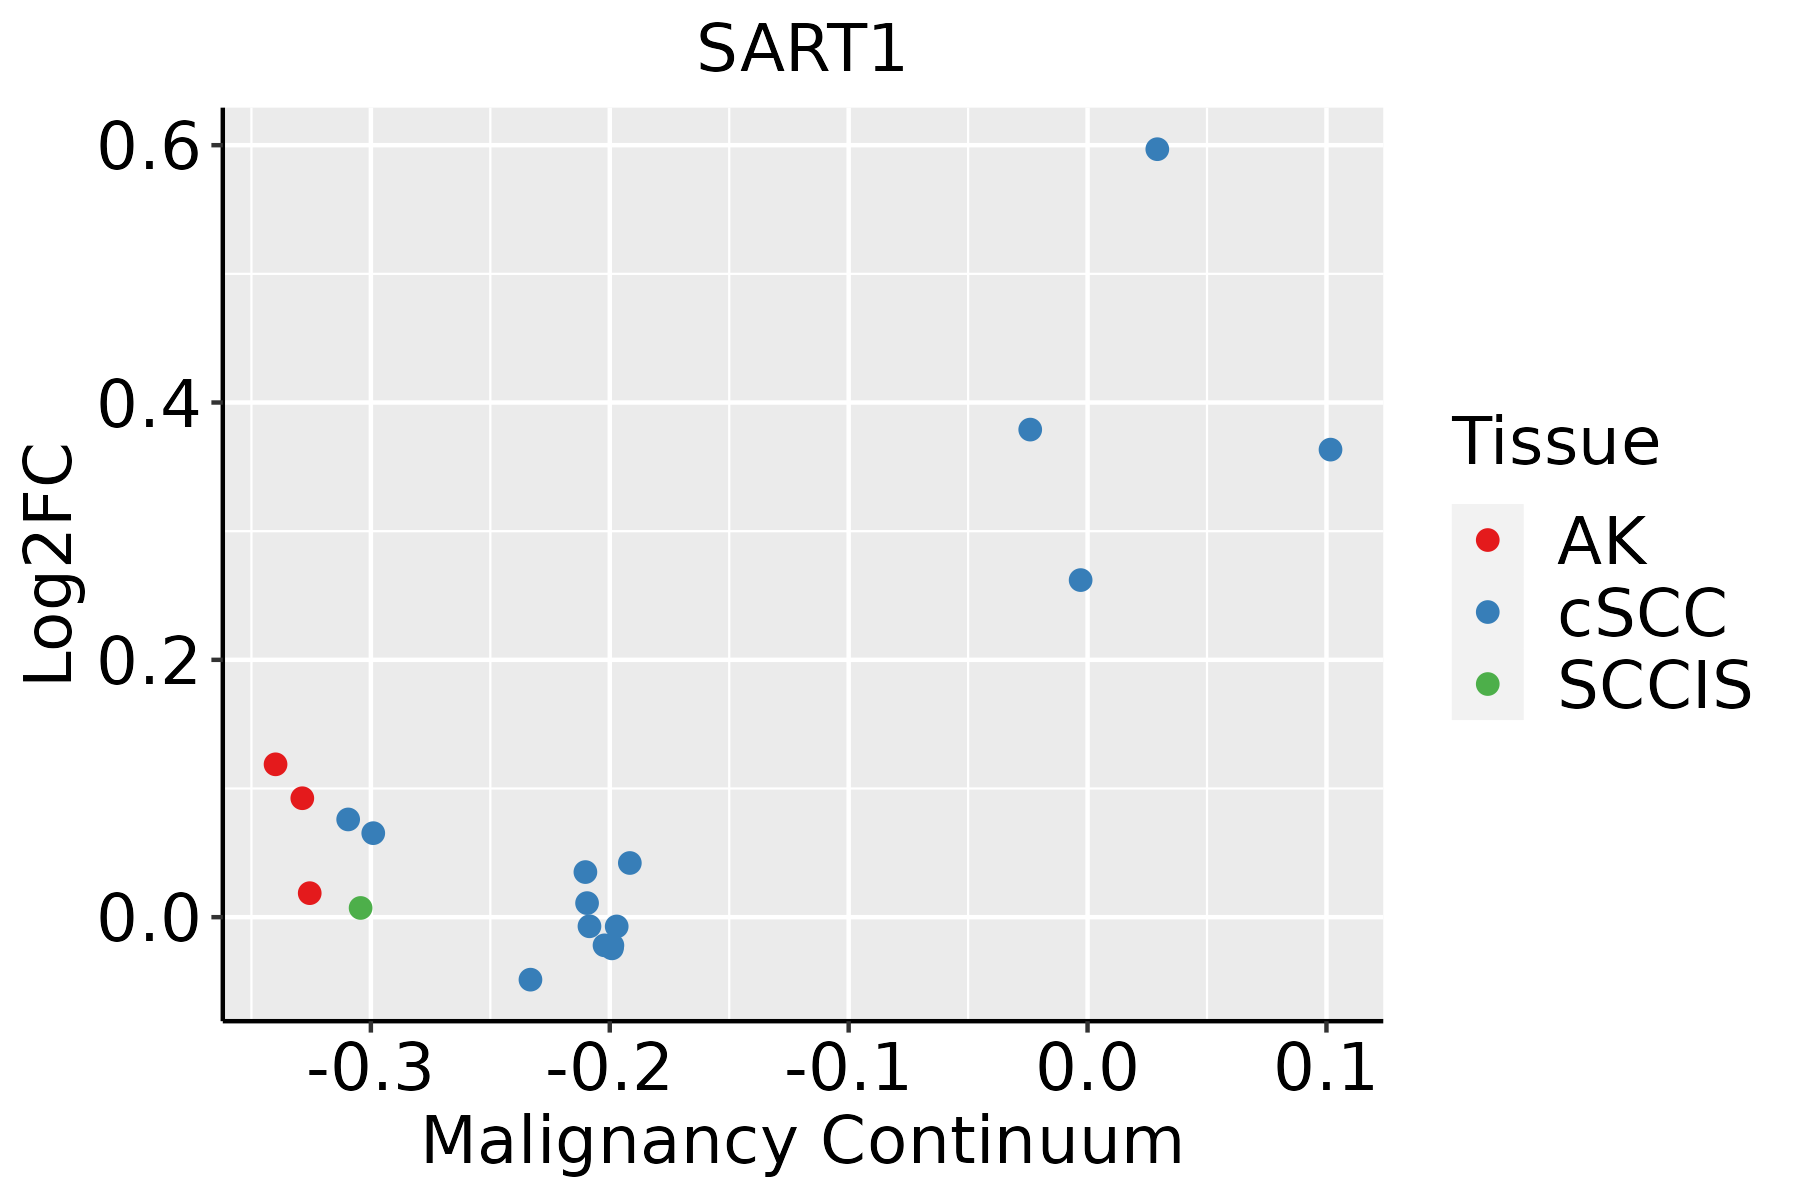 | AK: Actinic keratosis |
| cSCC: Cutaneous squamous cell carcinoma | ||
| SCCIS:squamous cell carcinoma in situ | ||
| Thyroid |  | ATC: Anaplastic thyroid cancer |
| HT: Hashimoto's thyroiditis | ||
| PTC: Papillary thyroid cancer |
| ∗log2FC in expression of this searched gene in stem-like cells from each diseased tissue sample relative to stem-like cells in normal samples in each tissue plotted against the malignancy continuum. Samples are colored based on if they are from different disease stage. |
Top |
Malignant transformation related pathway analysis |
| Find out the enriched GO biological processes and KEGG pathways involved in transition from healthy to precancer to cancer |
| Tissue | Disease Stage | Enriched GO biological Processes |
| Colorectum | AD |  |
| Colorectum | SER |  |
| Colorectum | MSS |  |
| Colorectum | MSI-H |  |
| Colorectum | FAP |  |
| ∗Top 15 enriched GO BP terms are showed in the bar plot of each disease state in each tissue. Each row represents a significant GO biological process which is colored according to the -log10(p.adjust). |
| Page: 1 2 3 4 5 6 7 8 9 |
| GO ID | Tissue | Disease Stage | Description | Gene Ratio | Bg Ratio | pvalue | p.adjust | Count |
| GO:0022613111 | Esophagus | ESCC | ribonucleoprotein complex biogenesis | 365/8552 | 463/18723 | 1.74e-49 | 1.11e-45 | 365 |
| GO:0042254111 | Esophagus | ESCC | ribosome biogenesis | 252/8552 | 299/18723 | 3.27e-44 | 1.04e-40 | 252 |
| GO:0008380111 | Esophagus | ESCC | RNA splicing | 336/8552 | 434/18723 | 1.74e-42 | 3.67e-39 | 336 |
| GO:003447015 | Esophagus | ESCC | ncRNA processing | 300/8552 | 395/18723 | 3.09e-35 | 3.26e-32 | 300 |
| GO:0016072110 | Esophagus | ESCC | rRNA metabolic process | 197/8552 | 236/18723 | 1.31e-33 | 1.18e-30 | 197 |
| GO:0006364110 | Esophagus | ESCC | rRNA processing | 189/8552 | 225/18723 | 4.88e-33 | 3.87e-30 | 189 |
| GO:003466012 | Esophagus | ESCC | ncRNA metabolic process | 346/8552 | 485/18723 | 4.35e-31 | 2.51e-28 | 346 |
| GO:0000375111 | Esophagus | ESCC | RNA splicing, via transesterification reactions | 248/8552 | 324/18723 | 3.05e-30 | 1.49e-27 | 248 |
| GO:0000377111 | Esophagus | ESCC | RNA splicing, via transesterification reactions with bulged adenosine as nucleophile | 244/8552 | 320/18723 | 2.52e-29 | 1.07e-26 | 244 |
| GO:0000398111 | Esophagus | ESCC | mRNA splicing, via spliceosome | 244/8552 | 320/18723 | 2.52e-29 | 1.07e-26 | 244 |
| GO:0071826111 | Esophagus | ESCC | ribonucleoprotein complex subunit organization | 166/8552 | 227/18723 | 2.94e-17 | 2.42e-15 | 166 |
| GO:0022618111 | Esophagus | ESCC | ribonucleoprotein complex assembly | 159/8552 | 220/18723 | 8.19e-16 | 5.71e-14 | 159 |
| GO:004578527 | Esophagus | ESCC | positive regulation of cell adhesion | 255/8552 | 437/18723 | 5.07e-08 | 9.11e-07 | 255 |
| GO:1903706110 | Esophagus | ESCC | regulation of hemopoiesis | 201/8552 | 367/18723 | 2.60e-04 | 1.58e-03 | 201 |
| GO:19021076 | Esophagus | ESCC | positive regulation of leukocyte differentiation | 93/8552 | 157/18723 | 4.20e-04 | 2.39e-03 | 93 |
| GO:19037086 | Esophagus | ESCC | positive regulation of hemopoiesis | 93/8552 | 157/18723 | 4.20e-04 | 2.39e-03 | 93 |
| GO:002240720 | Esophagus | ESCC | regulation of cell-cell adhesion | 239/8552 | 448/18723 | 5.88e-04 | 3.19e-03 | 239 |
| GO:004211018 | Esophagus | ESCC | T cell activation | 256/8552 | 487/18723 | 1.18e-03 | 5.87e-03 | 256 |
| GO:19031317 | Esophagus | ESCC | mononuclear cell differentiation | 226/8552 | 426/18723 | 1.20e-03 | 5.88e-03 | 226 |
| GO:002240919 | Esophagus | ESCC | positive regulation of cell-cell adhesion | 155/8552 | 284/18723 | 1.50e-03 | 7.06e-03 | 155 |
| Page: 1 2 3 4 5 6 7 8 9 |
| Pathway ID | Tissue | Disease Stage | Description | Gene Ratio | Bg Ratio | pvalue | p.adjust | qvalue | Count |
| hsa0304027 | Esophagus | ESCC | Spliceosome | 128/4205 | 217/8465 | 3.31e-03 | 8.79e-03 | 4.50e-03 | 128 |
| hsa0304037 | Esophagus | ESCC | Spliceosome | 128/4205 | 217/8465 | 3.31e-03 | 8.79e-03 | 4.50e-03 | 128 |
| hsa0304022 | Liver | HCC | Spliceosome | 122/4020 | 217/8465 | 5.55e-03 | 1.60e-02 | 8.91e-03 | 122 |
| hsa0304032 | Liver | HCC | Spliceosome | 122/4020 | 217/8465 | 5.55e-03 | 1.60e-02 | 8.91e-03 | 122 |
| hsa0304016 | Oral cavity | OSCC | Spliceosome | 123/3704 | 217/8465 | 7.21e-05 | 2.74e-04 | 1.40e-04 | 123 |
| hsa0304017 | Oral cavity | OSCC | Spliceosome | 123/3704 | 217/8465 | 7.21e-05 | 2.74e-04 | 1.40e-04 | 123 |
| hsa0304026 | Oral cavity | LP | Spliceosome | 106/2418 | 217/8465 | 1.30e-10 | 2.40e-09 | 1.55e-09 | 106 |
| hsa0304036 | Oral cavity | LP | Spliceosome | 106/2418 | 217/8465 | 1.30e-10 | 2.40e-09 | 1.55e-09 | 106 |
| Page: 1 |
Top |
Cell-cell communication analysis |
| Identification of potential cell-cell interactions between two cell types and their ligand-receptor pairs for different disease states |
| Ligand | Receptor | LRpair | Pathway | Tissue | Disease Stage |
| Page: 1 |
Top |
Single-cell gene regulatory network inference analysis |
| Find out the significant the regulons (TFs) and the target genes of each regulon across cell types for different disease states |
| TF | Cell Type | Tissue | Disease Stage | Target Gene | RSS | Regulon Activity |
| ∗The dot plots of a searched regulon are shown for all cell subpopulations in each disease state of each tissue based on the regulon specific score inferred using pySCENIC and by calculating the average expression. |
| Page: 1 |
Top |
Somatic mutation of malignant transformation related genes |
| Annotation of somatic variants for genes involved in malignant transformation |
| Hugo Symbol | Variant Class | Variant Classification | dbSNP RS | HGVSc | HGVSp | HGVSp Short | SWISSPROT | BIOTYPE | SIFT | PolyPhen | Tumor Sample Barcode | Tissue | Histology | Sex | Age | Stage | Therapy Types | Drugs | Outcome |
| SART1 | SNV | Missense_Mutation | c.2170N>C | p.Glu724Gln | p.E724Q | O43290 | protein_coding | deleterious(0) | probably_damaging(0.999) | TCGA-B6-A0IJ-01 | Breast | breast invasive carcinoma | Female | <65 | I/II | Unknown | Unknown | SD | |
| SART1 | SNV | Missense_Mutation | c.2223G>T | p.Met741Ile | p.M741I | O43290 | protein_coding | tolerated(0.09) | probably_damaging(0.954) | TCGA-E2-A1IH-01 | Breast | breast invasive carcinoma | Female | >=65 | I/II | Hormone Therapy | aromasin | SD | |
| SART1 | SNV | Missense_Mutation | novel | c.2072A>G | p.Tyr691Cys | p.Y691C | O43290 | protein_coding | deleterious(0) | probably_damaging(0.98) | TCGA-OL-A5S0-01 | Breast | breast invasive carcinoma | Female | >=65 | I/II | Chemotherapy | taxol | CR |
| SART1 | SNV | Missense_Mutation | rs752447113 | c.2236N>T | p.Arg746Trp | p.R746W | O43290 | protein_coding | deleterious(0) | probably_damaging(0.981) | TCGA-2W-A8YY-01 | Cervix | cervical & endocervical cancer | Female | <65 | I/II | Chemotherapy | cisplatin | CR |
| SART1 | SNV | Missense_Mutation | novel | c.2353N>A | p.Val785Met | p.V785M | O43290 | protein_coding | deleterious(0) | possibly_damaging(0.862) | TCGA-2W-A8YY-01 | Cervix | cervical & endocervical cancer | Female | <65 | I/II | Chemotherapy | cisplatin | CR |
| SART1 | SNV | Missense_Mutation | c.802N>A | p.Glu268Lys | p.E268K | O43290 | protein_coding | deleterious(0) | probably_damaging(0.994) | TCGA-JW-A5VL-01 | Cervix | cervical & endocervical cancer | Female | <65 | I/II | Unknown | Unknown | SD | |
| SART1 | SNV | Missense_Mutation | c.1426N>C | p.Glu476Gln | p.E476Q | O43290 | protein_coding | tolerated(0.14) | benign(0.026) | TCGA-JW-A5VL-01 | Cervix | cervical & endocervical cancer | Female | <65 | I/II | Unknown | Unknown | SD | |
| SART1 | SNV | Missense_Mutation | novel | c.962N>A | p.Ser321Asn | p.S321N | O43290 | protein_coding | tolerated(0.23) | benign(0.017) | TCGA-AA-A010-01 | Colorectum | colon adenocarcinoma | Female | <65 | I/II | Chemotherapy | folinic | CR |
| SART1 | SNV | Missense_Mutation | rs369415657 | c.2384C>T | p.Ala795Val | p.A795V | O43290 | protein_coding | tolerated(0.06) | possibly_damaging(0.868) | TCGA-CK-4951-01 | Colorectum | colon adenocarcinoma | Female | >=65 | I/II | Unknown | Unknown | PD |
| SART1 | SNV | Missense_Mutation | rs764597455 | c.733N>T | p.Arg245Trp | p.R245W | O43290 | protein_coding | deleterious(0) | benign(0.003) | TCGA-WS-AB45-01 | Colorectum | colon adenocarcinoma | Female | <65 | I/II | Unknown | Unknown | SD |
| Page: 1 2 3 4 5 6 |
Top |
Related drugs of malignant transformation related genes |
| Identification of chemicals and drugs interact with genes involved in malignant transfromation |
| (DGIdb 4.0) |
| Entrez ID | Symbol | Category | Interaction Types | Drug Claim Name | Drug Name | PMIDs |
| Page: 1 |

Copyright 2023-Present -The University of Texas Health Science Center at Houston |