Schematic overview of the cellular and molecular mechanisms involved in the cancer progression, including the proposed cellular and molecular mechanisms in cancer cells trajectory. AT1: alveolar type 1 cells; AT2: alveolar type 2 cells; AAH: atypical adenomatous hyperplasia; AIS: adenocarcinoma in situ; MIA: minimally invasive adenocarcinoma; IA: invasive adenocarcinoma; EMT: epithelial-mesenchymal transition

Home

Download

Statistics

Help

Contact

Center for Computational Systems Medicine
leaf

Gene summary

leaf

Malignant transformation analysis

leaf

Malignant transformation related pathway analysis

leaf

Cell-cell communication analysis

leaf

Single-cell gene regulatory network inference analysis

leaf

Somatic mutation of malignant transformation related genes

leaf

Related drugs of malignant transformation related genes

Gene: SARS

Gene summary for SARS

check button Gene summary.

Gene informationSpeciesHuman
Gene symbol

SARS

Gene ID

6301

Gene nameseryl-tRNA synthetase 1
Gene AliasNEDMAS
Cytomap1p13.3
Gene Typeprotein-coding
GO ID

GO:0000122

UniProtAcc

Q5T5C7


Top

Malignant transformation analysis

check button Identification of the aberrant gene expression in precancerous and cancerous lesions by comparing the gene expression of stem-like cells in diseased tissues with normal stem cells
check button Malignant transformation involving gene list.
Entrez IDSymbolReplicatesSpeciesOrganTissueAdj P-valueLog2FCMalignancy
6301SARSLZE4THumanEsophagusESCC1.87e-084.65e-010.0811
6301SARSLZE7THumanEsophagusESCC1.73e-046.69e-010.0667
6301SARSLZE8THumanEsophagusESCC7.69e-096.74e-020.067
6301SARSLZE22THumanEsophagusESCC8.74e-043.08e-010.068
6301SARSLZE24THumanEsophagusESCC1.32e-074.18e-010.0596
6301SARSLZE6THumanEsophagusESCC1.54e-051.38e-010.0845
6301SARSP1T-EHumanEsophagusESCC7.82e-065.27e-010.0875
6301SARSP2T-EHumanEsophagusESCC2.64e-411.11e+000.1177
6301SARSP4T-EHumanEsophagusESCC8.93e-286.66e-010.1323
6301SARSP5T-EHumanEsophagusESCC1.19e-197.01e-010.1327
6301SARSP8T-EHumanEsophagusESCC2.33e-214.50e-010.0889
6301SARSP9T-EHumanEsophagusESCC7.76e-253.66e-010.1131
6301SARSP10T-EHumanEsophagusESCC1.82e-388.08e-010.116
6301SARSP11T-EHumanEsophagusESCC7.18e-167.92e-010.1426
6301SARSP12T-EHumanEsophagusESCC1.21e-711.82e+000.1122
6301SARSP15T-EHumanEsophagusESCC3.78e-286.11e-010.1149
6301SARSP16T-EHumanEsophagusESCC2.39e-247.11e-010.1153
6301SARSP17T-EHumanEsophagusESCC2.78e-181.04e+000.1278
6301SARSP19T-EHumanEsophagusESCC1.41e-061.13e+000.1662
6301SARSP20T-EHumanEsophagusESCC1.56e-154.74e-010.1124
Page: 1 2 3 4 5 6 7 

check button Transcriptomic changes along malignancy continuum.
TissueExpression DynamicsAbbreviation
EsophagusThe image shows the transcriptomic changes along malignancy continuum.log2FC in expression of this searched gene in stem-like cells from each diseased tissue sample relative to stem-like cells in normal samples in each tissue plotted against the malignancy continuum. Samples are colored based on if they are from different disease stage.
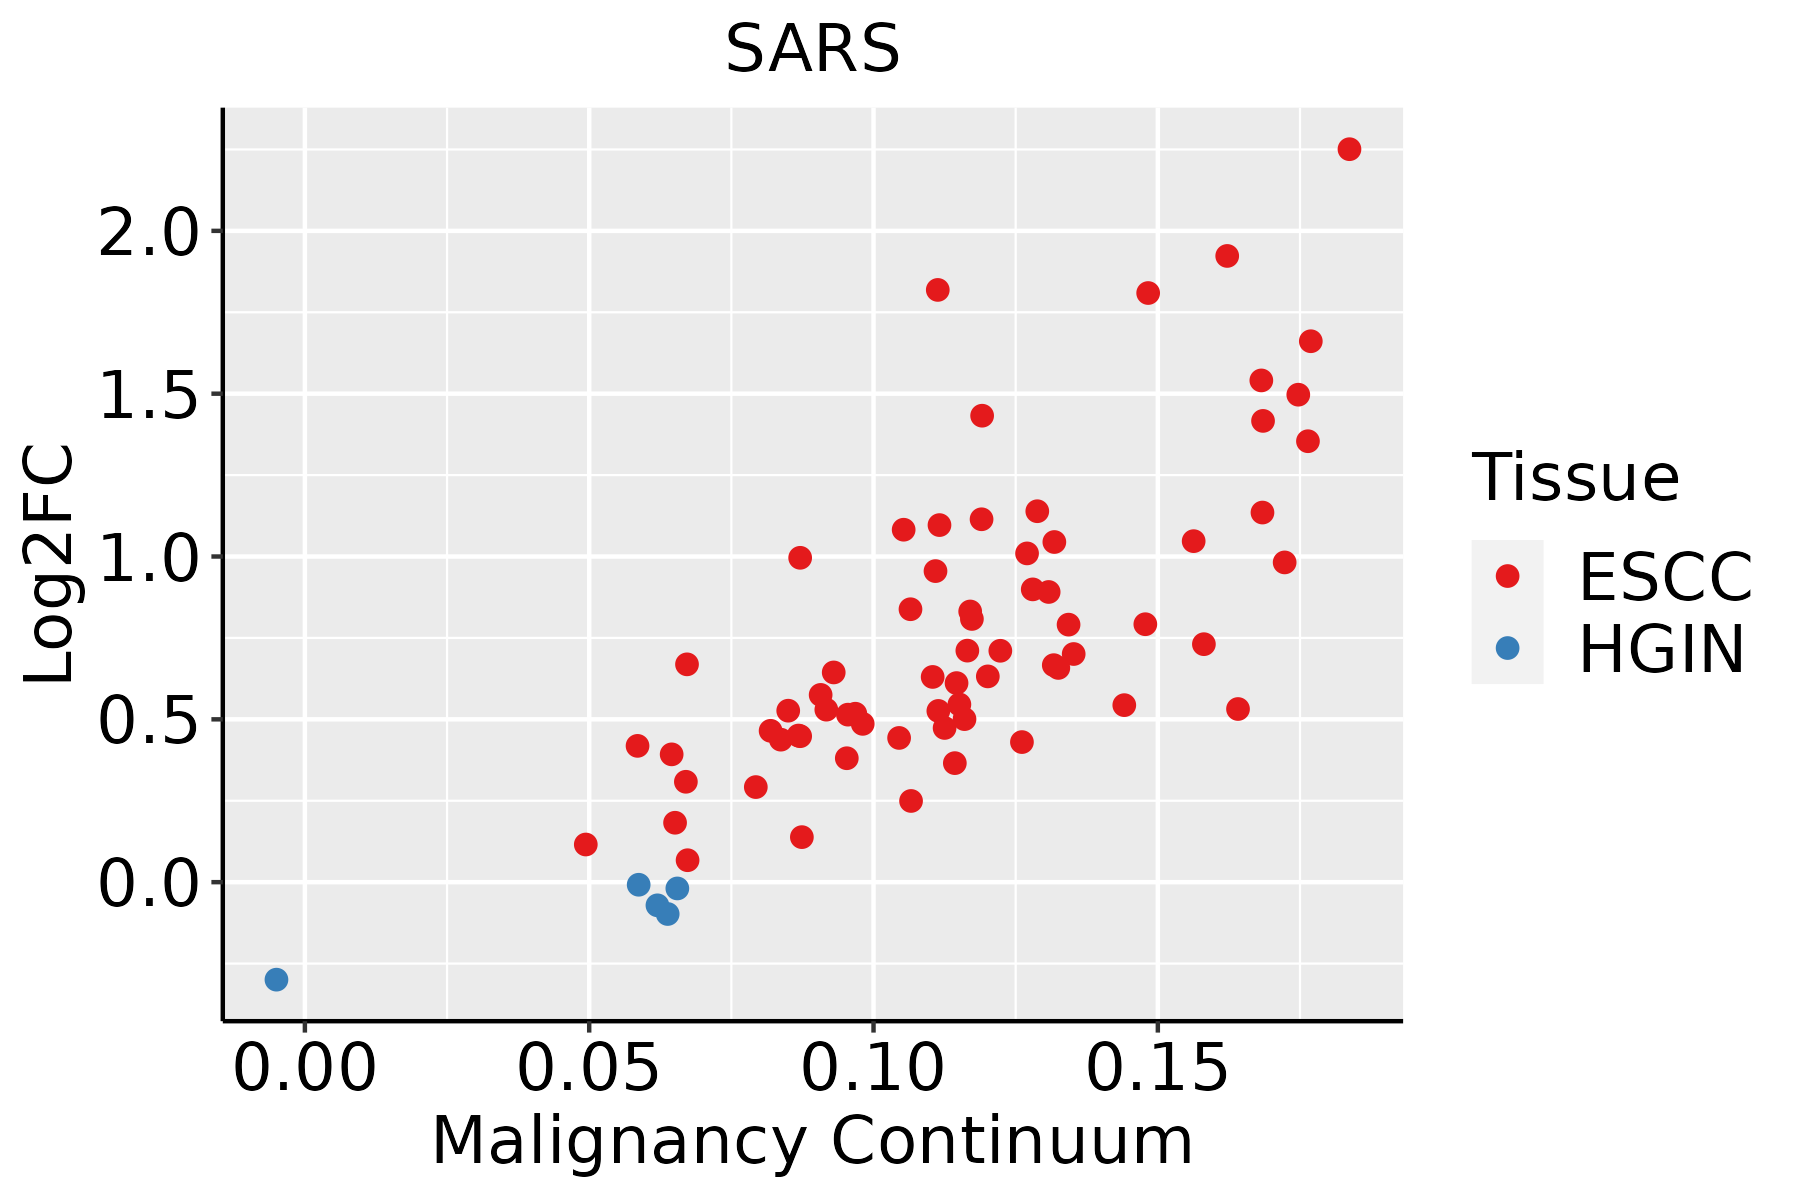
ESCC: Esophageal squamous cell carcinoma
HGIN: High-grade intraepithelial neoplasias
LGIN: Low-grade intraepithelial neoplasias
LiverThe image shows the transcriptomic changes along malignancy continuum.log2FC in expression of this searched gene in stem-like cells from each diseased tissue sample relative to stem-like cells in normal samples in each tissue plotted against the malignancy continuum. Samples are colored based on if they are from different disease stage.
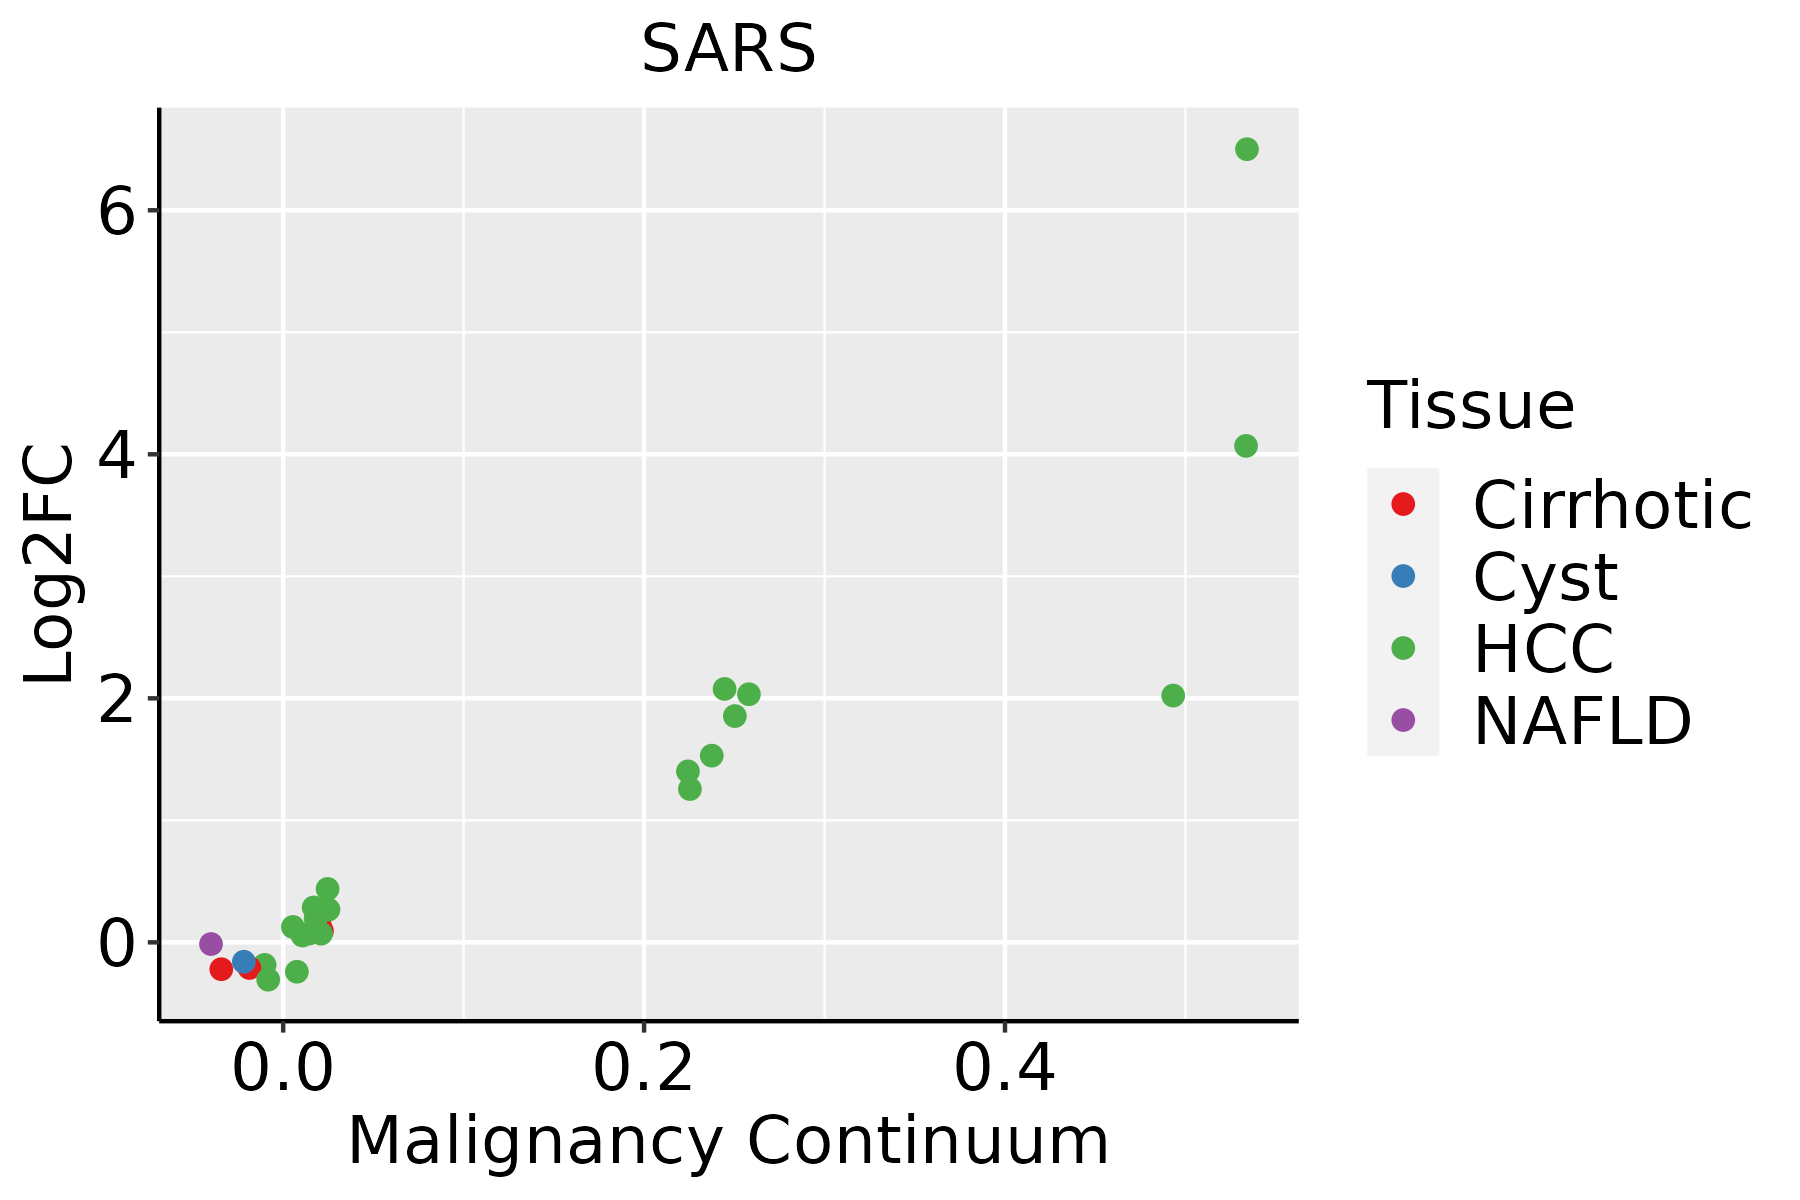
HCC: Hepatocellular carcinoma
NAFLD: Non-alcoholic fatty liver disease
Oral CavityThe image shows the transcriptomic changes along malignancy continuum.log2FC in expression of this searched gene in stem-like cells from each diseased tissue sample relative to stem-like cells in normal samples in each tissue plotted against the malignancy continuum. Samples are colored based on if they are from different disease stage.EOLP: Erosive Oral lichen planus
LP: leukoplakia
NEOLP: Non-erosive oral lichen planus
OSCC: Oral squamous cell carcinoma
SkinThe image shows the transcriptomic changes along malignancy continuum.log2FC in expression of this searched gene in stem-like cells from each diseased tissue sample relative to stem-like cells in normal samples in each tissue plotted against the malignancy continuum. Samples are colored based on if they are from different disease stage.
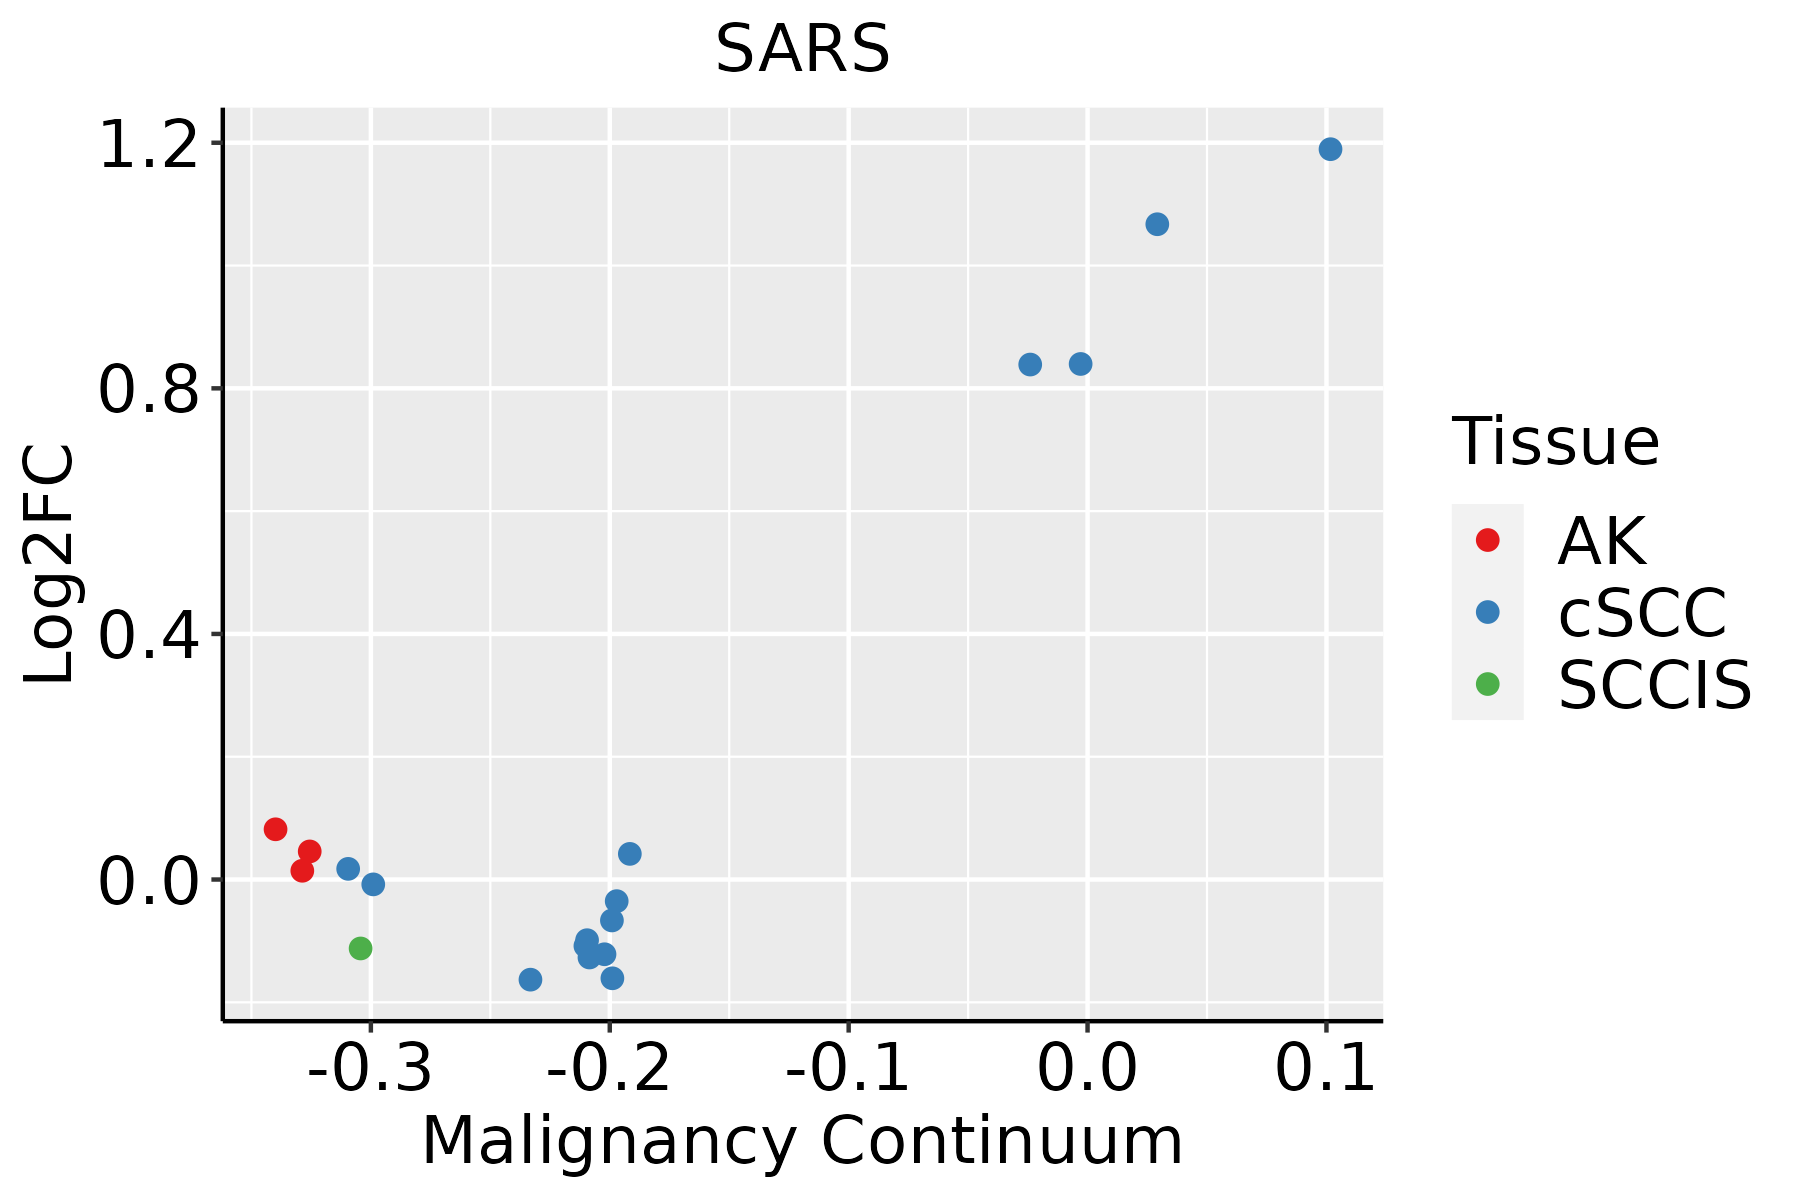
AK: Actinic keratosis
cSCC: Cutaneous squamous cell carcinoma
SCCIS:squamous cell carcinoma in situ
ThyroidThe image shows the transcriptomic changes along malignancy continuum.log2FC in expression of this searched gene in stem-like cells from each diseased tissue sample relative to stem-like cells in normal samples in each tissue plotted against the malignancy continuum. Samples are colored based on if they are from different disease stage.ATC: Anaplastic thyroid cancer
HT: Hashimoto's thyroiditis
PTC: Papillary thyroid cancer
∗log2FC in expression of this searched gene in stem-like cells from each diseased tissue sample relative to stem-like cells in normal samples in each tissue plotted against the malignancy continuum. Samples are colored based on if they are from different disease stage.

Top

Malignant transformation related pathway analysis

check buttonFind out the enriched GO biological processes and KEGG pathways involved in transition from healthy to precancer to cancer
check button Figure of enriched GO biological processes.
TissueDisease StageEnriched GO biological Processes
ColorectumADGO analysis - Figure of enriched GO biological processes: Top 15 enriched GO BP terms are showed in the bar plot of each disease state in each tissue. Each row represents a significant GO biological process which is colored according to the -log10(p.adjust).
ColorectumSERGO analysis - Figure of enriched GO biological processes: Top 15 enriched GO BP terms are showed in the bar plot of each disease state in each tissue. Each row represents a significant GO biological process which is colored according to the -log10(p.adjust).
ColorectumMSSGO analysis - Figure of enriched GO biological processes: Top 15 enriched GO BP terms are showed in the bar plot of each disease state in each tissue. Each row represents a significant GO biological process which is colored according to the -log10(p.adjust).
ColorectumMSI-HGO analysis - Figure of enriched GO biological processes: Top 15 enriched GO BP terms are showed in the bar plot of each disease state in each tissue. Each row represents a significant GO biological process which is colored according to the -log10(p.adjust).
ColorectumFAPGO analysis - Figure of enriched GO biological processes: Top 15 enriched GO BP terms are showed in the bar plot of each disease state in each tissue. Each row represents a significant GO biological process which is colored according to the -log10(p.adjust).
∗Top 15 enriched GO BP terms are showed in the bar plot of each disease state in each tissue. Each row represents a significant GO biological process which is colored according to the -log10(p.adjust).
Page: 1 2 3 4 5 6 7 8 9 

check button Enriched GO biological processes.
GO IDTissueDisease StageDescriptionGene RatioBg Ratiopvaluep.adjustCount
GO:0006418ColorectumADtRNA aminoacylation for protein translation19/391841/187232.37e-043.03e-0319
GO:0043039ColorectumADtRNA aminoacylation19/391844/187237.13e-047.21e-0319
GO:0043038ColorectumADamino acid activation19/391845/187239.94e-049.28e-0319
GO:0006520ColorectumADcellular amino acid metabolic process81/3918284/187231.37e-031.19e-0281
GO:00064181ColorectumSERtRNA aminoacylation for protein translation17/289741/187235.75e-051.35e-0317
GO:00430391ColorectumSERtRNA aminoacylation17/289744/187231.64e-043.12e-0317
GO:00430381ColorectumSERamino acid activation17/289745/187232.25e-043.91e-0317
GO:00065201ColorectumSERcellular amino acid metabolic process61/2897284/187234.20e-033.41e-0261
GO:003466012EsophagusESCCncRNA metabolic process346/8552485/187234.35e-312.51e-28346
GO:014005313EsophagusESCCmitochondrial gene expression93/8552108/187231.96e-182.03e-1693
GO:003254314EsophagusESCCmitochondrial translation68/855276/187231.02e-156.86e-1468
GO:00063992EsophagusESCCtRNA metabolic process122/8552179/187239.03e-102.19e-08122
GO:00009592EsophagusESCCmitochondrial RNA metabolic process39/855249/187231.20e-061.49e-0539
GO:00346601LiverHCCncRNA metabolic process332/7958485/187231.48e-317.80e-29332
GO:01400531LiverHCCmitochondrial gene expression82/7958108/187231.49e-127.20e-1182
GO:00325431LiverHCCmitochondrial translation62/795876/187232.95e-121.34e-1062
GO:00065202LiverHCCcellular amino acid metabolic process167/7958284/187231.91e-084.56e-07167
GO:0006399LiverHCCtRNA metabolic process108/7958179/187231.07e-061.59e-05108
GO:0000959LiverHCCmitochondrial RNA metabolic process30/795849/187236.31e-032.57e-0230
GO:00346605Oral cavityOSCCncRNA metabolic process296/7305485/187232.94e-236.65e-21296
Page: 1 2 

check button Enriched KEGG pathways.
Pathway IDTissueDisease StageDescriptionGene RatioBg Ratiopvaluep.adjustqvalueCount
Page: 1 

Top

Cell-cell communication analysis

check buttonIdentification of potential cell-cell interactions between two cell types and their ligand-receptor pairs for different disease states
LigandReceptorLRpairPathwayTissueDisease Stage
Page: 1 

Top

Single-cell gene regulatory network inference analysis

check buttonFind out the significant the regulons (TFs) and the target genes of each regulon across cell types for different disease states
TFCell TypeTissueDisease StageTarget GeneRSSRegulon Activity
∗The dot plots of a searched regulon are shown for all cell subpopulations in each disease state of each tissue based on the regulon specific score inferred using pySCENIC and by calculating the average expression.
Page: 1 

Top

Somatic mutation of malignant transformation related genes

check buttonAnnotation of somatic variants for genes involved in malignant transformation
Hugo SymbolVariant ClassVariant ClassificationdbSNP RSHGVScHGVSpHGVSp ShortSWISSPROTBIOTYPESIFTPolyPhenTumor Sample BarcodeTissueHistologySexAgeStageTherapy TypesDrugsOutcome
SARSSNVMissense_Mutationc.1525N>Ap.Gln509Lysp.Q509Kprotein_codingtolerated(0.31)probably_damaging(0.93)TCGA-A7-A0CE-01Breastbreast invasive carcinomaFemale<65I/IIChemotherapyadriamycinSD
SARSSNVMissense_Mutationnovelc.530T>Gp.Val177Glyp.V177Gprotein_codingdeleterious(0)probably_damaging(0.934)TCGA-B6-A0I6-01Breastbreast invasive carcinomaFemale<65I/IIUnknownUnknownPD
SARSSNVMissense_Mutationc.1132N>Tp.Asp378Tyrp.D378Yprotein_codingdeleterious(0)probably_damaging(0.996)TCGA-C8-A12T-01Breastbreast invasive carcinomaFemale<65I/IIUnknownUnknownSD
SARSSNVMissense_Mutationc.731N>Tp.Asp244Valp.D244Vprotein_codingdeleterious(0)probably_damaging(0.997)TCGA-D8-A1JS-01Breastbreast invasive carcinomaFemale>=65I/IIHormone TherapytamoxiphenSD
SARSSNVMissense_Mutationc.1493N>Ap.Ile498Asnp.I498Nprotein_codingdeleterious(0.03)probably_damaging(0.924)TCGA-D8-A1XK-01Breastbreast invasive carcinomaFemale<65I/IIChemotherapydoxorubicine+cyclophosphamideSD
SARSinsertionFrame_Shift_Insnovelc.1072_1073insCATCCTGGCTCCAGCTTTTCCTCTCATTGp.Tyr359SerfsTer14p.Y359Sfs*14protein_codingTCGA-B6-A0RE-01Breastbreast invasive carcinomaFemale<65I/IIUnknownUnknownSD
SARSdeletionIn_Frame_Delnovelc.758_778delNNNNNNNNNNNNNNNNNNNNNp.Lys253_Asp260delinsAsnp.K253_D260delinsNprotein_codingTCGA-E9-A3QA-01Breastbreast invasive carcinomaFemale<65I/IIUnknownUnknownSD
SARSinsertionFrame_Shift_Insnovelc.158_159insGp.Asn54GlufsTer24p.N54Efs*24protein_codingTCGA-Z7-A8R6-01Breastbreast invasive carcinomaFemale<65I/IIChemotherapytaxolCR
SARSSNVMissense_Mutationrs745648414c.1280N>Gp.Ser427Cysp.S427Cprotein_codingtolerated(0.06)benign(0.157)TCGA-EK-A3GK-01Cervixcervical & endocervical cancerFemale<65I/IIUnknownUnknownSD
SARSSNVMissense_Mutationnovelc.81N>Gp.Phe27Leup.F27Lprotein_codingdeleterious(0.01)possibly_damaging(0.868)TCGA-VS-A94X-01Cervixcervical & endocervical cancerFemale<65I/IIChemotherapycisplatinPD
Page: 1 2 3 4 5 6 

Top

Related drugs of malignant transformation related genes

check buttonIdentification of chemicals and drugs interact with genes involved in malignant transfromation
(DGIdb 4.0)
Entrez IDSymbolCategoryInteraction TypesDrug Claim NameDrug NamePMIDs
Page: 1