
|
|||||
|
 | |
| |
| |
| |
| |
| |
|
Gene: SARNP |
Gene summary for SARNP |
| Gene information | Species | Human | Gene symbol | SARNP | Gene ID | 84324 |
| Gene name | SAP domain containing ribonucleoprotein | |
| Gene Alias | CIP29 | |
| Cytomap | 12q13.2 | |
| Gene Type | protein-coding | GO ID | GO:0006403 | UniProtAcc | P82979 |
Top |
Malignant transformation analysis |
| Identification of the aberrant gene expression in precancerous and cancerous lesions by comparing the gene expression of stem-like cells in diseased tissues with normal stem cells |
| Entrez ID | Symbol | Replicates | Species | Organ | Tissue | Adj P-value | Log2FC | Malignancy |
| 84324 | SARNP | LZE4T | Human | Esophagus | ESCC | 4.63e-17 | 4.38e-01 | 0.0811 |
| 84324 | SARNP | LZE5T | Human | Esophagus | ESCC | 3.17e-05 | 5.09e-01 | 0.0514 |
| 84324 | SARNP | LZE7T | Human | Esophagus | ESCC | 6.67e-17 | 9.16e-01 | 0.0667 |
| 84324 | SARNP | LZE8T | Human | Esophagus | ESCC | 7.26e-20 | 6.46e-01 | 0.067 |
| 84324 | SARNP | LZE20T | Human | Esophagus | ESCC | 1.53e-11 | 4.11e-01 | 0.0662 |
| 84324 | SARNP | LZE22D1 | Human | Esophagus | HGIN | 2.15e-02 | 2.39e-01 | 0.0595 |
| 84324 | SARNP | LZE22T | Human | Esophagus | ESCC | 5.08e-08 | 6.64e-01 | 0.068 |
| 84324 | SARNP | LZE24T | Human | Esophagus | ESCC | 8.63e-27 | 7.08e-01 | 0.0596 |
| 84324 | SARNP | LZE21T | Human | Esophagus | ESCC | 7.64e-08 | 6.90e-01 | 0.0655 |
| 84324 | SARNP | LZE6T | Human | Esophagus | ESCC | 2.64e-12 | 6.21e-01 | 0.0845 |
| 84324 | SARNP | P1T-E | Human | Esophagus | ESCC | 2.93e-19 | 7.73e-01 | 0.0875 |
| 84324 | SARNP | P2T-E | Human | Esophagus | ESCC | 3.54e-59 | 9.28e-01 | 0.1177 |
| 84324 | SARNP | P4T-E | Human | Esophagus | ESCC | 1.13e-48 | 1.09e+00 | 0.1323 |
| 84324 | SARNP | P5T-E | Human | Esophagus | ESCC | 1.31e-56 | 9.74e-01 | 0.1327 |
| 84324 | SARNP | P8T-E | Human | Esophagus | ESCC | 8.41e-54 | 9.49e-01 | 0.0889 |
| 84324 | SARNP | P9T-E | Human | Esophagus | ESCC | 6.37e-30 | 6.68e-01 | 0.1131 |
| 84324 | SARNP | P10T-E | Human | Esophagus | ESCC | 2.50e-56 | 9.61e-01 | 0.116 |
| 84324 | SARNP | P11T-E | Human | Esophagus | ESCC | 5.92e-24 | 9.21e-01 | 0.1426 |
| 84324 | SARNP | P12T-E | Human | Esophagus | ESCC | 4.87e-65 | 1.18e+00 | 0.1122 |
| 84324 | SARNP | P15T-E | Human | Esophagus | ESCC | 1.64e-39 | 7.34e-01 | 0.1149 |
| Page: 1 2 3 4 5 6 |
| Tissue | Expression Dynamics | Abbreviation |
| Esophagus |  | ESCC: Esophageal squamous cell carcinoma |
| HGIN: High-grade intraepithelial neoplasias | ||
| LGIN: Low-grade intraepithelial neoplasias | ||
| GC | 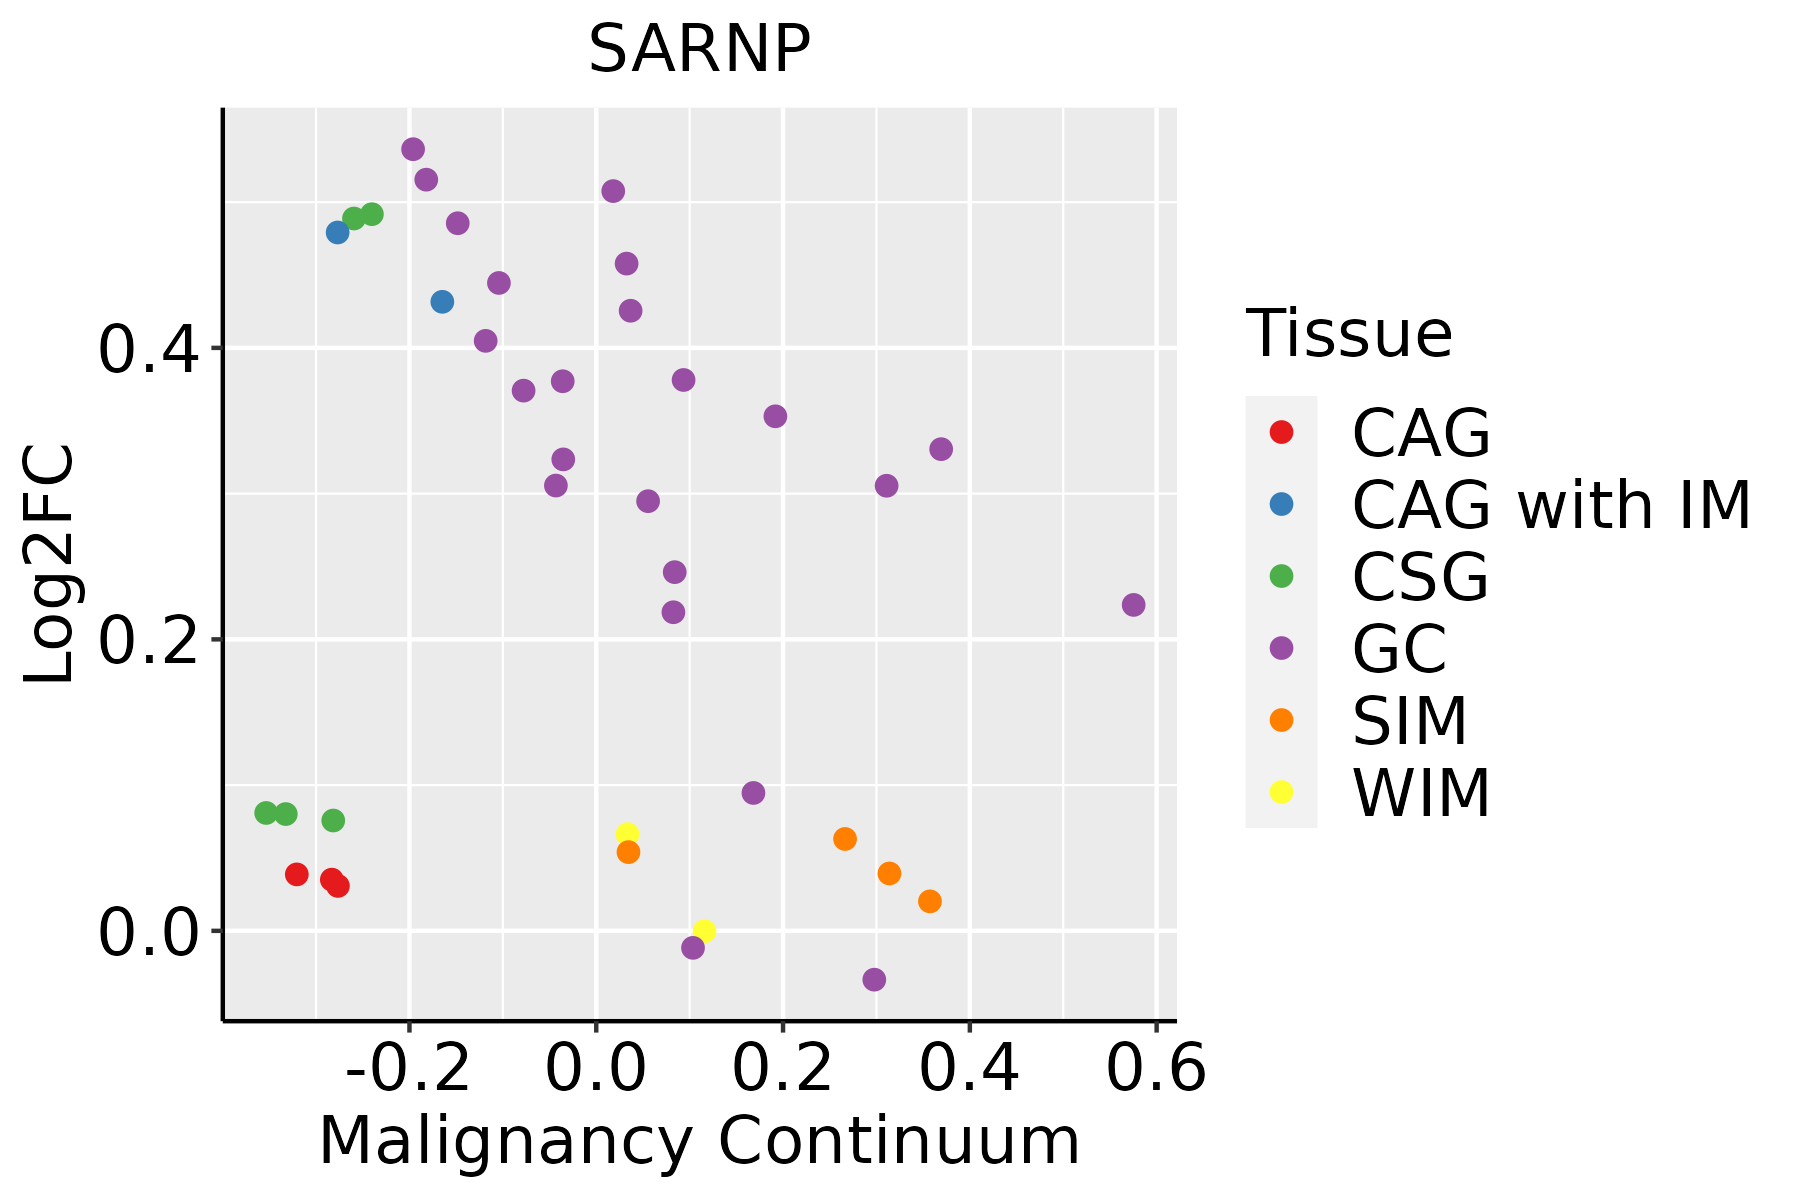 | CAG: Chronic atrophic gastritis |
| CAG with IM: Chronic atrophic gastritis with intestinal metaplasia | ||
| CSG: Chronic superficial gastritis | ||
| GC: Gastric cancer | ||
| SIM: Severe intestinal metaplasia | ||
| WIM: Wild intestinal metaplasia | ||
| Liver | 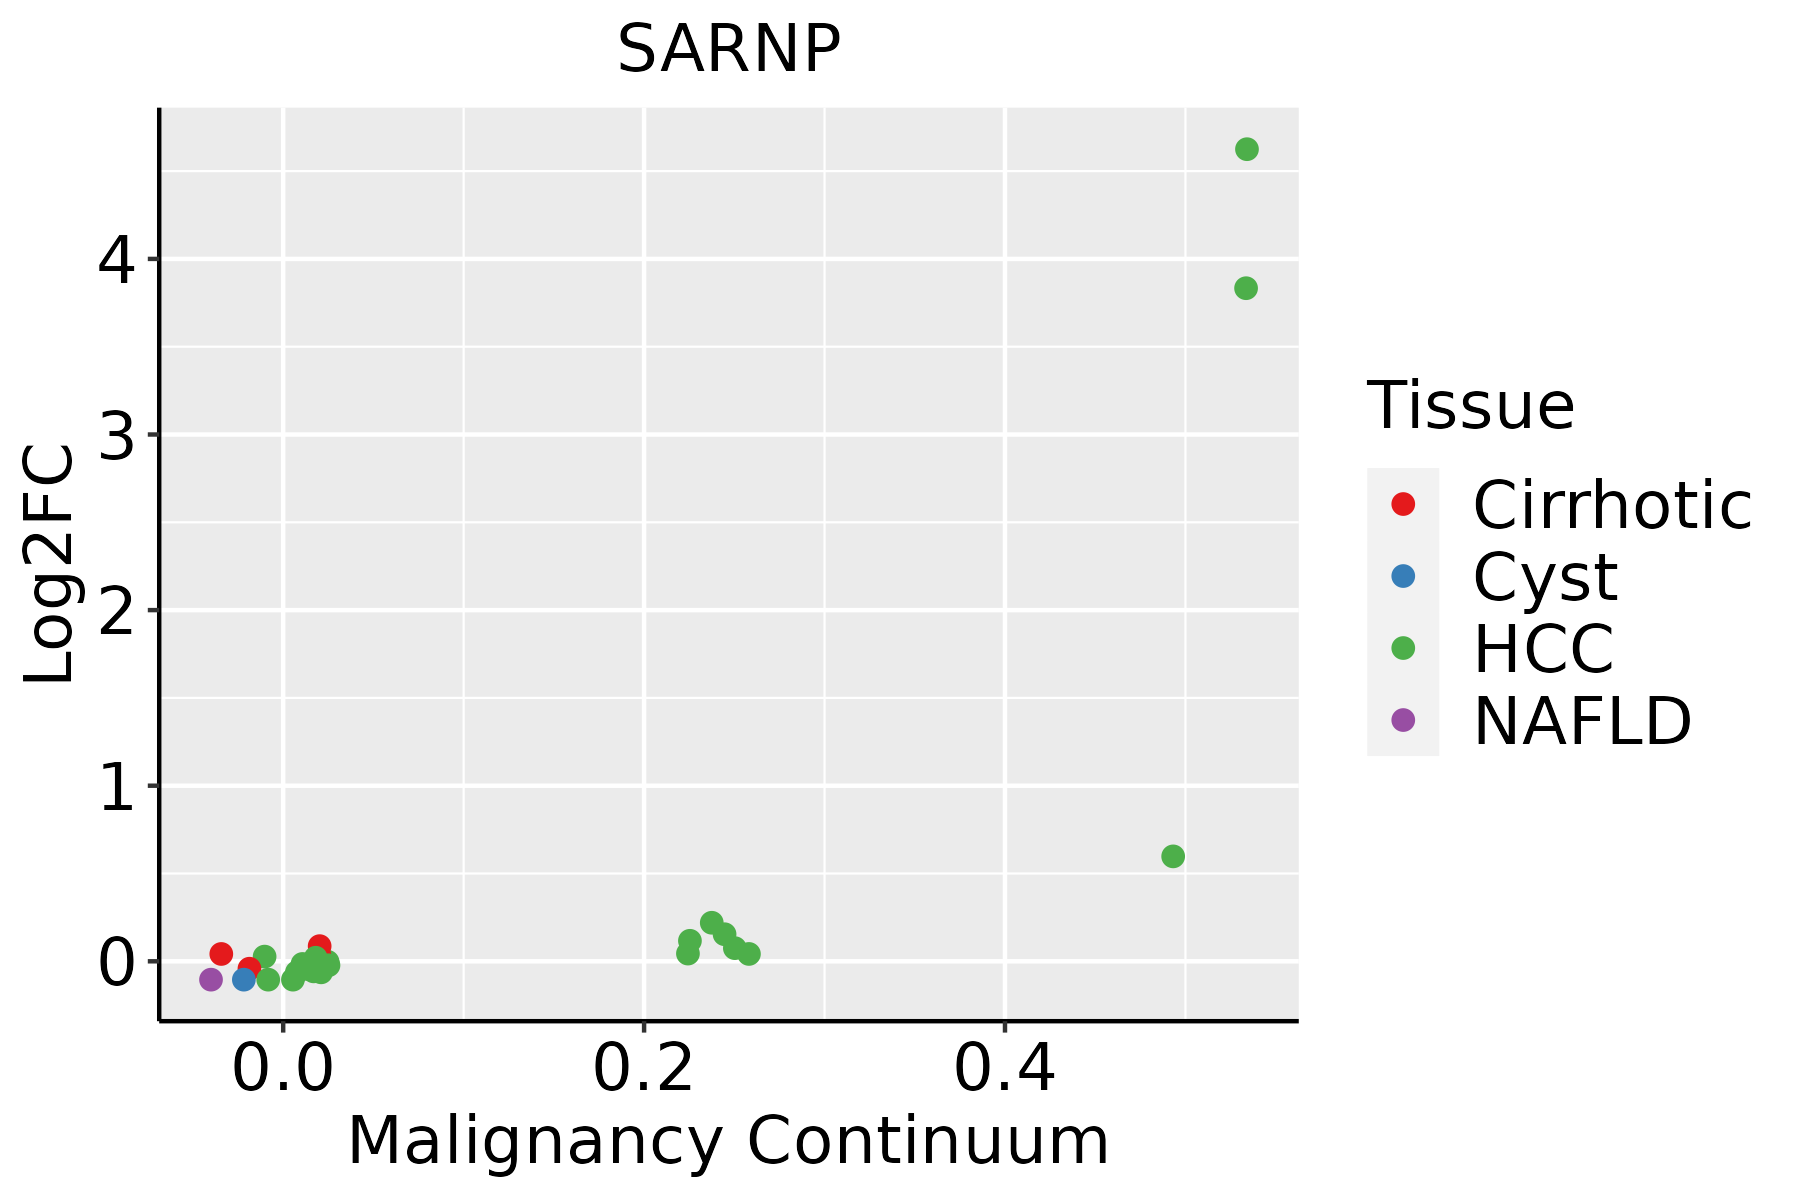 | HCC: Hepatocellular carcinoma |
| NAFLD: Non-alcoholic fatty liver disease | ||
| Lung |  | AAH: Atypical adenomatous hyperplasia |
| AIS: Adenocarcinoma in situ | ||
| IAC: Invasive lung adenocarcinoma | ||
| MIA: Minimally invasive adenocarcinoma |
| ∗log2FC in expression of this searched gene in stem-like cells from each diseased tissue sample relative to stem-like cells in normal samples in each tissue plotted against the malignancy continuum. Samples are colored based on if they are from different disease stage. |
Top |
Malignant transformation related pathway analysis |
| Find out the enriched GO biological processes and KEGG pathways involved in transition from healthy to precancer to cancer |
| Tissue | Disease Stage | Enriched GO biological Processes |
| Colorectum | AD |  |
| Colorectum | SER |  |
| Colorectum | MSS |  |
| Colorectum | MSI-H |  |
| Colorectum | FAP |  |
| ∗Top 15 enriched GO BP terms are showed in the bar plot of each disease state in each tissue. Each row represents a significant GO biological process which is colored according to the -log10(p.adjust). |
| Page: 1 2 3 4 5 6 7 8 9 |
| GO ID | Tissue | Disease Stage | Description | Gene Ratio | Bg Ratio | pvalue | p.adjust | Count |
| GO:000641727 | Esophagus | HGIN | regulation of translation | 139/2587 | 468/18723 | 1.46e-19 | 7.98e-17 | 139 |
| GO:000640320 | Esophagus | HGIN | RNA localization | 66/2587 | 201/18723 | 4.06e-12 | 5.41e-10 | 66 |
| GO:000691319 | Esophagus | HGIN | nucleocytoplasmic transport | 83/2587 | 301/18723 | 2.14e-10 | 1.97e-08 | 83 |
| GO:005116919 | Esophagus | HGIN | nuclear transport | 83/2587 | 301/18723 | 2.14e-10 | 1.97e-08 | 83 |
| GO:005116819 | Esophagus | HGIN | nuclear export | 48/2587 | 154/18723 | 2.21e-08 | 1.34e-06 | 48 |
| GO:005065716 | Esophagus | HGIN | nucleic acid transport | 49/2587 | 163/18723 | 5.71e-08 | 3.06e-06 | 49 |
| GO:005065816 | Esophagus | HGIN | RNA transport | 49/2587 | 163/18723 | 5.71e-08 | 3.06e-06 | 49 |
| GO:005123616 | Esophagus | HGIN | establishment of RNA localization | 49/2587 | 166/18723 | 1.07e-07 | 5.47e-06 | 49 |
| GO:00510288 | Esophagus | HGIN | mRNA transport | 40/2587 | 130/18723 | 4.67e-07 | 2.07e-05 | 40 |
| GO:001593116 | Esophagus | HGIN | nucleobase-containing compound transport | 57/2587 | 222/18723 | 1.76e-06 | 6.52e-05 | 57 |
| GO:00711665 | Esophagus | HGIN | ribonucleoprotein complex localization | 23/2587 | 77/18723 | 2.00e-04 | 3.72e-03 | 23 |
| GO:00315035 | Esophagus | HGIN | protein-containing complex localization | 50/2587 | 220/18723 | 2.18e-04 | 3.98e-03 | 50 |
| GO:00714265 | Esophagus | HGIN | ribonucleoprotein complex export from nucleus | 22/2587 | 76/18723 | 4.44e-04 | 6.62e-03 | 22 |
| GO:00064056 | Esophagus | HGIN | RNA export from nucleus | 23/2587 | 84/18723 | 7.90e-04 | 1.03e-02 | 23 |
| GO:0006913110 | Esophagus | ESCC | nucleocytoplasmic transport | 230/8552 | 301/18723 | 6.04e-28 | 2.02e-25 | 230 |
| GO:0051169110 | Esophagus | ESCC | nuclear transport | 230/8552 | 301/18723 | 6.04e-28 | 2.02e-25 | 230 |
| GO:0006403110 | Esophagus | ESCC | RNA localization | 166/8552 | 201/18723 | 1.95e-27 | 6.18e-25 | 166 |
| GO:005123617 | Esophagus | ESCC | establishment of RNA localization | 134/8552 | 166/18723 | 1.23e-20 | 1.81e-18 | 134 |
| GO:0051168110 | Esophagus | ESCC | nuclear export | 126/8552 | 154/18723 | 1.88e-20 | 2.65e-18 | 126 |
| GO:005102815 | Esophagus | ESCC | mRNA transport | 110/8552 | 130/18723 | 2.76e-20 | 3.80e-18 | 110 |
| Page: 1 2 3 4 |
| Pathway ID | Tissue | Disease Stage | Description | Gene Ratio | Bg Ratio | pvalue | p.adjust | qvalue | Count |
| Page: 1 |
Top |
Cell-cell communication analysis |
| Identification of potential cell-cell interactions between two cell types and their ligand-receptor pairs for different disease states |
| Ligand | Receptor | LRpair | Pathway | Tissue | Disease Stage |
| Page: 1 |
Top |
Single-cell gene regulatory network inference analysis |
| Find out the significant the regulons (TFs) and the target genes of each regulon across cell types for different disease states |
| TF | Cell Type | Tissue | Disease Stage | Target Gene | RSS | Regulon Activity |
| ∗The dot plots of a searched regulon are shown for all cell subpopulations in each disease state of each tissue based on the regulon specific score inferred using pySCENIC and by calculating the average expression. |
| Page: 1 |
Top |
Somatic mutation of malignant transformation related genes |
| Annotation of somatic variants for genes involved in malignant transformation |
| Hugo Symbol | Variant Class | Variant Classification | dbSNP RS | HGVSc | HGVSp | HGVSp Short | SWISSPROT | BIOTYPE | SIFT | PolyPhen | Tumor Sample Barcode | Tissue | Histology | Sex | Age | Stage | Therapy Types | Drugs | Outcome |
| SARNP | SNV | Missense_Mutation | novel | c.19N>A | p.Glu7Lys | p.E7K | P82979 | protein_coding | deleterious(0.01) | benign(0.026) | TCGA-BH-A0HF-01 | Breast | breast invasive carcinoma | Female | >=65 | I/II | Hormone Therapy | arimidex | SD |
| SARNP | SNV | Missense_Mutation | novel | c.207N>C | p.Glu69Asp | p.E69D | P82979 | protein_coding | tolerated(0.35) | benign(0) | TCGA-PL-A8LV-01 | Breast | breast invasive carcinoma | Female | <65 | III/IV | Unknown | Unknown | SD |
| SARNP | SNV | Missense_Mutation | novel | c.460G>A | p.Ala154Thr | p.A154T | P82979 | protein_coding | deleterious(0) | probably_damaging(0.992) | TCGA-C5-A2LY-01 | Cervix | cervical & endocervical cancer | Female | <65 | I/II | Chemotherapy | cisplatin | SD |
| SARNP | SNV | Missense_Mutation | c.322G>A | p.Glu108Lys | p.E108K | P82979 | protein_coding | tolerated(0.3) | benign(0.358) | TCGA-VS-A9UI-01 | Cervix | cervical & endocervical cancer | Female | >=65 | I/II | Unknown | Unknown | SD | |
| SARNP | SNV | Missense_Mutation | novel | c.13A>G | p.Thr5Ala | p.T5A | P82979 | protein_coding | tolerated(0.11) | benign(0.018) | TCGA-A6-A567-01 | Colorectum | colon adenocarcinoma | Male | <65 | III/IV | Unknown | Unknown | PD |
| SARNP | SNV | Missense_Mutation | c.521N>C | p.Leu174Pro | p.L174P | P82979 | protein_coding | deleterious(0) | probably_damaging(0.996) | TCGA-AA-3502-01 | Colorectum | colon adenocarcinoma | Male | >=65 | I/II | Unknown | Unknown | SD | |
| SARNP | SNV | Missense_Mutation | c.65N>T | p.Ala22Val | p.A22V | P82979 | protein_coding | tolerated(0.09) | probably_damaging(0.998) | TCGA-AA-3510-01 | Colorectum | colon adenocarcinoma | Male | >=65 | I/II | Unknown | Unknown | SD | |
| SARNP | SNV | Missense_Mutation | c.371N>T | p.Ala124Val | p.A124V | P82979 | protein_coding | deleterious(0.03) | probably_damaging(0.991) | TCGA-G4-6588-01 | Colorectum | colon adenocarcinoma | Female | <65 | I/II | Unknown | Unknown | SD | |
| SARNP | SNV | Missense_Mutation | c.147N>T | p.Glu49Asp | p.E49D | P82979 | protein_coding | tolerated(0.43) | benign(0.011) | TCGA-EI-6507-01 | Colorectum | rectum adenocarcinoma | Male | <65 | I/II | Unknown | Unknown | SD | |
| SARNP | SNV | Missense_Mutation | c.192A>C | p.Glu64Asp | p.E64D | P82979 | protein_coding | tolerated(0.15) | benign(0.185) | TCGA-AP-A056-01 | Endometrium | uterine corpus endometrioid carcinoma | Female | <65 | I/II | Unknown | Unknown | SD |
| Page: 1 2 3 |
Top |
Related drugs of malignant transformation related genes |
| Identification of chemicals and drugs interact with genes involved in malignant transfromation |
| (DGIdb 4.0) |
| Entrez ID | Symbol | Category | Interaction Types | Drug Claim Name | Drug Name | PMIDs |
| Page: 1 |

Copyright 2023-Present -The University of Texas Health Science Center at Houston |