| Tissue | Expression Dynamics | Abbreviation |
| Breast | 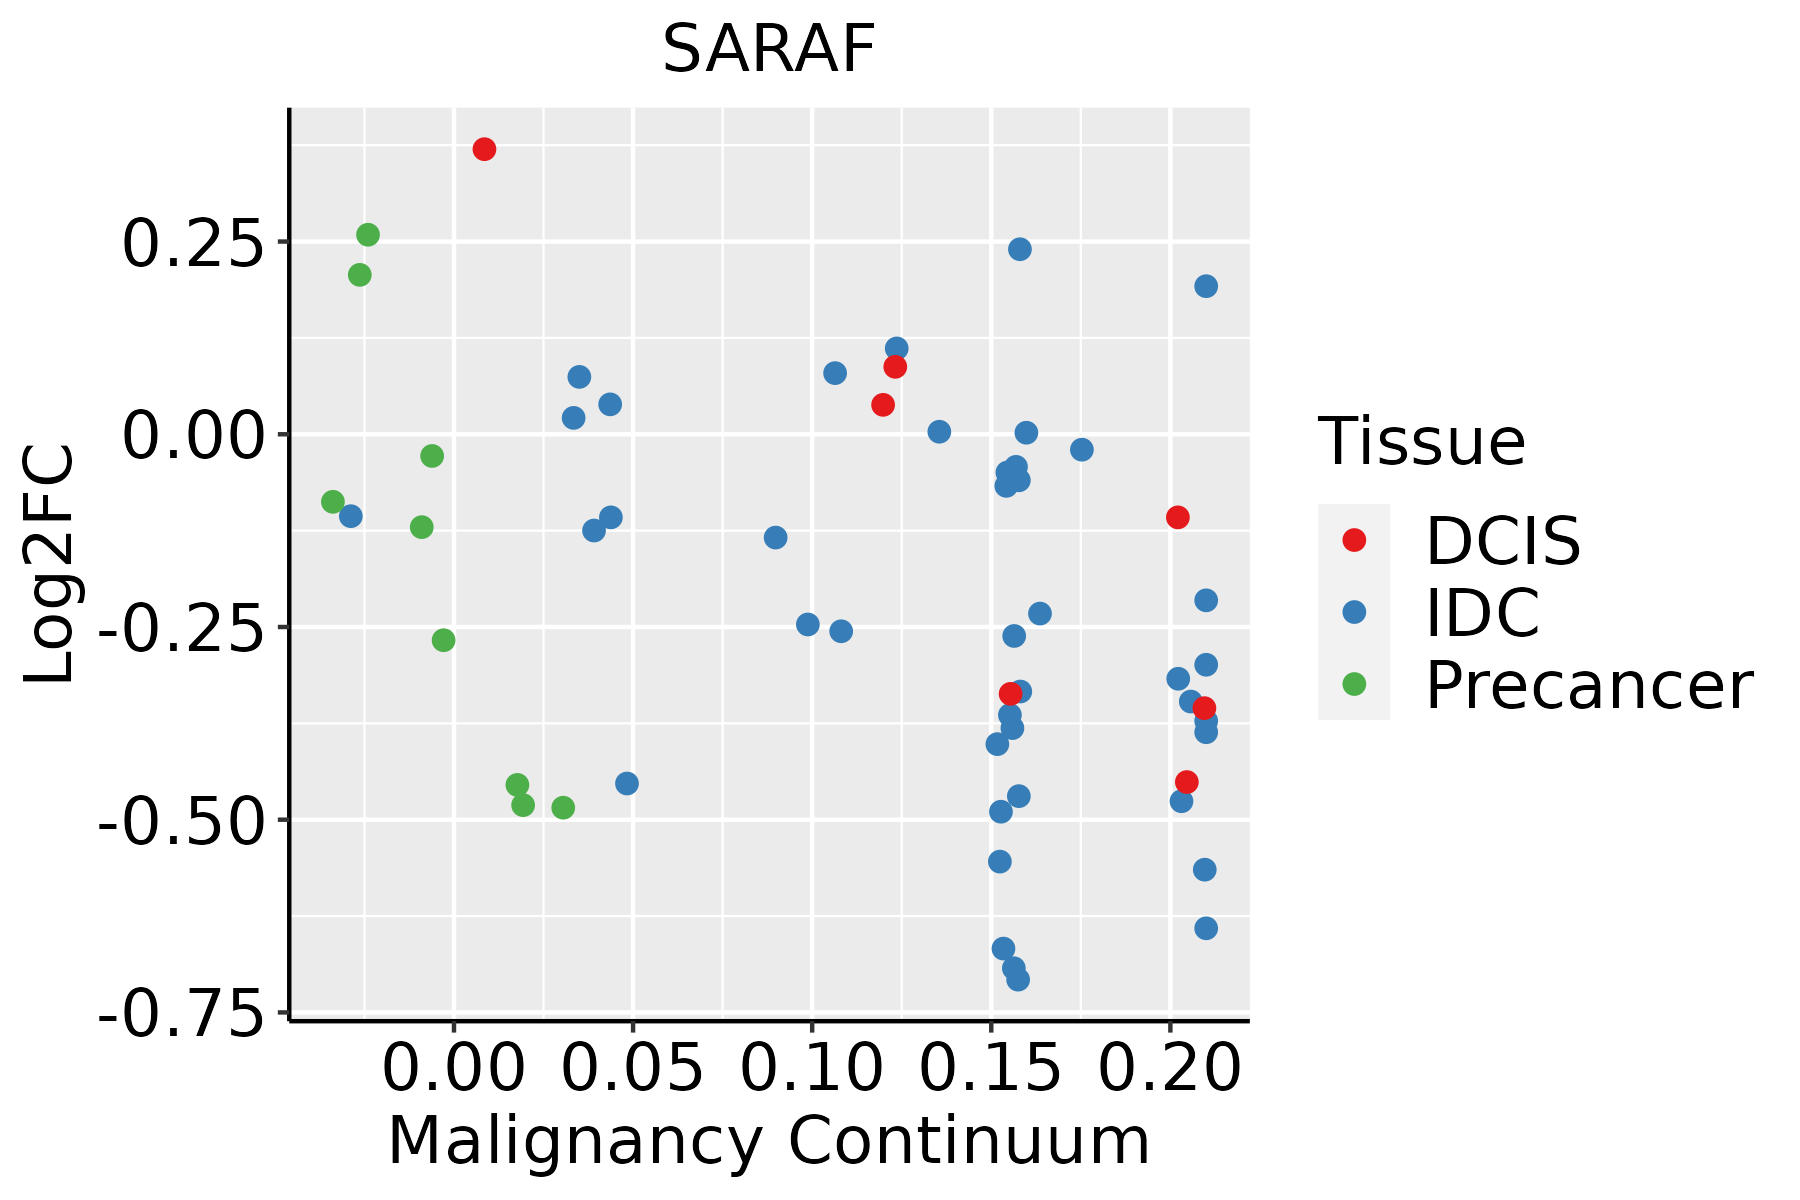 | IDC: Invasive ductal carcinoma |
| DCIS: Ductal carcinoma in situ |
| Precancer(BRCA1-mut): Precancerous lesion from BRCA1 mutation carriers |
| Cervix | 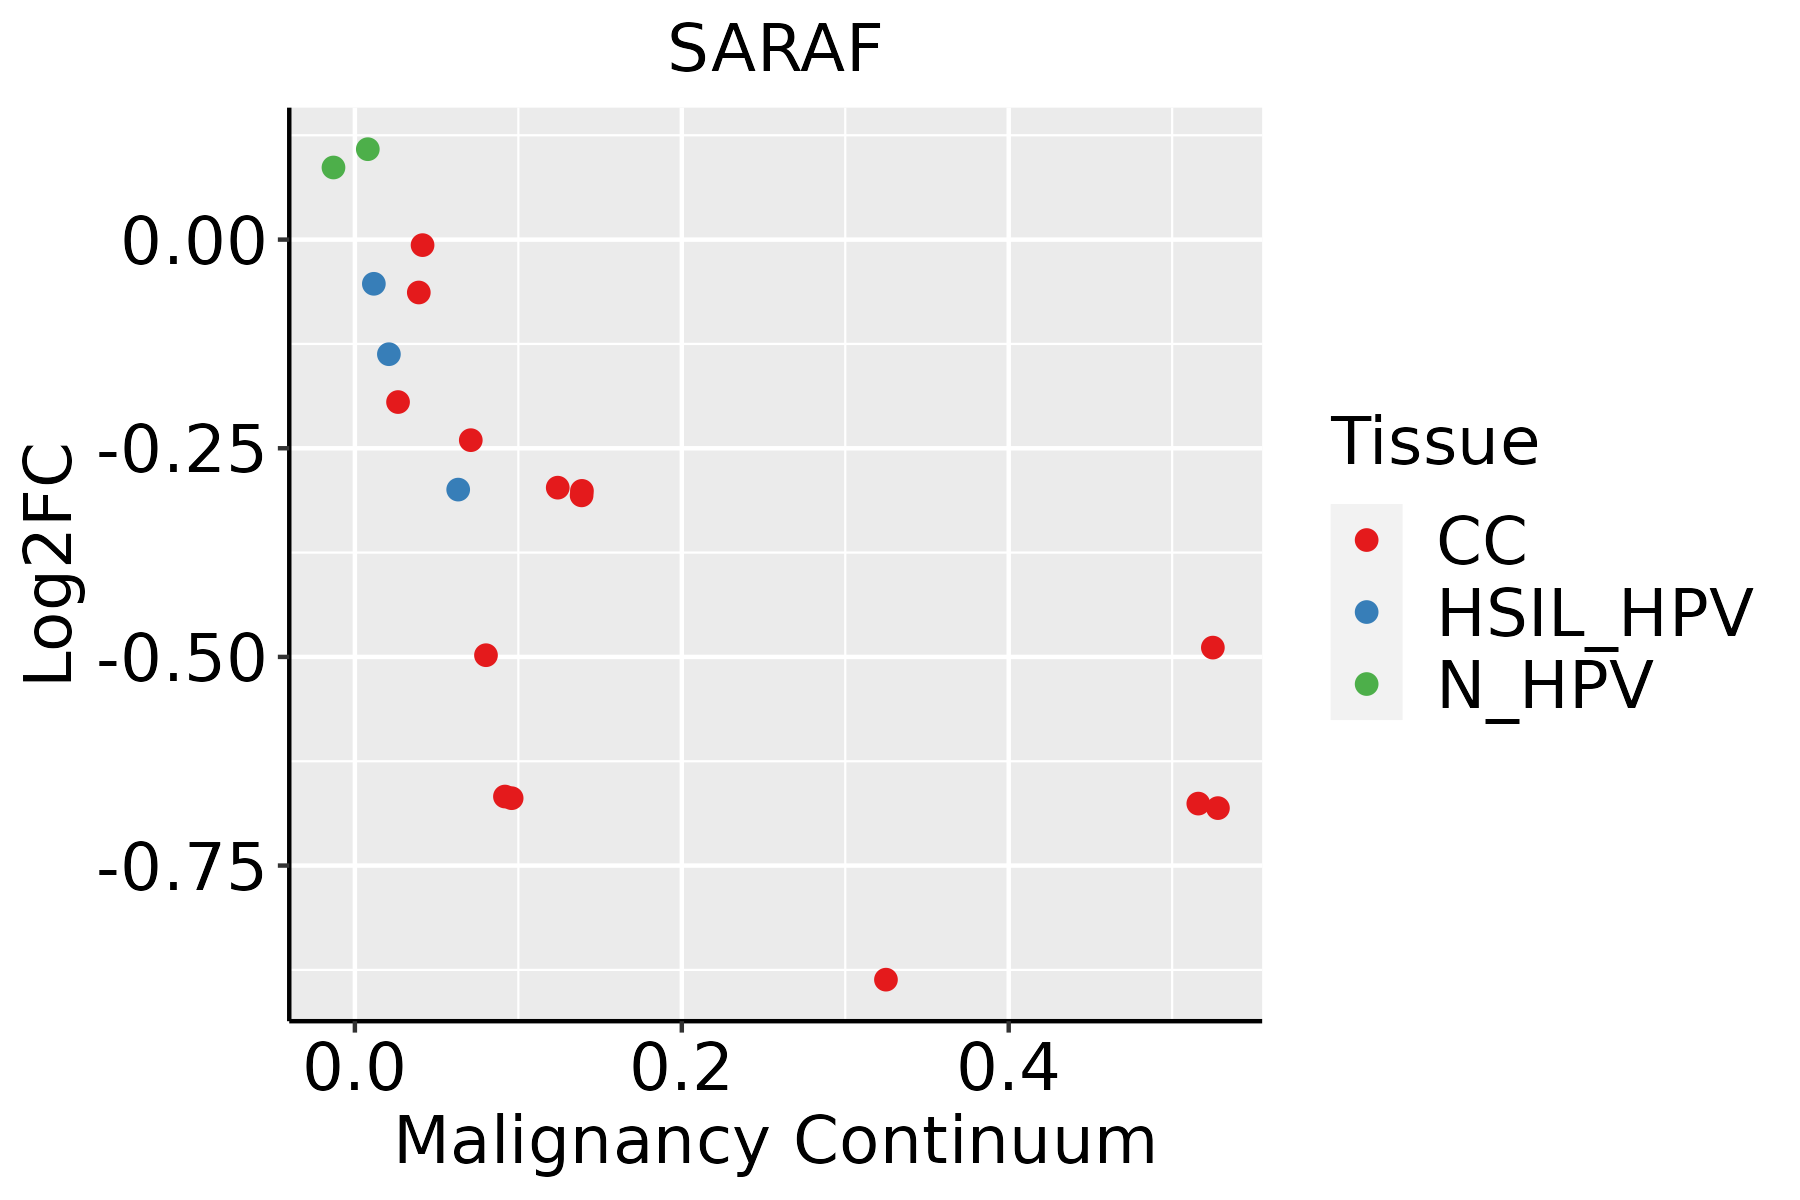 | CC: Cervix cancer |
| HSIL_HPV: HPV-infected high-grade squamous intraepithelial lesions |
| N_HPV: HPV-infected normal cervix |
| Colorectum (GSE201348) |  | FAP: Familial adenomatous polyposis |
| CRC: Colorectal cancer |
| Colorectum (HTA11) | 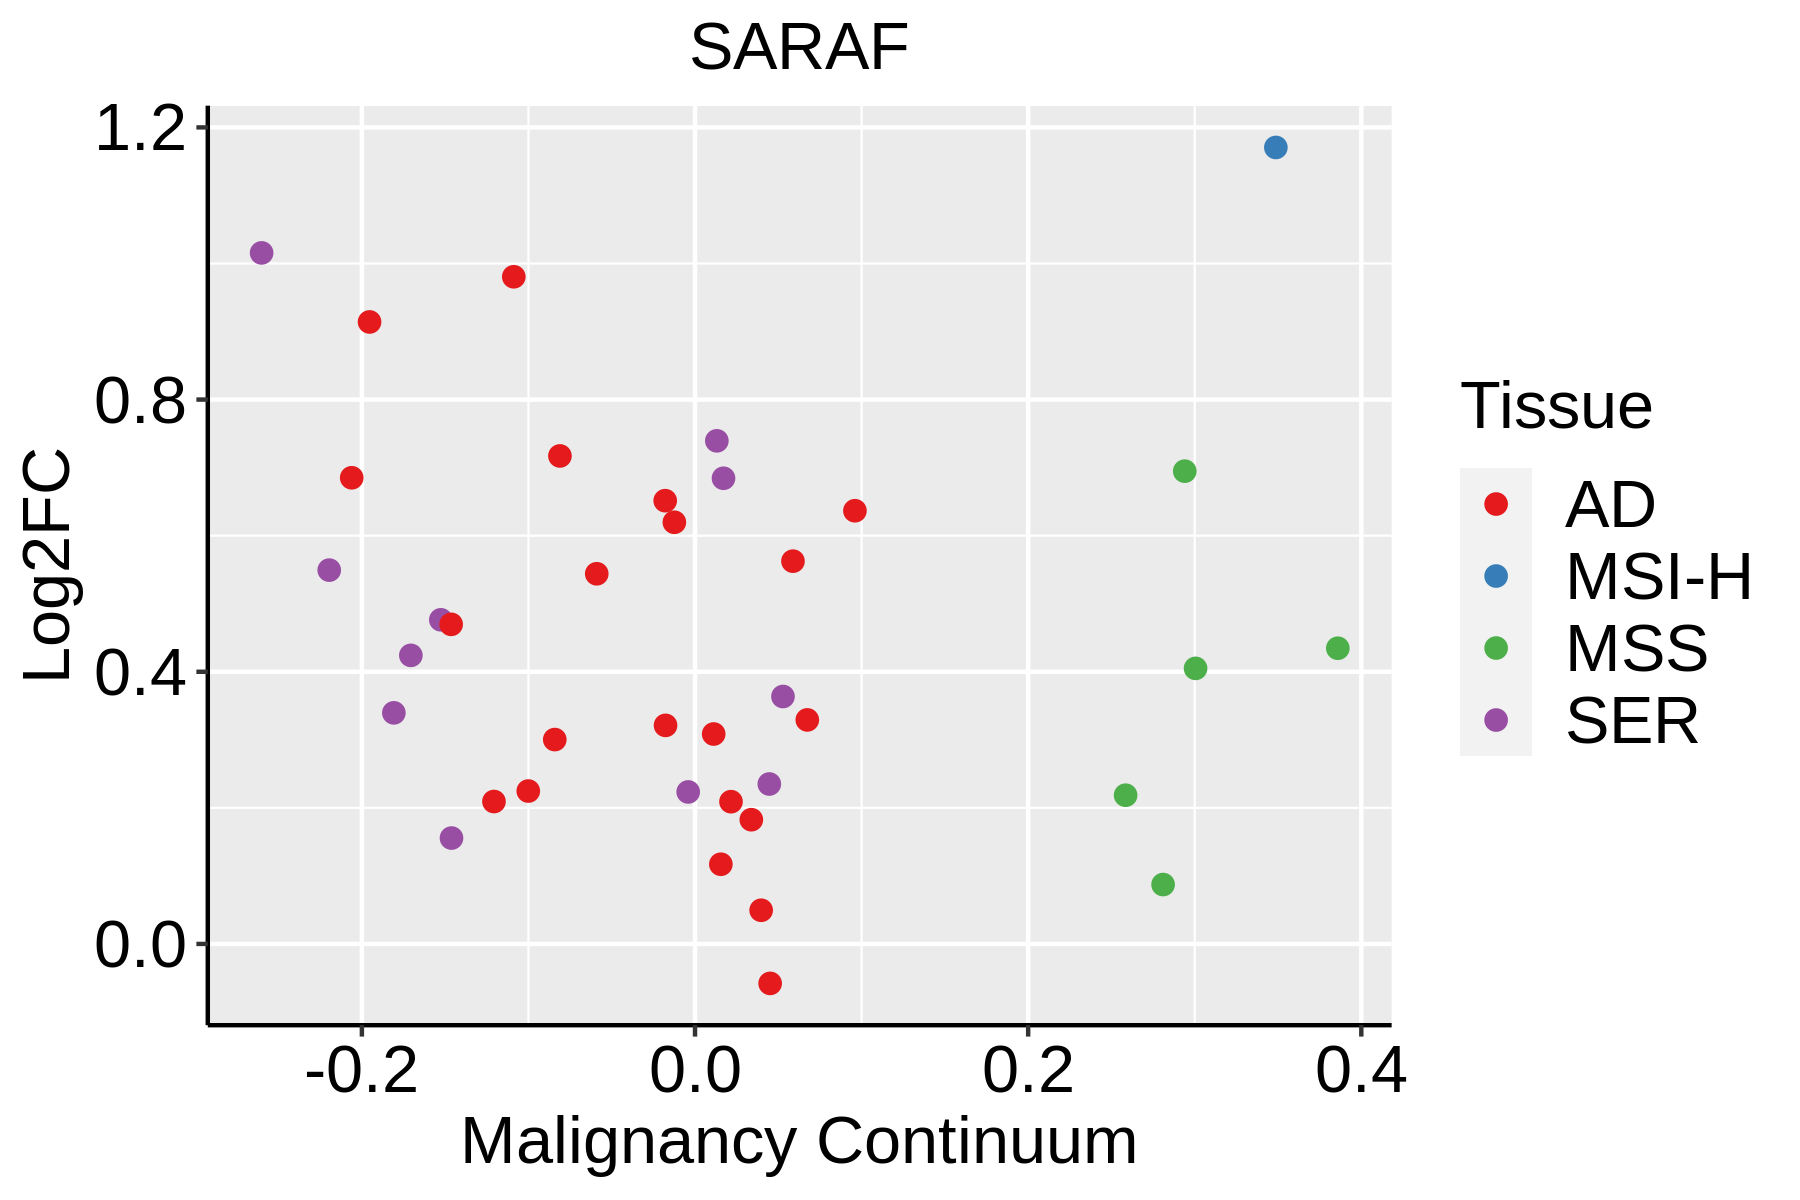 | AD: Adenomas |
| SER: Sessile serrated lesions |
| MSI-H: Microsatellite-high colorectal cancer |
| MSS: Microsatellite stable colorectal cancer |
| Endometrium |  | AEH: Atypical endometrial hyperplasia |
| EEC: Endometrioid Cancer |
| Esophagus | 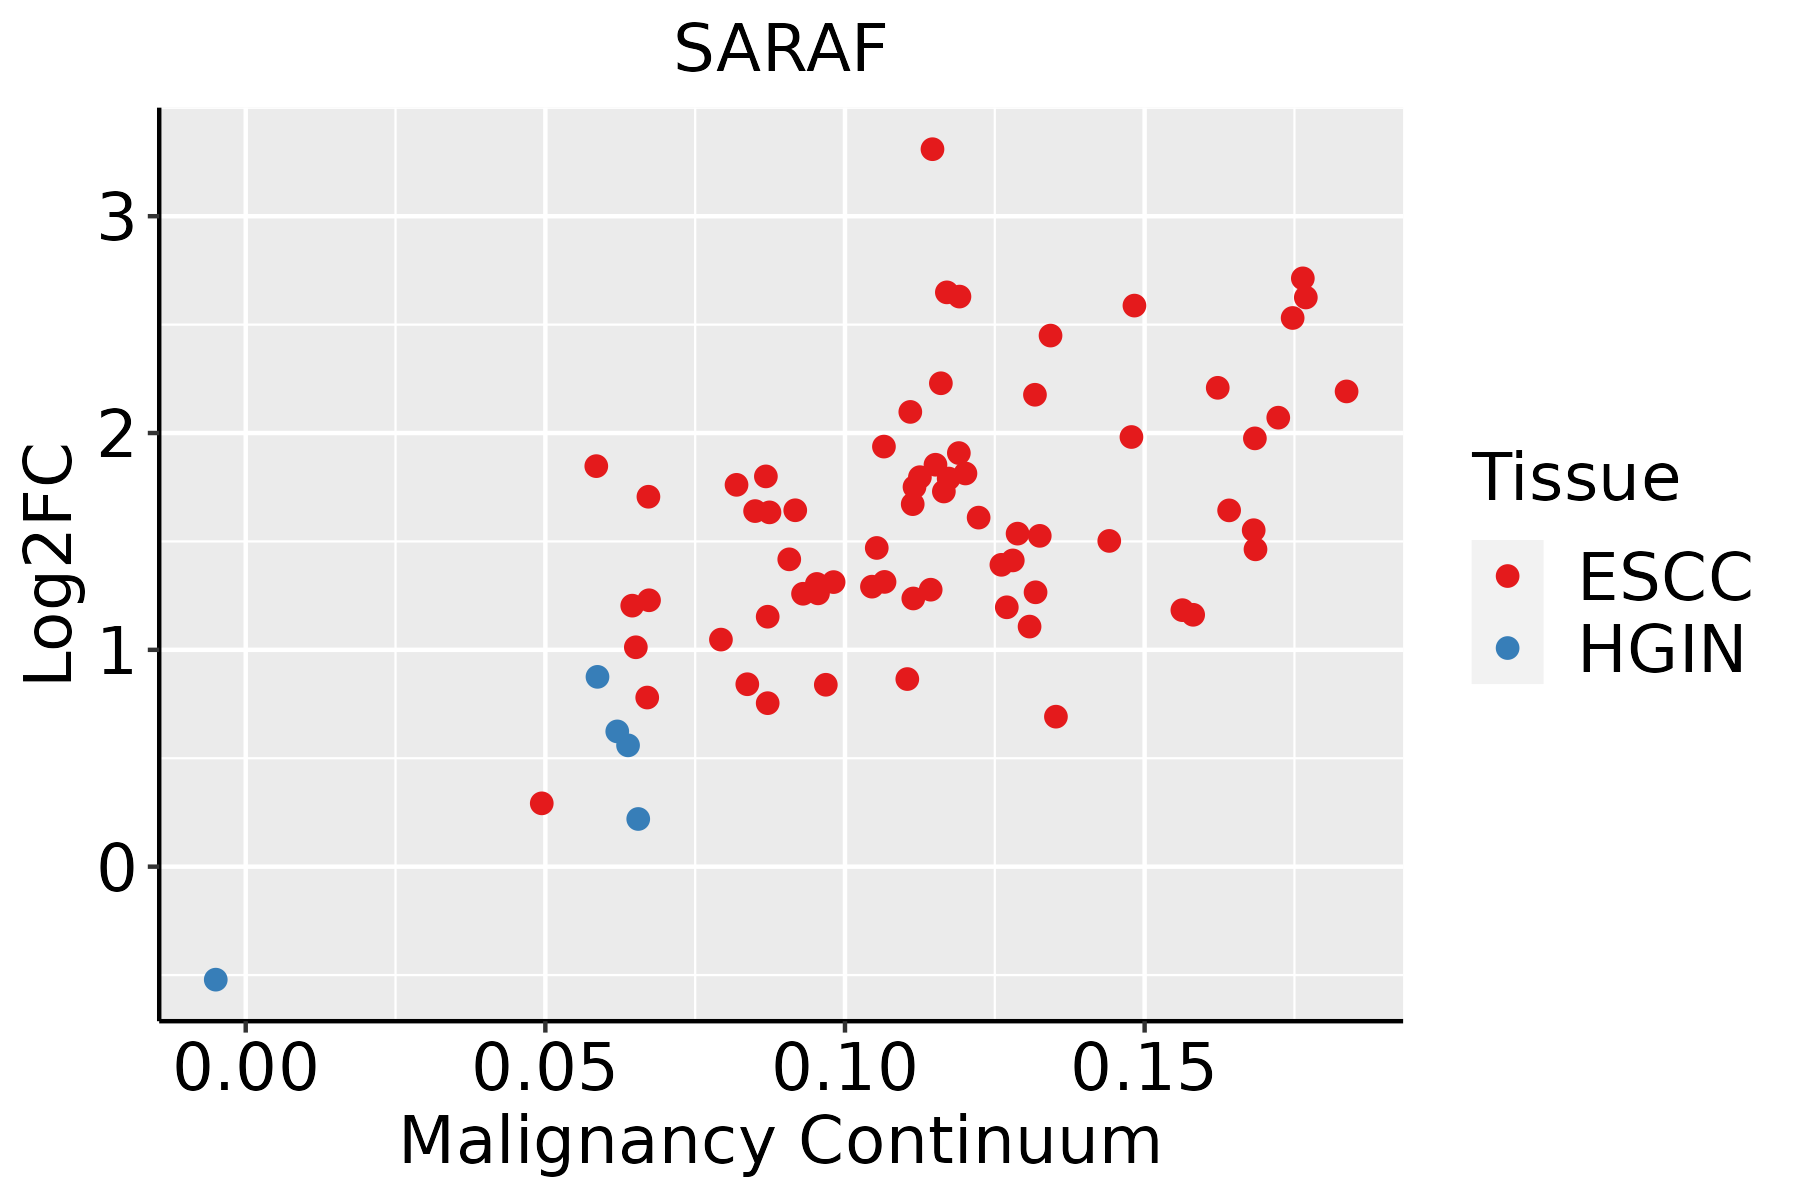 | ESCC: Esophageal squamous cell carcinoma |
| HGIN: High-grade intraepithelial neoplasias |
| LGIN: Low-grade intraepithelial neoplasias |
| GC |  | CAG: Chronic atrophic gastritis |
| CAG with IM: Chronic atrophic gastritis with intestinal metaplasia |
| CSG: Chronic superficial gastritis |
| GC: Gastric cancer |
| SIM: Severe intestinal metaplasia |
| WIM: Wild intestinal metaplasia |
| Liver | 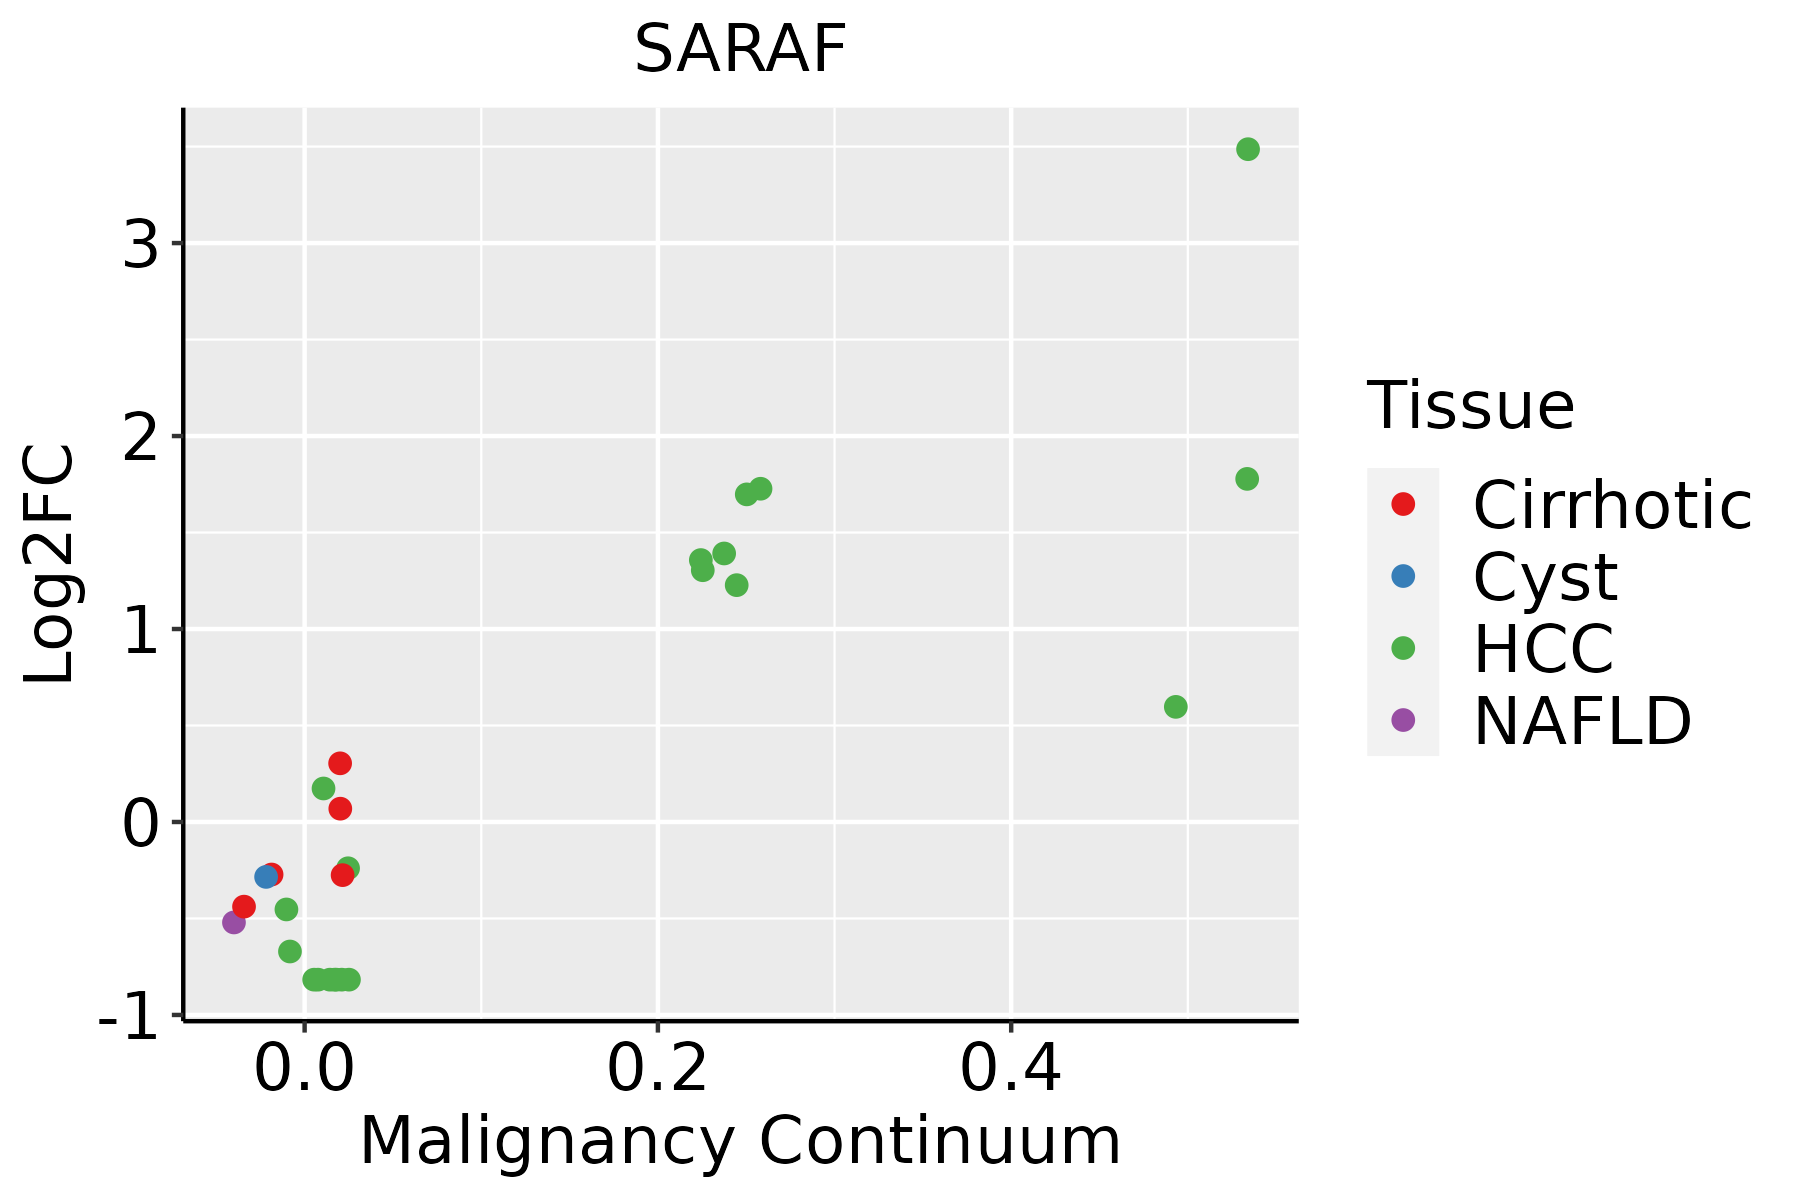 | HCC: Hepatocellular carcinoma |
| NAFLD: Non-alcoholic fatty liver disease |
| Oral Cavity | 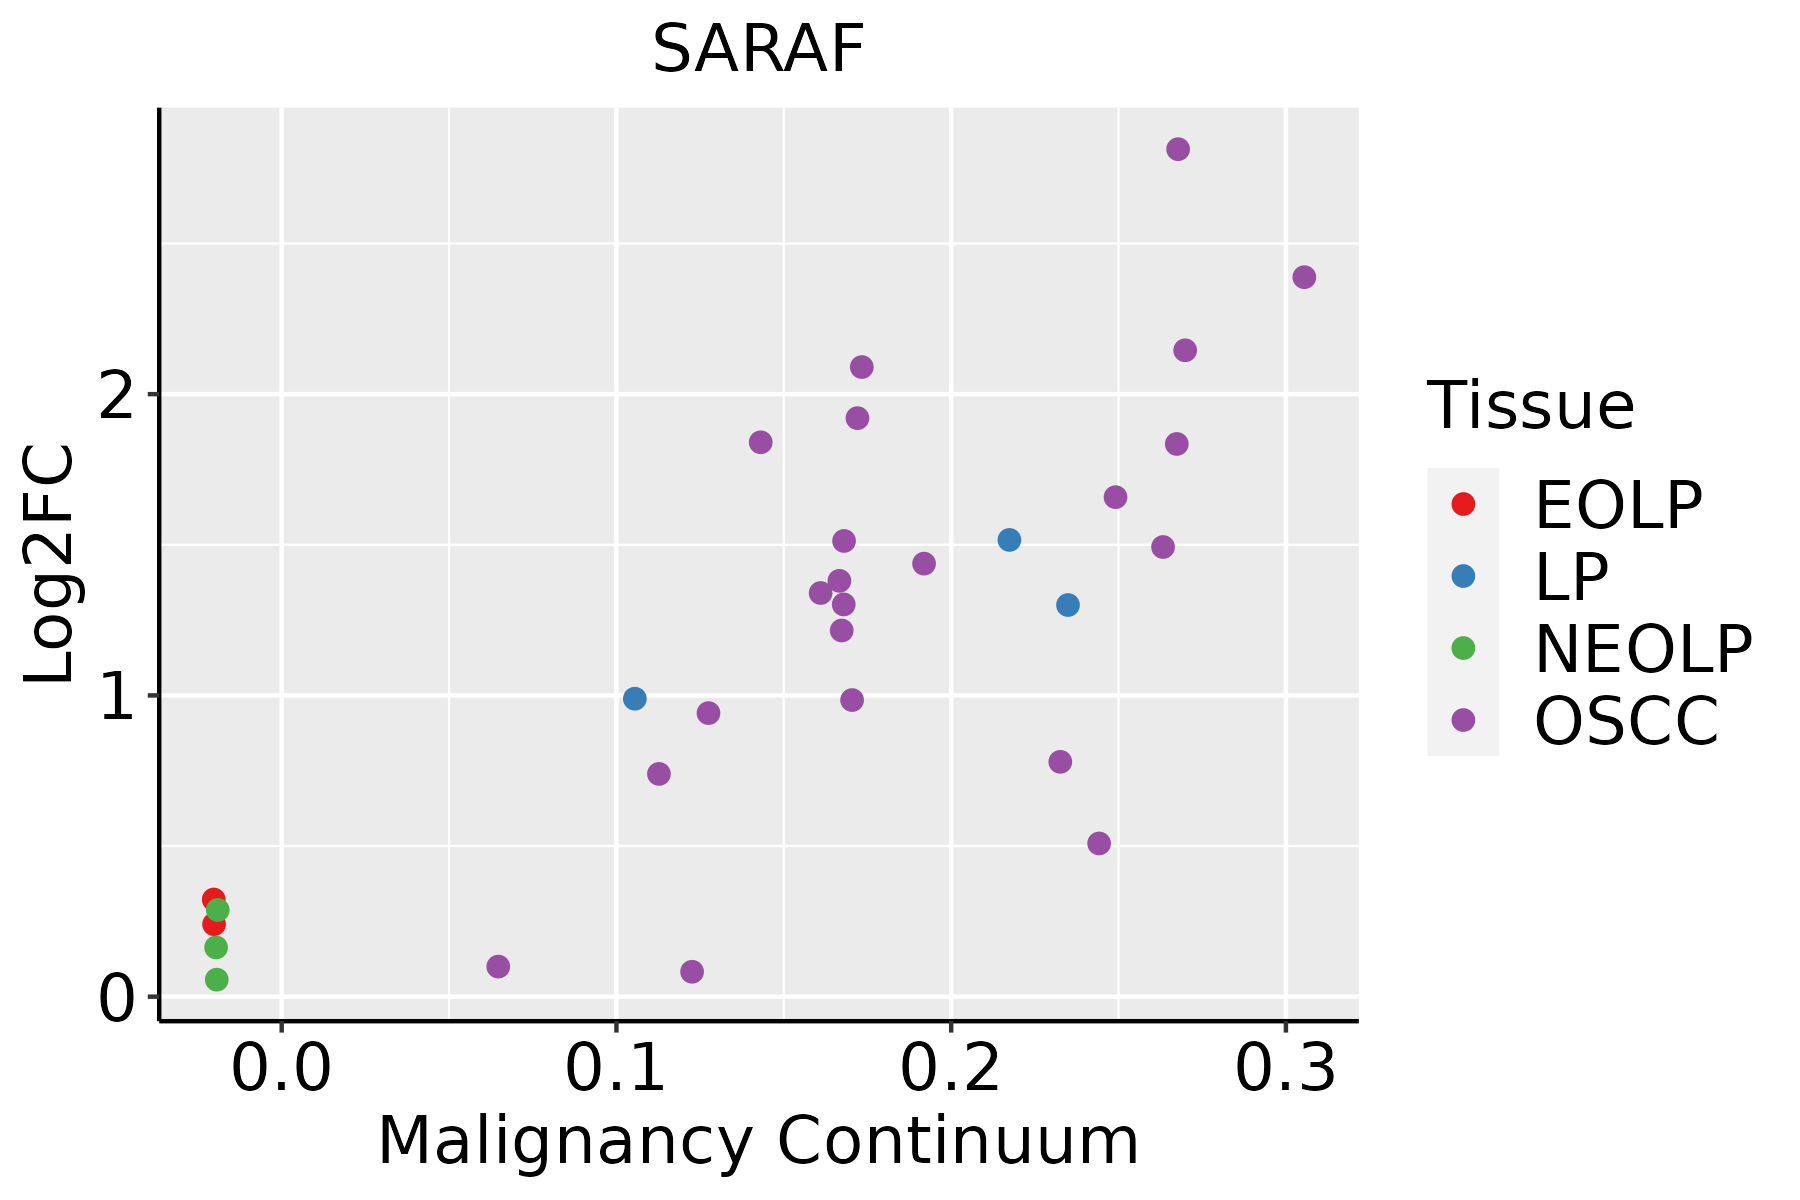 | EOLP: Erosive Oral lichen planus |
| LP: leukoplakia |
| NEOLP: Non-erosive oral lichen planus |
| OSCC: Oral squamous cell carcinoma |
| Prostate | 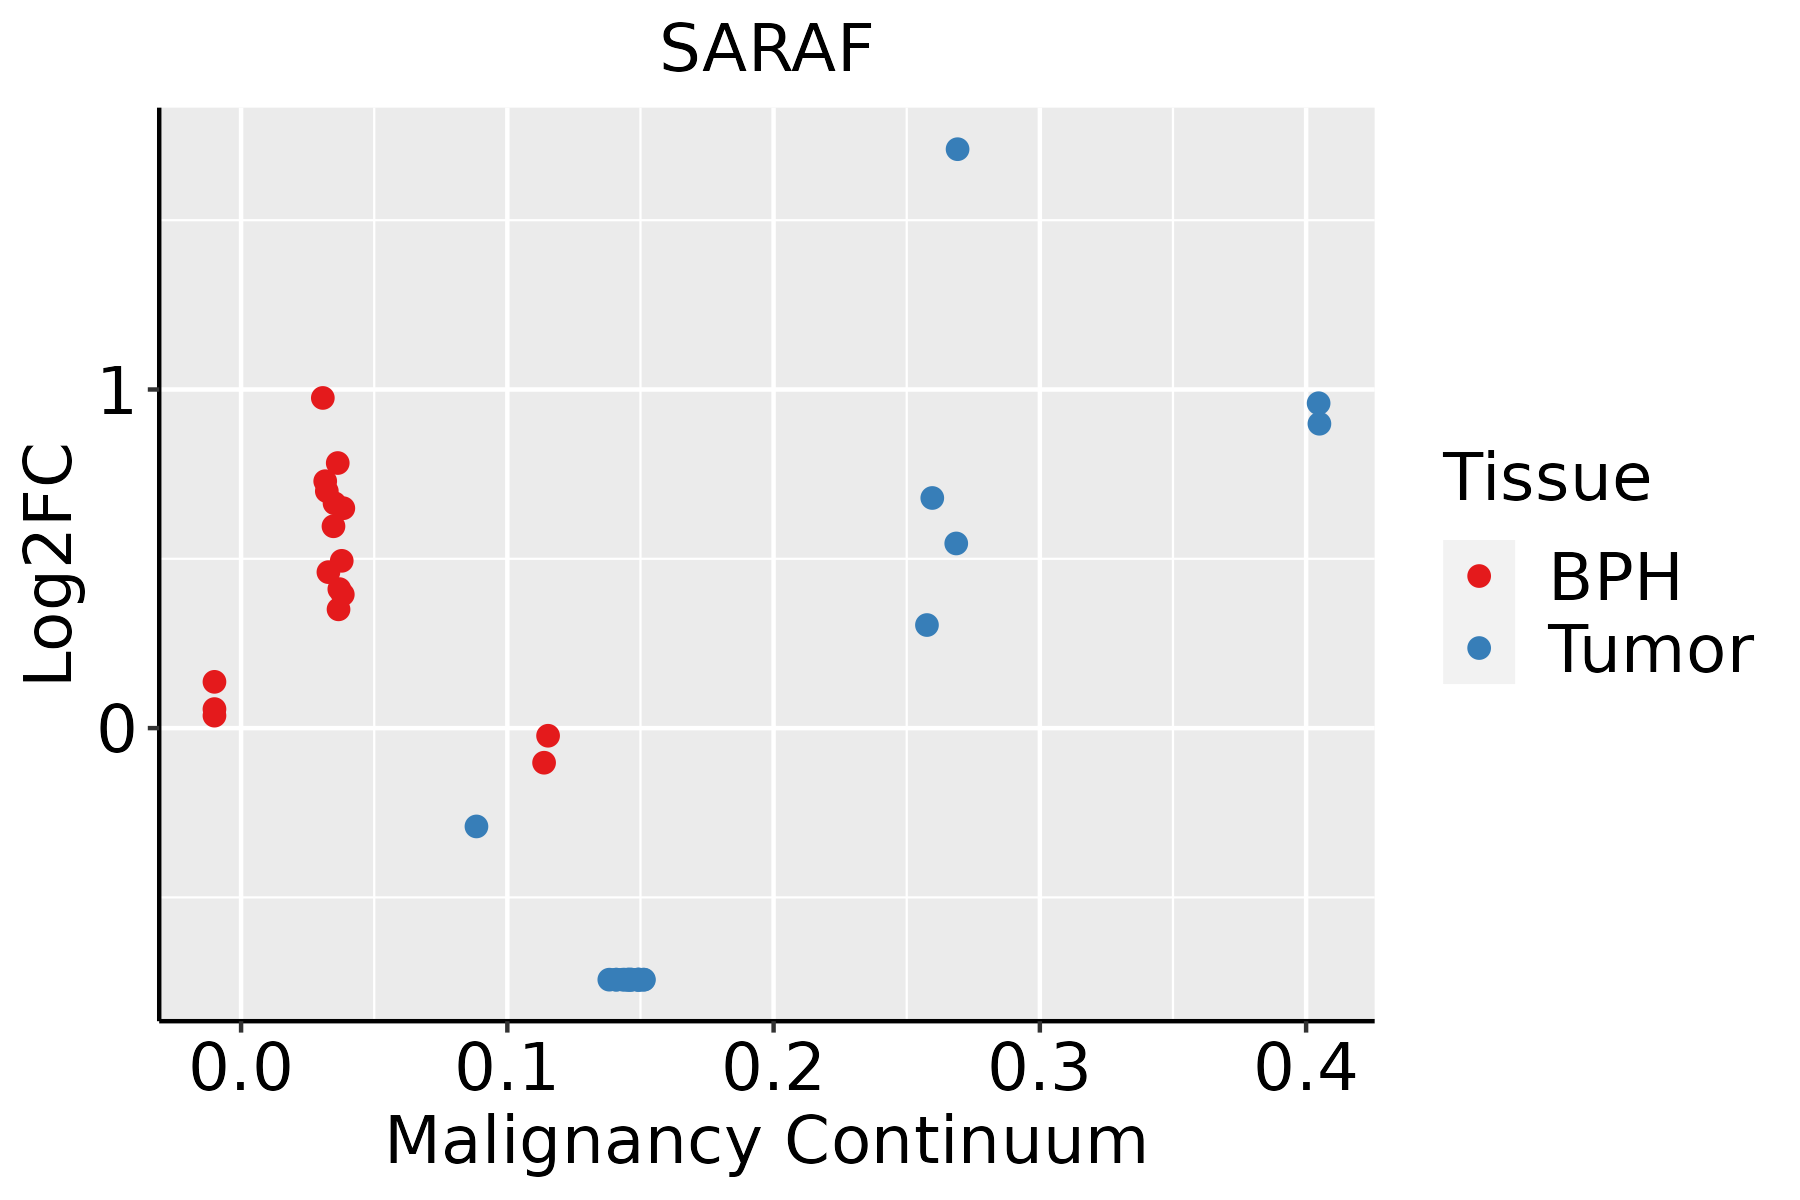 | BPH: Benign Prostatic Hyperplasia |
| Thyroid | 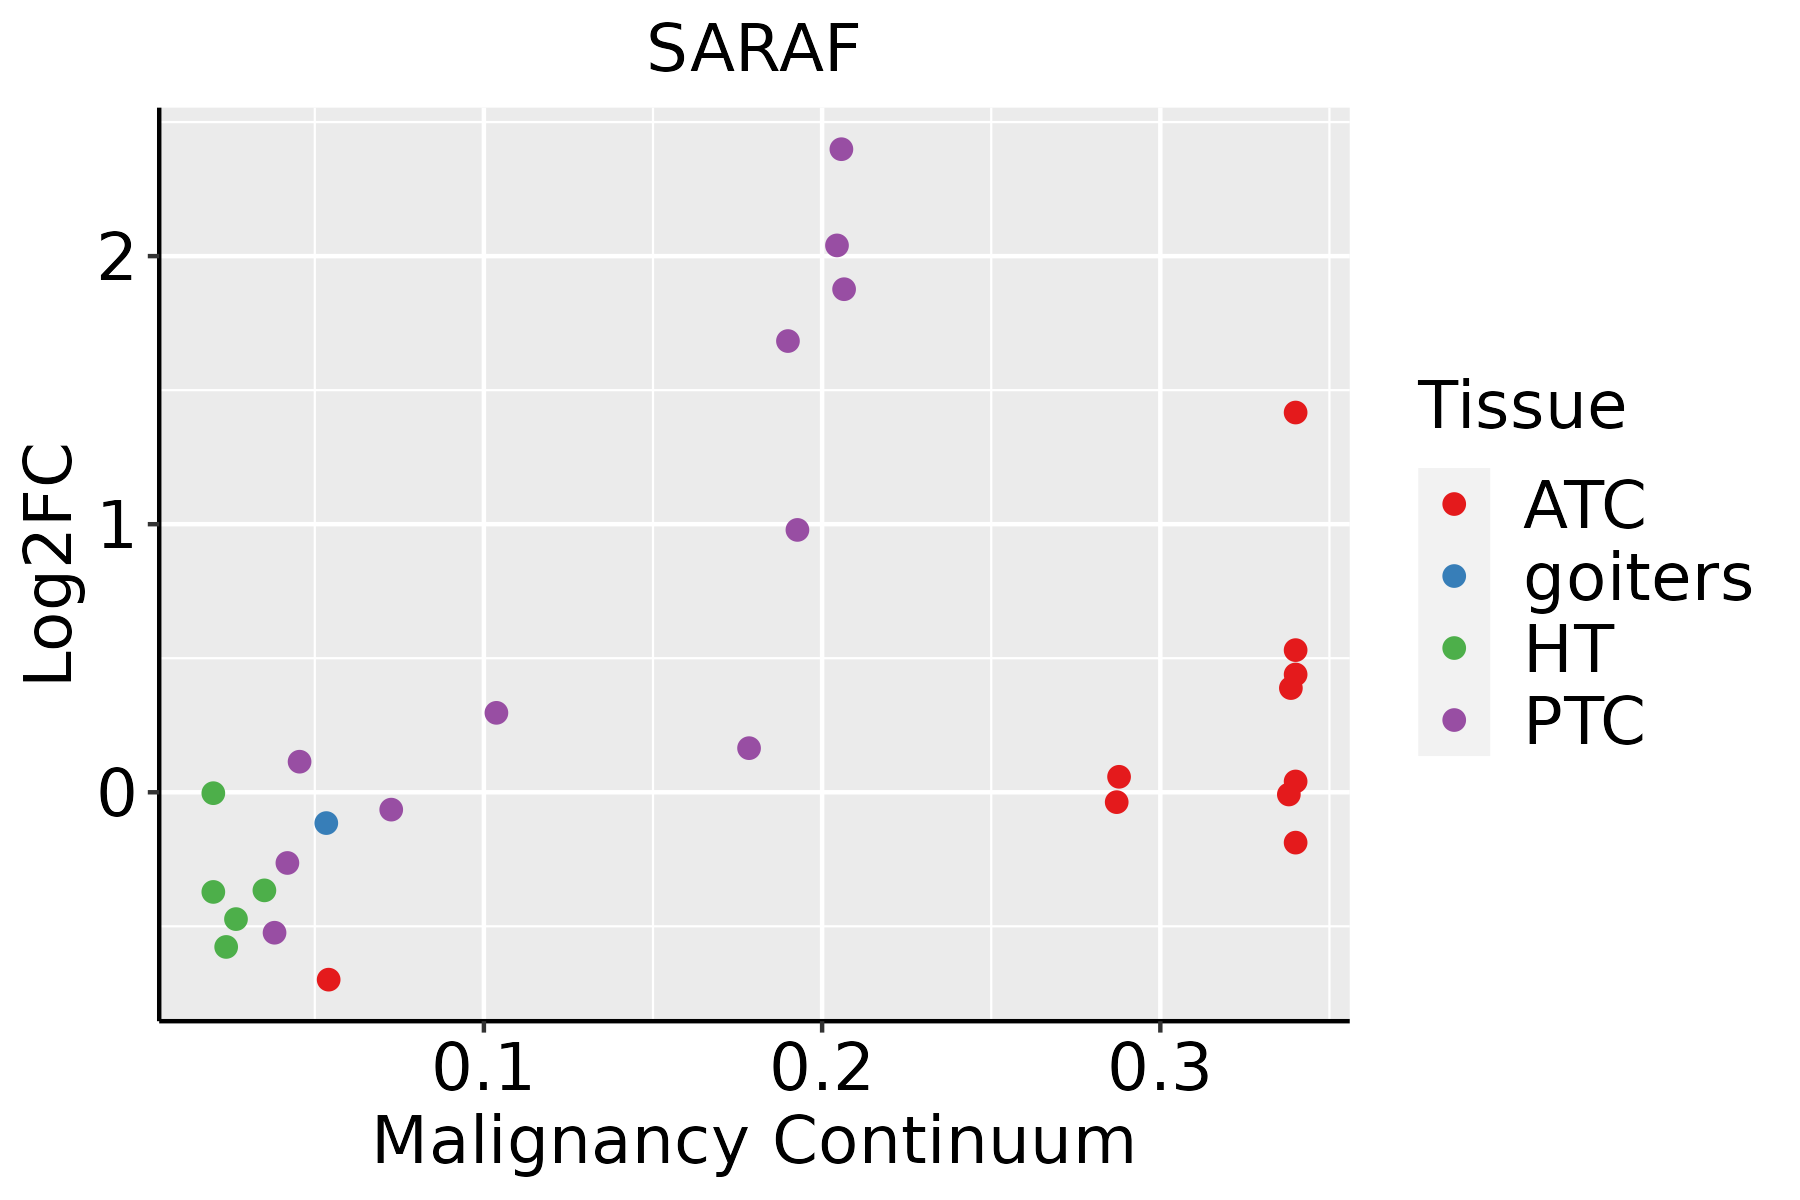 | ATC: Anaplastic thyroid cancer |
| HT: Hashimoto's thyroiditis |
| PTC: Papillary thyroid cancer |
| GO ID | Tissue | Disease Stage | Description | Gene Ratio | Bg Ratio | pvalue | p.adjust | Count |
| GO:001095913 | Breast | IDC | regulation of metal ion transport | 52/1434 | 406/18723 | 1.76e-04 | 2.97e-03 | 52 |
| GO:0051924 | Breast | IDC | regulation of calcium ion transport | 32/1434 | 255/18723 | 3.94e-03 | 3.22e-02 | 32 |
| GO:001095921 | Breast | DCIS | regulation of metal ion transport | 50/1390 | 406/18723 | 2.86e-04 | 4.22e-03 | 50 |
| GO:0010959 | Colorectum | FAP | regulation of metal ion transport | 83/2622 | 406/18723 | 2.06e-04 | 2.96e-03 | 83 |
| GO:00109597 | Endometrium | AEH | regulation of metal ion transport | 66/2100 | 406/18723 | 1.24e-03 | 1.07e-02 | 66 |
| GO:001095914 | Endometrium | EEC | regulation of metal ion transport | 70/2168 | 406/18723 | 4.12e-04 | 4.35e-03 | 70 |
| GO:00109598 | Oral cavity | NEOLP | regulation of metal ion transport | 59/2005 | 406/18723 | 9.36e-03 | 4.44e-02 | 59 |
| GO:00109594 | Stomach | GC | regulation of metal ion transport | 39/1159 | 406/18723 | 4.34e-03 | 3.58e-02 | 39 |
| GO:001095911 | Stomach | CAG with IM | regulation of metal ion transport | 36/1050 | 406/18723 | 4.52e-03 | 3.77e-02 | 36 |
| GO:00109592 | Stomach | CSG | regulation of metal ion transport | 36/1034 | 406/18723 | 3.54e-03 | 3.18e-02 | 36 |
| GO:00109593 | Stomach | CAG | regulation of metal ion transport | 23/552 | 406/18723 | 2.26e-03 | 2.50e-02 | 23 |
| Hugo Symbol | Variant Class | Variant Classification | dbSNP RS | HGVSc | HGVSp | HGVSp Short | SWISSPROT | BIOTYPE | SIFT | PolyPhen | Tumor Sample Barcode | Tissue | Histology | Sex | Age | Stage | Therapy Types | Drugs | Outcome |
| SARAF | SNV | Missense_Mutation | | c.781N>T | p.Pro261Ser | p.P261S | Q96BY9 | protein_coding | deleterious(0.02) | probably_damaging(0.999) | TCGA-A7-A0DA-01 | Breast | breast invasive carcinoma | Female | <65 | I/II | Chemotherapy | adriamycin | SD |
| SARAF | insertion | Nonsense_Mutation | novel | c.416_417insGTTAGCCTA | p.Thr139_Glu140insLeuAlaTer | p.T139_E140insLA* | Q96BY9 | protein_coding | | | TCGA-B6-A0IA-01 | Breast | breast invasive carcinoma | Female | <65 | I/II | Unknown | Unknown | SD |
| SARAF | insertion | Frame_Shift_Ins | novel | c.414_415insGCTAAGGAAAATAAATTGTGGTG | p.Thr139AlafsTer8 | p.T139Afs*8 | Q96BY9 | protein_coding | | | TCGA-B6-A0IA-01 | Breast | breast invasive carcinoma | Female | <65 | I/II | Unknown | Unknown | SD |
| SARAF | SNV | Missense_Mutation | | c.50N>A | p.Gly17Asp | p.G17D | Q96BY9 | protein_coding | tolerated(0.49) | benign(0.003) | TCGA-AA-3663-01 | Colorectum | colon adenocarcinoma | Male | <65 | I/II | Unknown | Unknown | SD |
| SARAF | SNV | Missense_Mutation | novel | c.197N>T | p.Cys66Phe | p.C66F | Q96BY9 | protein_coding | deleterious(0) | probably_damaging(0.999) | TCGA-AA-3947-01 | Colorectum | colon adenocarcinoma | Female | <65 | I/II | Unknown | Unknown | SD |
| SARAF | SNV | Missense_Mutation | | c.556G>A | p.Ala186Thr | p.A186T | Q96BY9 | protein_coding | deleterious(0.01) | probably_damaging(0.994) | TCGA-A5-A0G2-01 | Endometrium | uterine corpus endometrioid carcinoma | Female | <65 | III/IV | Unknown | Unknown | SD |
| SARAF | SNV | Missense_Mutation | novel | c.584G>T | p.Ser195Ile | p.S195I | Q96BY9 | protein_coding | deleterious(0) | possibly_damaging(0.876) | TCGA-A5-A2K5-01 | Endometrium | uterine corpus endometrioid carcinoma | Female | >=65 | I/II | Unknown | Unknown | SD |
| SARAF | SNV | Missense_Mutation | novel | c.167N>A | p.Arg56His | p.R56H | Q96BY9 | protein_coding | deleterious(0) | probably_damaging(0.999) | TCGA-AJ-A3BH-01 | Endometrium | uterine corpus endometrioid carcinoma | Female | Unknown | I/II | Unknown | Unknown | SD |
| SARAF | SNV | Missense_Mutation | | c.781N>A | p.Pro261Thr | p.P261T | Q96BY9 | protein_coding | deleterious(0.04) | probably_damaging(0.999) | TCGA-AP-A051-01 | Endometrium | uterine corpus endometrioid carcinoma | Female | >=65 | I/II | Unknown | Unknown | SD |
| SARAF | SNV | Missense_Mutation | novel | c.304G>T | p.Asp102Tyr | p.D102Y | Q96BY9 | protein_coding | deleterious(0) | probably_damaging(0.998) | TCGA-AX-A0J0-01 | Endometrium | uterine corpus endometrioid carcinoma | Female | <65 | I/II | Unknown | Unknown | SD |


