
|
|||||
|
 | |
| |
| |
| |
| |
| |
|
Gene: SAPCD2 |
Gene summary for SAPCD2 |
| Gene information | Species | Human | Gene symbol | SAPCD2 | Gene ID | 89958 |
| Gene name | suppressor APC domain containing 2 | |
| Gene Alias | C9orf140 | |
| Cytomap | 9q34.3 | |
| Gene Type | protein-coding | GO ID | GO:0000132 | UniProtAcc | Q86UD0 |
Top |
Malignant transformation analysis |
| Identification of the aberrant gene expression in precancerous and cancerous lesions by comparing the gene expression of stem-like cells in diseased tissues with normal stem cells |
| Entrez ID | Symbol | Replicates | Species | Organ | Tissue | Adj P-value | Log2FC | Malignancy |
| 89958 | SAPCD2 | P1_cSCC | Human | Skin | cSCC | 4.55e-06 | 2.31e-01 | 0.0292 |
| 89958 | SAPCD2 | P2_cSCC | Human | Skin | cSCC | 5.18e-10 | 2.30e-01 | -0.024 |
| 89958 | SAPCD2 | P4_cSCC | Human | Skin | cSCC | 1.29e-04 | 1.78e-01 | -0.00290000000000005 |
| Page: 1 |
| Tissue | Expression Dynamics | Abbreviation |
| Skin | 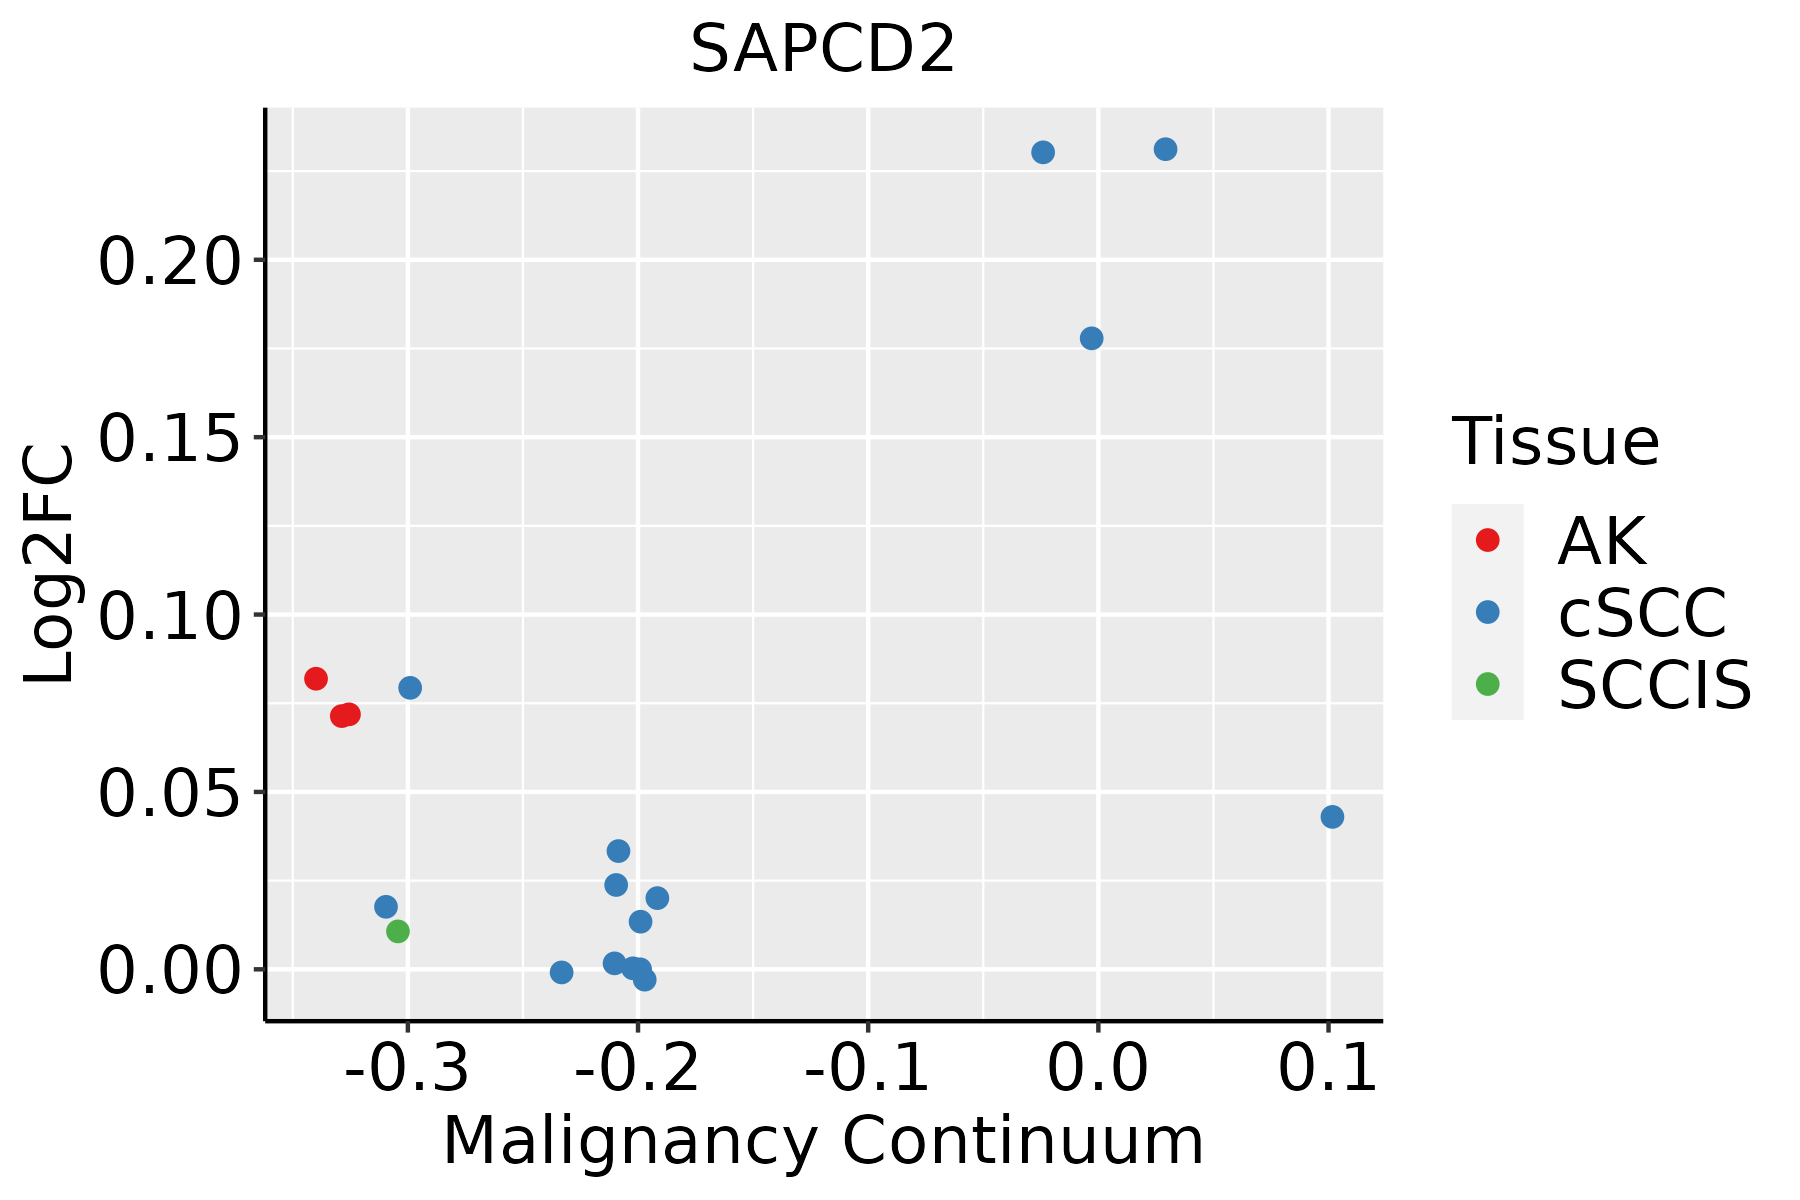 | AK: Actinic keratosis |
| cSCC: Cutaneous squamous cell carcinoma | ||
| SCCIS:squamous cell carcinoma in situ |
| ∗log2FC in expression of this searched gene in stem-like cells from each diseased tissue sample relative to stem-like cells in normal samples in each tissue plotted against the malignancy continuum. Samples are colored based on if they are from different disease stage. |
Top |
Malignant transformation related pathway analysis |
| Find out the enriched GO biological processes and KEGG pathways involved in transition from healthy to precancer to cancer |
| Tissue | Disease Stage | Enriched GO biological Processes |
| Colorectum | AD |  |
| Colorectum | SER |  |
| Colorectum | MSS |  |
| Colorectum | MSI-H |  |
| Colorectum | FAP |  |
| ∗Top 15 enriched GO BP terms are showed in the bar plot of each disease state in each tissue. Each row represents a significant GO biological process which is colored according to the -log10(p.adjust). |
| Page: 1 2 3 4 5 6 7 8 9 |
| GO ID | Tissue | Disease Stage | Description | Gene Ratio | Bg Ratio | pvalue | p.adjust | Count |
| GO:005165624 | Skin | cSCC | establishment of organelle localization | 178/4864 | 390/18723 | 2.18e-17 | 2.32e-15 | 178 |
| GO:190285016 | Skin | cSCC | microtubule cytoskeleton organization involved in mitosis | 85/4864 | 147/18723 | 2.66e-16 | 2.39e-14 | 85 |
| GO:000716327 | Skin | cSCC | establishment or maintenance of cell polarity | 103/4864 | 218/18723 | 9.44e-12 | 4.85e-10 | 103 |
| GO:199077824 | Skin | cSCC | protein localization to cell periphery | 134/4864 | 333/18723 | 7.09e-09 | 2.30e-07 | 134 |
| GO:190437524 | Skin | cSCC | regulation of protein localization to cell periphery | 59/4864 | 125/18723 | 2.52e-07 | 5.28e-06 | 59 |
| GO:003001025 | Skin | cSCC | establishment of cell polarity | 65/4864 | 143/18723 | 3.60e-07 | 7.18e-06 | 65 |
| GO:190382822 | Skin | cSCC | negative regulation of cellular protein localization | 50/4864 | 117/18723 | 5.85e-05 | 5.77e-04 | 50 |
| GO:00400012 | Skin | cSCC | establishment of mitotic spindle localization | 19/4864 | 35/18723 | 3.37e-04 | 2.67e-03 | 19 |
| GO:00516534 | Skin | cSCC | spindle localization | 26/4864 | 56/18723 | 7.59e-04 | 5.27e-03 | 26 |
| GO:00001321 | Skin | cSCC | establishment of mitotic spindle orientation | 16/4864 | 30/18723 | 1.27e-03 | 8.19e-03 | 16 |
| GO:00726971 | Skin | cSCC | protein localization to cell cortex | 8/4864 | 11/18723 | 1.56e-03 | 9.60e-03 | 8 |
| GO:19043766 | Skin | cSCC | negative regulation of protein localization to cell periphery | 14/4864 | 26/18723 | 2.26e-03 | 1.32e-02 | 14 |
| GO:00512931 | Skin | cSCC | establishment of spindle localization | 23/4864 | 51/18723 | 2.41e-03 | 1.38e-02 | 23 |
| GO:00512942 | Skin | cSCC | establishment of spindle orientation | 17/4864 | 37/18723 | 6.83e-03 | 3.30e-02 | 17 |
| GO:000173821 | Skin | cSCC | morphogenesis of a polarized epithelium | 35/4864 | 94/18723 | 1.05e-02 | 4.61e-02 | 35 |
| Page: 1 |
| Pathway ID | Tissue | Disease Stage | Description | Gene Ratio | Bg Ratio | pvalue | p.adjust | qvalue | Count |
| Page: 1 |
Top |
Cell-cell communication analysis |
| Identification of potential cell-cell interactions between two cell types and their ligand-receptor pairs for different disease states |
| Ligand | Receptor | LRpair | Pathway | Tissue | Disease Stage |
| Page: 1 |
Top |
Single-cell gene regulatory network inference analysis |
| Find out the significant the regulons (TFs) and the target genes of each regulon across cell types for different disease states |
| TF | Cell Type | Tissue | Disease Stage | Target Gene | RSS | Regulon Activity |
| ∗The dot plots of a searched regulon are shown for all cell subpopulations in each disease state of each tissue based on the regulon specific score inferred using pySCENIC and by calculating the average expression. |
| Page: 1 |
Top |
Somatic mutation of malignant transformation related genes |
| Annotation of somatic variants for genes involved in malignant transformation |
| Hugo Symbol | Variant Class | Variant Classification | dbSNP RS | HGVSc | HGVSp | HGVSp Short | SWISSPROT | BIOTYPE | SIFT | PolyPhen | Tumor Sample Barcode | Tissue | Histology | Sex | Age | Stage | Therapy Types | Drugs | Outcome |
| SAPCD2 | SNV | Missense_Mutation | rs751542754 | c.751N>T | p.Arg251Trp | p.R251W | Q86UD0 | protein_coding | deleterious(0) | probably_damaging(0.95) | TCGA-5M-AAT6-01 | Colorectum | colon adenocarcinoma | Female | <65 | III/IV | Unknown | Unknown | PD |
| SAPCD2 | SNV | Missense_Mutation | c.1079G>A | p.Arg360His | p.R360H | Q86UD0 | protein_coding | deleterious(0) | probably_damaging(0.981) | TCGA-A6-2686-01 | Colorectum | colon adenocarcinoma | Female | >=65 | I/II | Unknown | Unknown | SD | |
| SAPCD2 | SNV | Missense_Mutation | rs567953393 | c.628C>T | p.Arg210Cys | p.R210C | Q86UD0 | protein_coding | deleterious(0) | probably_damaging(0.996) | TCGA-AA-A00N-01 | Colorectum | colon adenocarcinoma | Male | >=65 | I/II | Unknown | Unknown | PD |
| SAPCD2 | SNV | Missense_Mutation | c.587G>C | p.Arg196Thr | p.R196T | Q86UD0 | protein_coding | tolerated(0.08) | benign(0.041) | TCGA-D5-6931-01 | Colorectum | colon adenocarcinoma | Male | >=65 | III/IV | Unknown | Unknown | SD | |
| SAPCD2 | SNV | Missense_Mutation | novel | c.1082N>C | p.Ile361Thr | p.I361T | Q86UD0 | protein_coding | deleterious(0) | probably_damaging(0.991) | TCGA-AX-A2HG-01 | Endometrium | uterine corpus endometrioid carcinoma | Female | <65 | I/II | Unknown | Unknown | SD |
| SAPCD2 | SNV | Missense_Mutation | rs749355882 | c.749N>T | p.Ala250Val | p.A250V | Q86UD0 | protein_coding | deleterious(0.02) | benign(0.013) | TCGA-BG-A0M7-01 | Endometrium | uterine corpus endometrioid carcinoma | Female | <65 | III/IV | Chemotherapy | carboplatin | SD |
| SAPCD2 | SNV | Missense_Mutation | rs61746617 | c.635N>A | p.Arg212Gln | p.R212Q | Q86UD0 | protein_coding | deleterious(0.01) | possibly_damaging(0.698) | TCGA-BG-A221-01 | Endometrium | uterine corpus endometrioid carcinoma | Female | >=65 | I/II | Unknown | Unknown | SD |
| SAPCD2 | SNV | Missense_Mutation | novel | c.986C>T | p.Ser329Phe | p.S329F | Q86UD0 | protein_coding | deleterious(0.02) | benign(0) | TCGA-D1-A175-01 | Endometrium | uterine corpus endometrioid carcinoma | Female | <65 | I/II | Chemotherapy | paclitaxel | SD |
| SAPCD2 | SNV | Missense_Mutation | c.1106C>T | p.Ser369Leu | p.S369L | Q86UD0 | protein_coding | deleterious(0.02) | benign(0.086) | TCGA-EO-A22X-01 | Endometrium | uterine corpus endometrioid carcinoma | Female | <65 | III/IV | Unspecific | Carboplatin | Complete Response | |
| SAPCD2 | insertion | Frame_Shift_Ins | novel | c.969_970insC | p.Cys324LeufsTer36 | p.C324Lfs*36 | Q86UD0 | protein_coding | TCGA-FI-A2D0-01 | Endometrium | uterine corpus endometrioid carcinoma | Female | <65 | I/II | Unknown | Unknown | SD |
| Page: 1 2 |
Top |
Related drugs of malignant transformation related genes |
| Identification of chemicals and drugs interact with genes involved in malignant transfromation |
| (DGIdb 4.0) |
| Entrez ID | Symbol | Category | Interaction Types | Drug Claim Name | Drug Name | PMIDs |
| Page: 1 |

Copyright 2023-Present -The University of Texas Health Science Center at Houston |