
|
|||||
|
 | |
| |
| |
| |
| |
| |
|
Gene: SAP30L |
Gene summary for SAP30L |
| Gene information | Species | Human | Gene symbol | SAP30L | Gene ID | 79685 |
| Gene name | SAP30 like | |
| Gene Alias | NS4ATP2 | |
| Cytomap | 5q33.2 | |
| Gene Type | protein-coding | GO ID | GO:0006139 | UniProtAcc | Q9HAJ7 |
Top |
Malignant transformation analysis |
| Identification of the aberrant gene expression in precancerous and cancerous lesions by comparing the gene expression of stem-like cells in diseased tissues with normal stem cells |
| Entrez ID | Symbol | Replicates | Species | Organ | Tissue | Adj P-value | Log2FC | Malignancy |
| 79685 | SAP30L | HCC1_Meng | Human | Liver | HCC | 2.05e-37 | 4.79e-02 | 0.0246 |
| 79685 | SAP30L | HCC2_Meng | Human | Liver | HCC | 4.49e-13 | 7.17e-02 | 0.0107 |
| 79685 | SAP30L | HCC1 | Human | Liver | HCC | 8.98e-09 | 3.03e+00 | 0.5336 |
| 79685 | SAP30L | HCC2 | Human | Liver | HCC | 1.17e-11 | 3.07e+00 | 0.5341 |
| 79685 | SAP30L | S028 | Human | Liver | HCC | 1.54e-09 | 4.00e-01 | 0.2503 |
| 79685 | SAP30L | S029 | Human | Liver | HCC | 4.21e-09 | 4.33e-01 | 0.2581 |
| 79685 | SAP30L | C04 | Human | Oral cavity | OSCC | 1.93e-08 | 3.23e-01 | 0.2633 |
| 79685 | SAP30L | C30 | Human | Oral cavity | OSCC | 1.45e-24 | 1.08e+00 | 0.3055 |
| 79685 | SAP30L | C38 | Human | Oral cavity | OSCC | 1.82e-06 | 5.74e-01 | 0.172 |
| 79685 | SAP30L | C43 | Human | Oral cavity | OSCC | 3.16e-05 | 1.37e-01 | 0.1704 |
| 79685 | SAP30L | C46 | Human | Oral cavity | OSCC | 1.01e-04 | 2.59e-01 | 0.1673 |
| 79685 | SAP30L | C51 | Human | Oral cavity | OSCC | 1.96e-06 | 3.55e-01 | 0.2674 |
| 79685 | SAP30L | C57 | Human | Oral cavity | OSCC | 1.12e-02 | 2.96e-01 | 0.1679 |
| 79685 | SAP30L | C08 | Human | Oral cavity | OSCC | 7.90e-24 | 4.35e-01 | 0.1919 |
| 79685 | SAP30L | LN46 | Human | Oral cavity | OSCC | 2.30e-07 | 4.29e-01 | 0.1666 |
| 79685 | SAP30L | SYSMH1 | Human | Oral cavity | OSCC | 3.85e-04 | 1.12e-01 | 0.1127 |
| 79685 | SAP30L | SYSMH2 | Human | Oral cavity | OSCC | 5.73e-10 | 3.15e-01 | 0.2326 |
| 79685 | SAP30L | SYSMH3 | Human | Oral cavity | OSCC | 1.04e-12 | 2.32e-01 | 0.2442 |
| 79685 | SAP30L | SYSMH6 | Human | Oral cavity | OSCC | 1.45e-02 | 1.25e-01 | 0.1275 |
| 79685 | SAP30L | GSM5252131_BPH340PrSF_Via | Human | Prostate | BPH | 3.79e-02 | 5.06e-02 | -0.2126 |
| Page: 1 2 3 |
| Tissue | Expression Dynamics | Abbreviation |
| Liver | 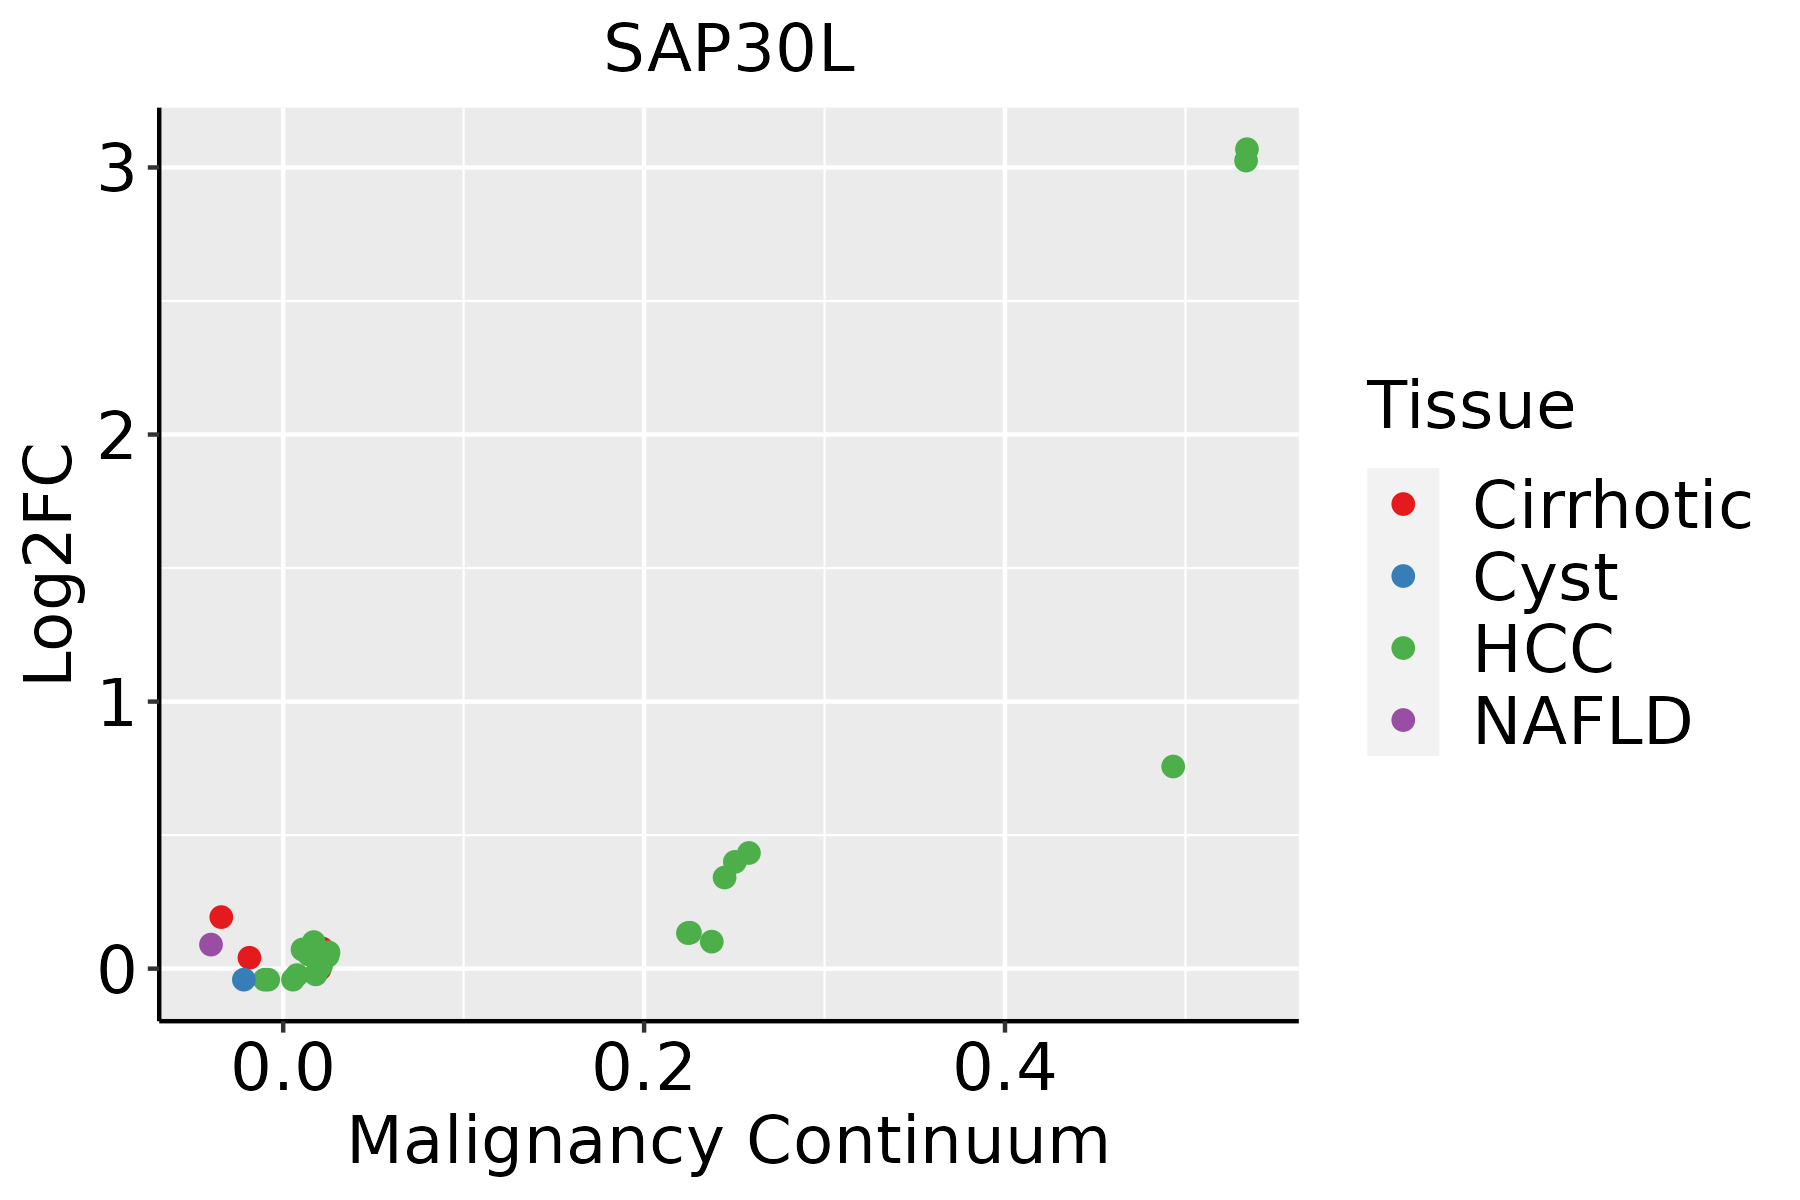 | HCC: Hepatocellular carcinoma |
| NAFLD: Non-alcoholic fatty liver disease | ||
| Oral Cavity | 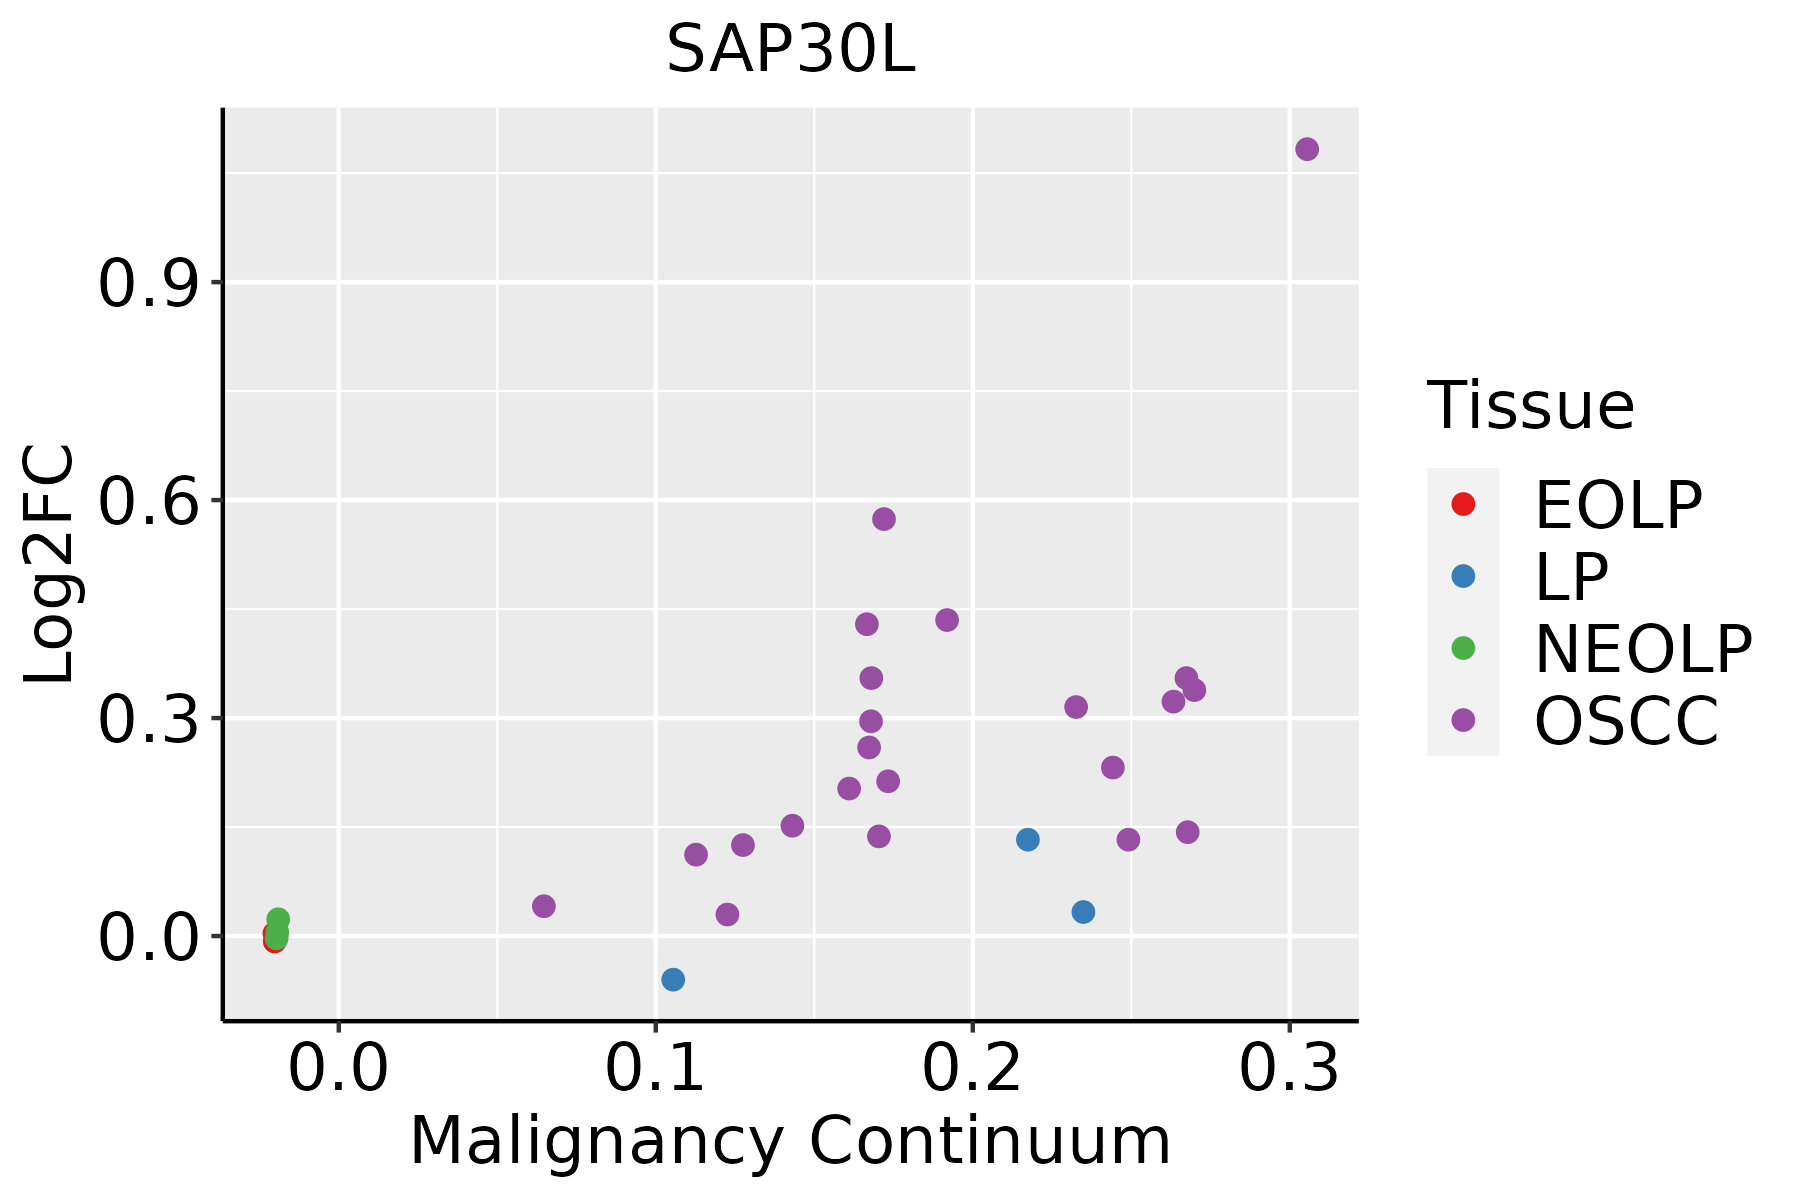 | EOLP: Erosive Oral lichen planus |
| LP: leukoplakia | ||
| NEOLP: Non-erosive oral lichen planus | ||
| OSCC: Oral squamous cell carcinoma | ||
| Prostate |  | BPH: Benign Prostatic Hyperplasia |
| Thyroid | 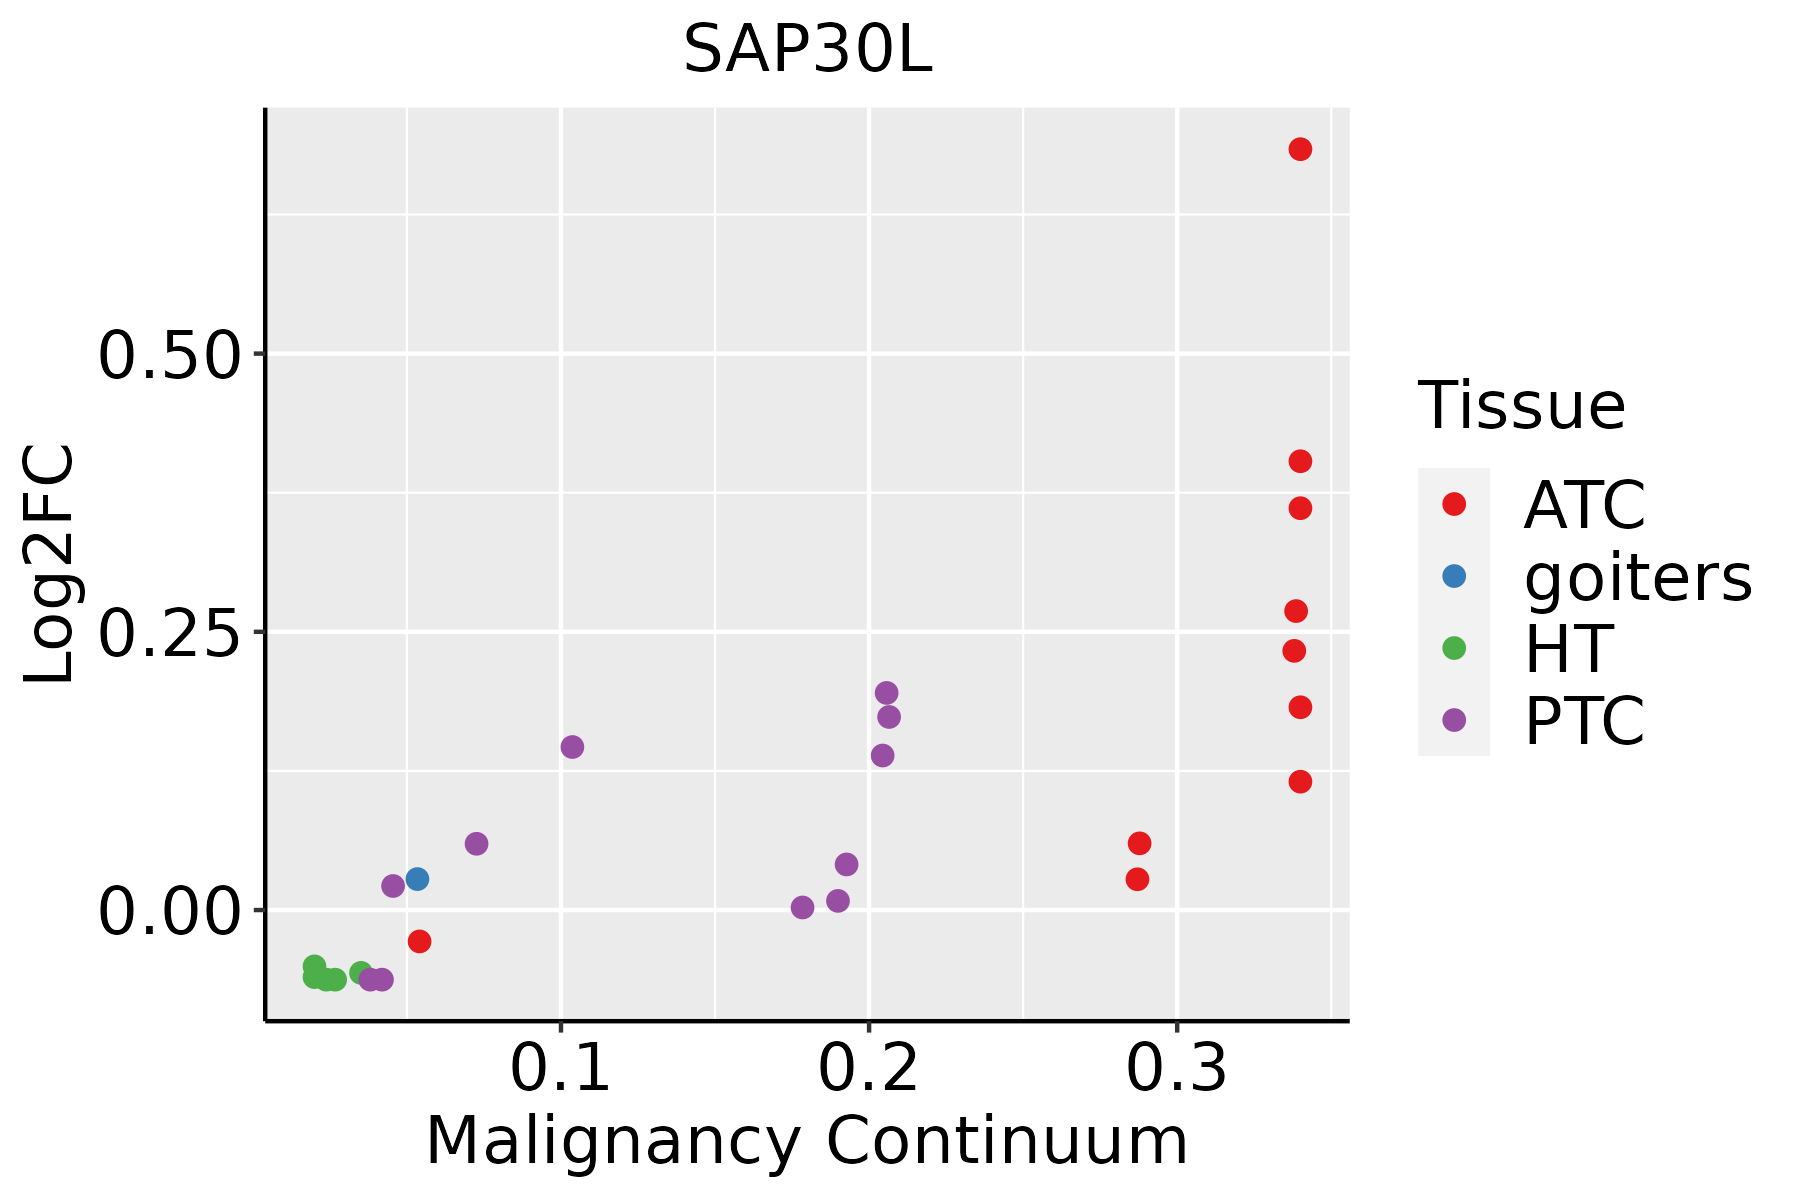 | ATC: Anaplastic thyroid cancer |
| HT: Hashimoto's thyroiditis | ||
| PTC: Papillary thyroid cancer |
| ∗log2FC in expression of this searched gene in stem-like cells from each diseased tissue sample relative to stem-like cells in normal samples in each tissue plotted against the malignancy continuum. Samples are colored based on if they are from different disease stage. |
Top |
Malignant transformation related pathway analysis |
| Find out the enriched GO biological processes and KEGG pathways involved in transition from healthy to precancer to cancer |
| Tissue | Disease Stage | Enriched GO biological Processes |
| Colorectum | AD |  |
| Colorectum | SER |  |
| Colorectum | MSS |  |
| Colorectum | MSI-H |  |
| Colorectum | FAP |  |
| ∗Top 15 enriched GO BP terms are showed in the bar plot of each disease state in each tissue. Each row represents a significant GO biological process which is colored according to the -log10(p.adjust). |
| Page: 1 2 3 4 5 6 7 8 9 |
| GO ID | Tissue | Disease Stage | Description | Gene Ratio | Bg Ratio | pvalue | p.adjust | Count |
| Page: 1 |
| Pathway ID | Tissue | Disease Stage | Description | Gene Ratio | Bg Ratio | pvalue | p.adjust | qvalue | Count |
| hsa0516921 | Liver | HCC | Epstein-Barr virus infection | 128/4020 | 202/8465 | 3.17e-06 | 2.79e-05 | 1.55e-05 | 128 |
| hsa0516931 | Liver | HCC | Epstein-Barr virus infection | 128/4020 | 202/8465 | 3.17e-06 | 2.79e-05 | 1.55e-05 | 128 |
| hsa0516928 | Oral cavity | OSCC | Epstein-Barr virus infection | 144/3704 | 202/8465 | 1.08e-15 | 3.60e-14 | 1.83e-14 | 144 |
| hsa05169113 | Oral cavity | OSCC | Epstein-Barr virus infection | 144/3704 | 202/8465 | 1.08e-15 | 3.60e-14 | 1.83e-14 | 144 |
| hsa0516926 | Prostate | BPH | Epstein-Barr virus infection | 70/1718 | 202/8465 | 1.06e-06 | 9.74e-06 | 6.03e-06 | 70 |
| hsa05169112 | Prostate | BPH | Epstein-Barr virus infection | 70/1718 | 202/8465 | 1.06e-06 | 9.74e-06 | 6.03e-06 | 70 |
| hsa0516927 | Prostate | Tumor | Epstein-Barr virus infection | 72/1791 | 202/8465 | 1.15e-06 | 1.09e-05 | 6.73e-06 | 72 |
| hsa0516935 | Prostate | Tumor | Epstein-Barr virus infection | 72/1791 | 202/8465 | 1.15e-06 | 1.09e-05 | 6.73e-06 | 72 |
| Page: 1 |
Top |
Cell-cell communication analysis |
| Identification of potential cell-cell interactions between two cell types and their ligand-receptor pairs for different disease states |
| Ligand | Receptor | LRpair | Pathway | Tissue | Disease Stage |
| Page: 1 |
Top |
Single-cell gene regulatory network inference analysis |
| Find out the significant the regulons (TFs) and the target genes of each regulon across cell types for different disease states |
| TF | Cell Type | Tissue | Disease Stage | Target Gene | RSS | Regulon Activity |
| ∗The dot plots of a searched regulon are shown for all cell subpopulations in each disease state of each tissue based on the regulon specific score inferred using pySCENIC and by calculating the average expression. |
| Page: 1 |
Top |
Somatic mutation of malignant transformation related genes |
| Annotation of somatic variants for genes involved in malignant transformation |
| Hugo Symbol | Variant Class | Variant Classification | dbSNP RS | HGVSc | HGVSp | HGVSp Short | SWISSPROT | BIOTYPE | SIFT | PolyPhen | Tumor Sample Barcode | Tissue | Histology | Sex | Age | Stage | Therapy Types | Drugs | Outcome |
| SAP30L | SNV | Missense_Mutation | c.254N>A | p.Arg85Gln | p.R85Q | Q9HAJ7 | protein_coding | deleterious(0) | probably_damaging(0.979) | TCGA-AA-3510-01 | Colorectum | colon adenocarcinoma | Male | >=65 | I/II | Unknown | Unknown | SD | |
| SAP30L | SNV | Missense_Mutation | rs201712433 | c.527C>T | p.Ser176Leu | p.S176L | Q9HAJ7 | protein_coding | tolerated(0.38) | benign(0) | TCGA-CA-6718-01 | Colorectum | colon adenocarcinoma | Male | <65 | I/II | Unknown | Unknown | PD |
| SAP30L | SNV | Missense_Mutation | c.254N>A | p.Arg85Gln | p.R85Q | Q9HAJ7 | protein_coding | deleterious(0) | probably_damaging(0.979) | TCGA-AX-A05Z-01 | Endometrium | uterine corpus endometrioid carcinoma | Female | <65 | III/IV | Chemotherapy | adriamycin | SD | |
| SAP30L | SNV | Missense_Mutation | novel | c.200G>A | p.Ser67Asn | p.S67N | Q9HAJ7 | protein_coding | tolerated(0.3) | benign(0.003) | TCGA-BG-A222-01 | Endometrium | uterine corpus endometrioid carcinoma | Female | <65 | I/II | Unknown | Unknown | SD |
| SAP30L | SNV | Missense_Mutation | rs201712433 | c.527N>T | p.Ser176Leu | p.S176L | Q9HAJ7 | protein_coding | tolerated(0.38) | benign(0) | TCGA-E6-A1LX-01 | Endometrium | uterine corpus endometrioid carcinoma | Female | <65 | I/II | Unknown | Unknown | SD |
| SAP30L | SNV | Missense_Mutation | c.531G>T | p.Glu177Asp | p.E177D | Q9HAJ7 | protein_coding | tolerated(1) | benign(0.003) | TCGA-95-7039-01 | Lung | lung adenocarcinoma | Female | <65 | I/II | Unknown | Unknown | PD | |
| SAP30L | SNV | Missense_Mutation | c.371N>T | p.Arg124Leu | p.R124L | Q9HAJ7 | protein_coding | deleterious(0) | probably_damaging(0.986) | TCGA-95-7947-01 | Lung | lung adenocarcinoma | Male | >=65 | I/II | Unknown | Unknown | SD | |
| SAP30L | SNV | Missense_Mutation | novel | c.522N>C | p.Gln174His | p.Q174H | Q9HAJ7 | protein_coding | tolerated(0.35) | benign(0) | TCGA-CN-4723-01 | Oral cavity | head & neck squamous cell carcinoma | Male | >=65 | I/II | Unknown | Unknown | SD |
| SAP30L | SNV | Missense_Mutation | c.237N>A | p.Asn79Lys | p.N79K | Q9HAJ7 | protein_coding | tolerated(0.16) | probably_damaging(0.995) | TCGA-BR-6452-01 | Stomach | stomach adenocarcinoma | Female | >=65 | I/II | Unknown | Unknown | SD | |
| SAP30L | SNV | Missense_Mutation | c.421N>A | p.Glu141Lys | p.E141K | Q9HAJ7 | protein_coding | deleterious(0.03) | possibly_damaging(0.817) | TCGA-CG-5732-01 | Stomach | stomach adenocarcinoma | Male | >=65 | III/IV | Chemotherapy | mitomycin | PD |
| Page: 1 2 |
Top |
Related drugs of malignant transformation related genes |
| Identification of chemicals and drugs interact with genes involved in malignant transfromation |
| (DGIdb 4.0) |
| Entrez ID | Symbol | Category | Interaction Types | Drug Claim Name | Drug Name | PMIDs |
| Page: 1 |

Copyright 2023-Present -The University of Texas Health Science Center at Houston |