Schematic overview of the cellular and molecular mechanisms involved in the cancer progression, including the proposed cellular and molecular mechanisms in cancer cells trajectory. AT1: alveolar type 1 cells; AT2: alveolar type 2 cells; AAH: atypical adenomatous hyperplasia; AIS: adenocarcinoma in situ; MIA: minimally invasive adenocarcinoma; IA: invasive adenocarcinoma; EMT: epithelial-mesenchymal transition

Home

Download

Statistics

Help

Contact

Center for Computational Systems Medicine
leaf

Gene summary

leaf

Malignant transformation analysis

leaf

Malignant transformation related pathway analysis

leaf

Cell-cell communication analysis

leaf

Single-cell gene regulatory network inference analysis

leaf

Somatic mutation of malignant transformation related genes

leaf

Related drugs of malignant transformation related genes

Gene: SAP30BP

Gene summary for SAP30BP

check button Gene summary.

Gene informationSpeciesHuman
Gene symbol

SAP30BP

Gene ID

29115

Gene nameSAP30 binding protein
Gene AliasHCNGP
Cytomap17q25.1
Gene Typeprotein-coding
GO ID

GO:0006139

UniProtAcc

Q9UHR5


Top

Malignant transformation analysis

check button Identification of the aberrant gene expression in precancerous and cancerous lesions by comparing the gene expression of stem-like cells in diseased tissues with normal stem cells
check button Malignant transformation involving gene list.
Entrez IDSymbolReplicatesSpeciesOrganTissueAdj P-valueLog2FCMalignancy
29115SAP30BPLZE4THumanEsophagusESCC5.47e-174.51e-010.0811
29115SAP30BPLZE5THumanEsophagusESCC9.60e-033.21e-010.0514
29115SAP30BPLZE7THumanEsophagusESCC7.81e-065.44e-010.0667
29115SAP30BPLZE8THumanEsophagusESCC4.79e-072.50e-010.067
29115SAP30BPLZE20THumanEsophagusESCC3.71e-088.82e-020.0662
29115SAP30BPLZE22THumanEsophagusESCC4.18e-105.44e-010.068
29115SAP30BPLZE24THumanEsophagusESCC1.80e-247.54e-010.0596
29115SAP30BPLZE21THumanEsophagusESCC5.28e-075.32e-010.0655
29115SAP30BPLZE6THumanEsophagusESCC1.16e-153.36e-010.0845
29115SAP30BPP1T-EHumanEsophagusESCC4.66e-104.76e-010.0875
29115SAP30BPP2T-EHumanEsophagusESCC5.88e-466.86e-010.1177
29115SAP30BPP4T-EHumanEsophagusESCC9.47e-153.04e-010.1323
29115SAP30BPP5T-EHumanEsophagusESCC1.44e-183.54e-010.1327
29115SAP30BPP8T-EHumanEsophagusESCC2.22e-426.19e-010.0889
29115SAP30BPP9T-EHumanEsophagusESCC1.54e-254.38e-010.1131
29115SAP30BPP10T-EHumanEsophagusESCC1.94e-478.63e-010.116
29115SAP30BPP11T-EHumanEsophagusESCC7.19e-331.01e+000.1426
29115SAP30BPP12T-EHumanEsophagusESCC3.93e-407.65e-010.1122
29115SAP30BPP15T-EHumanEsophagusESCC3.89e-346.97e-010.1149
29115SAP30BPP16T-EHumanEsophagusESCC5.11e-223.70e-010.1153
Page: 1 2 3 4 5 6 7 

check button Transcriptomic changes along malignancy continuum.
TissueExpression DynamicsAbbreviation
EsophagusThe image shows the transcriptomic changes along malignancy continuum.log2FC in expression of this searched gene in stem-like cells from each diseased tissue sample relative to stem-like cells in normal samples in each tissue plotted against the malignancy continuum. Samples are colored based on if they are from different disease stage.
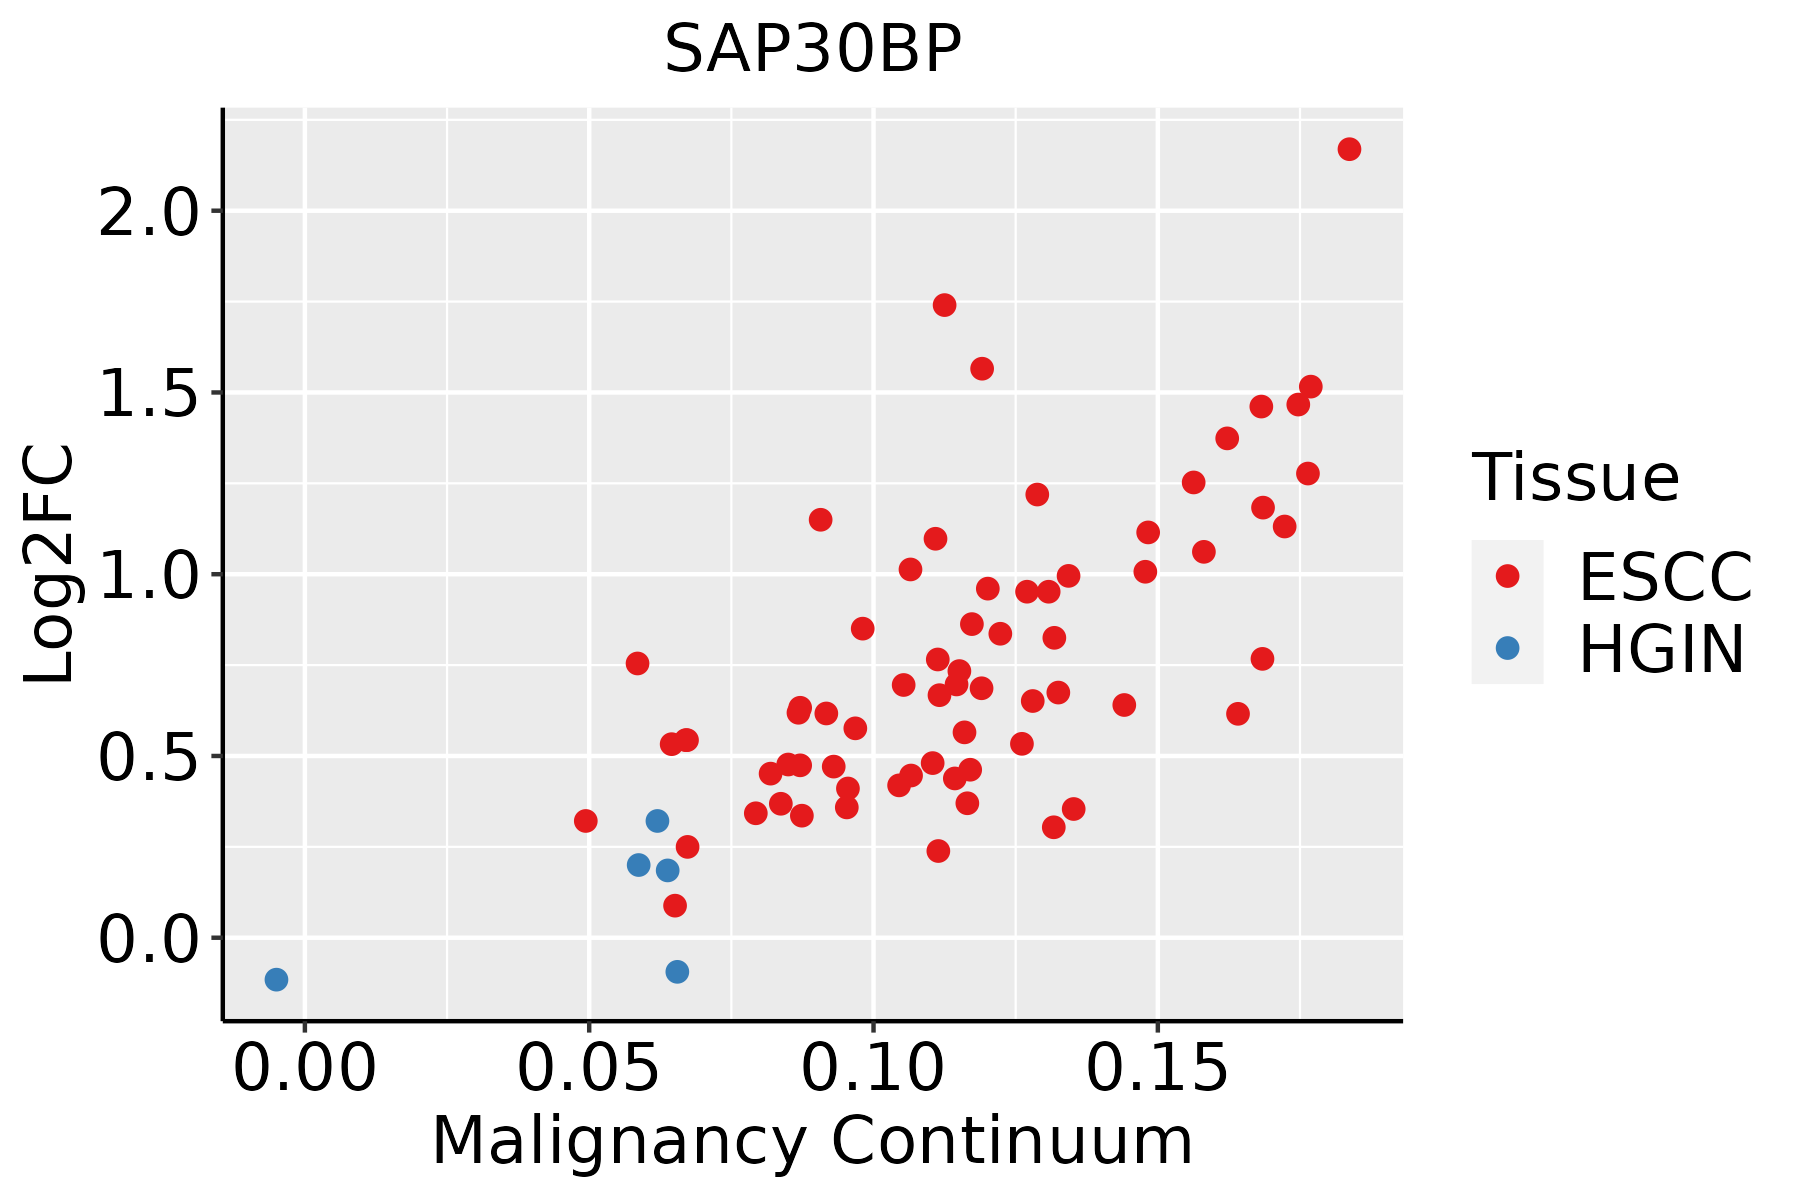
ESCC: Esophageal squamous cell carcinoma
HGIN: High-grade intraepithelial neoplasias
LGIN: Low-grade intraepithelial neoplasias
LiverThe image shows the transcriptomic changes along malignancy continuum.log2FC in expression of this searched gene in stem-like cells from each diseased tissue sample relative to stem-like cells in normal samples in each tissue plotted against the malignancy continuum. Samples are colored based on if they are from different disease stage.
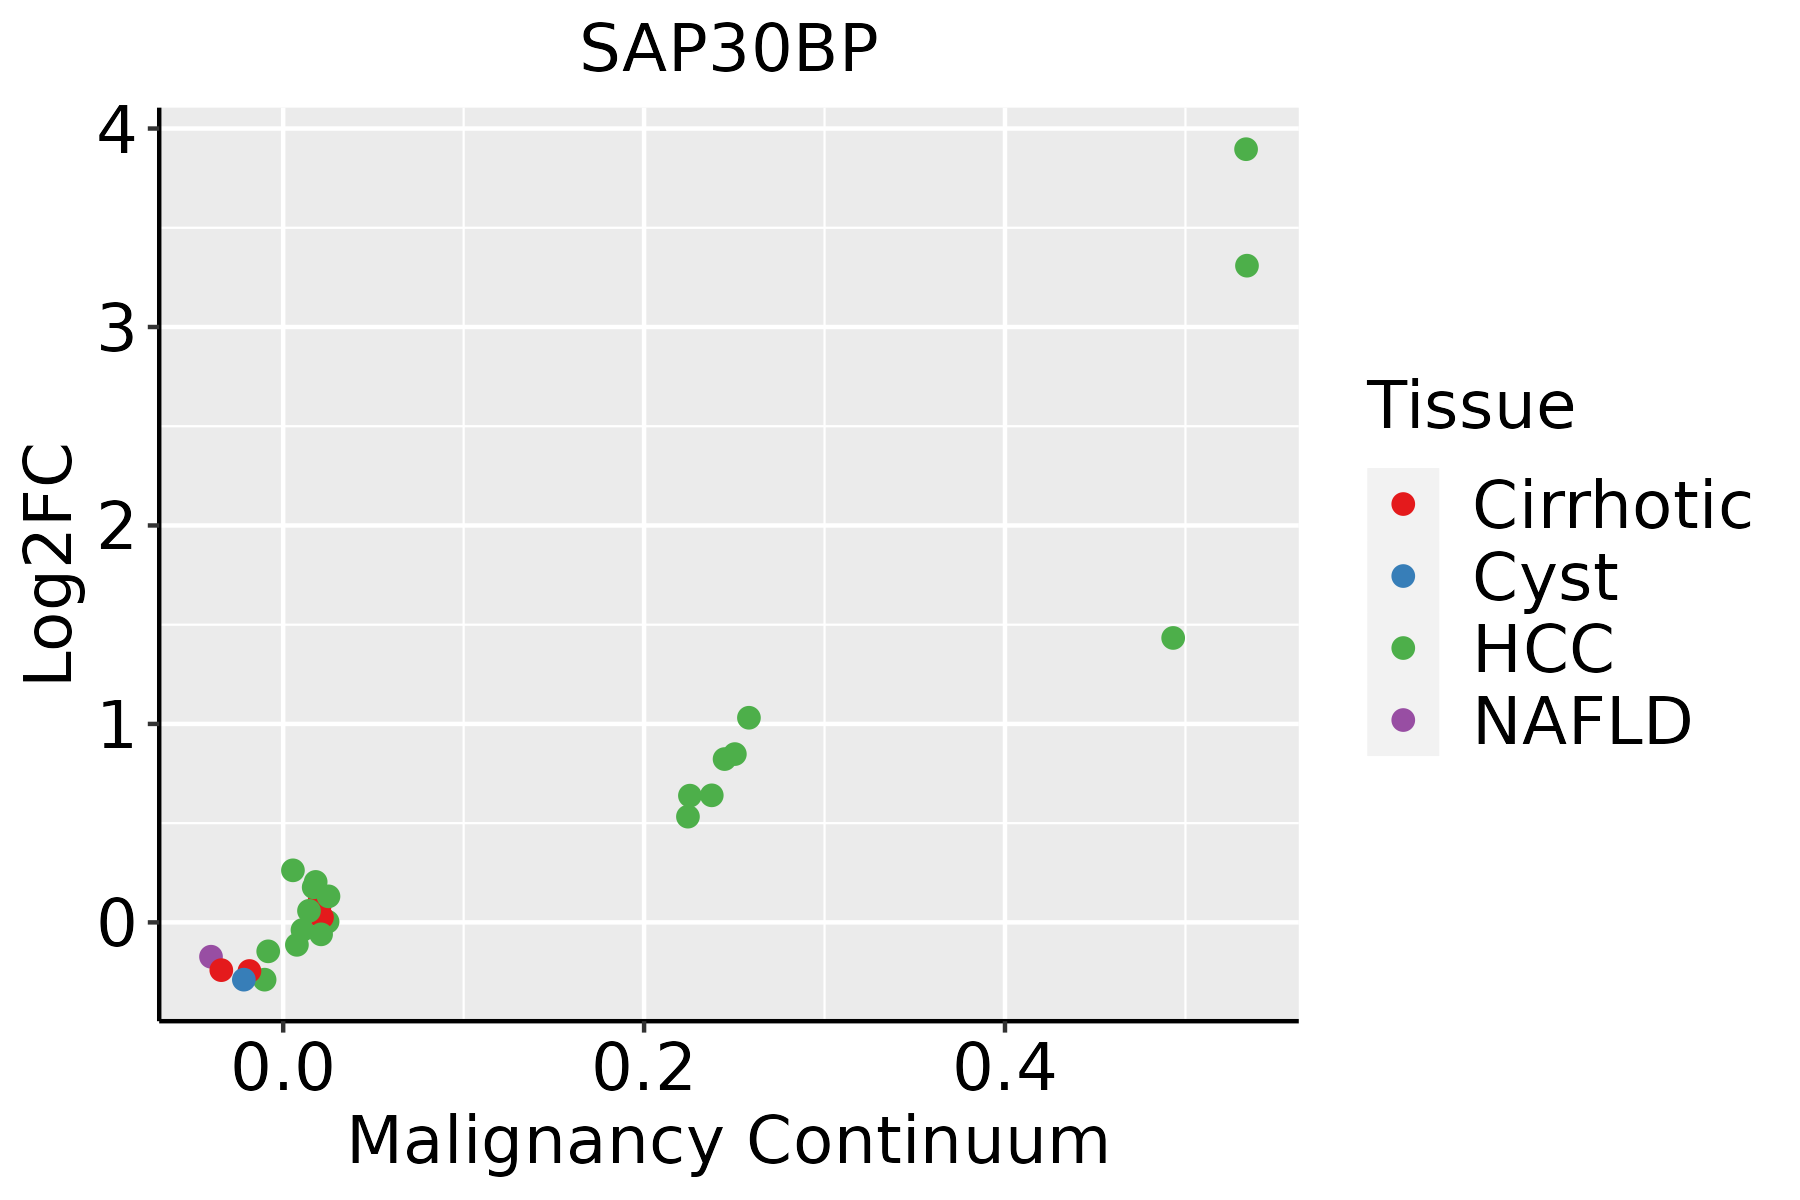
HCC: Hepatocellular carcinoma
NAFLD: Non-alcoholic fatty liver disease
Oral CavityThe image shows the transcriptomic changes along malignancy continuum.log2FC in expression of this searched gene in stem-like cells from each diseased tissue sample relative to stem-like cells in normal samples in each tissue plotted against the malignancy continuum. Samples are colored based on if they are from different disease stage.EOLP: Erosive Oral lichen planus
LP: leukoplakia
NEOLP: Non-erosive oral lichen planus
OSCC: Oral squamous cell carcinoma
SkinThe image shows the transcriptomic changes along malignancy continuum.log2FC in expression of this searched gene in stem-like cells from each diseased tissue sample relative to stem-like cells in normal samples in each tissue plotted against the malignancy continuum. Samples are colored based on if they are from different disease stage.
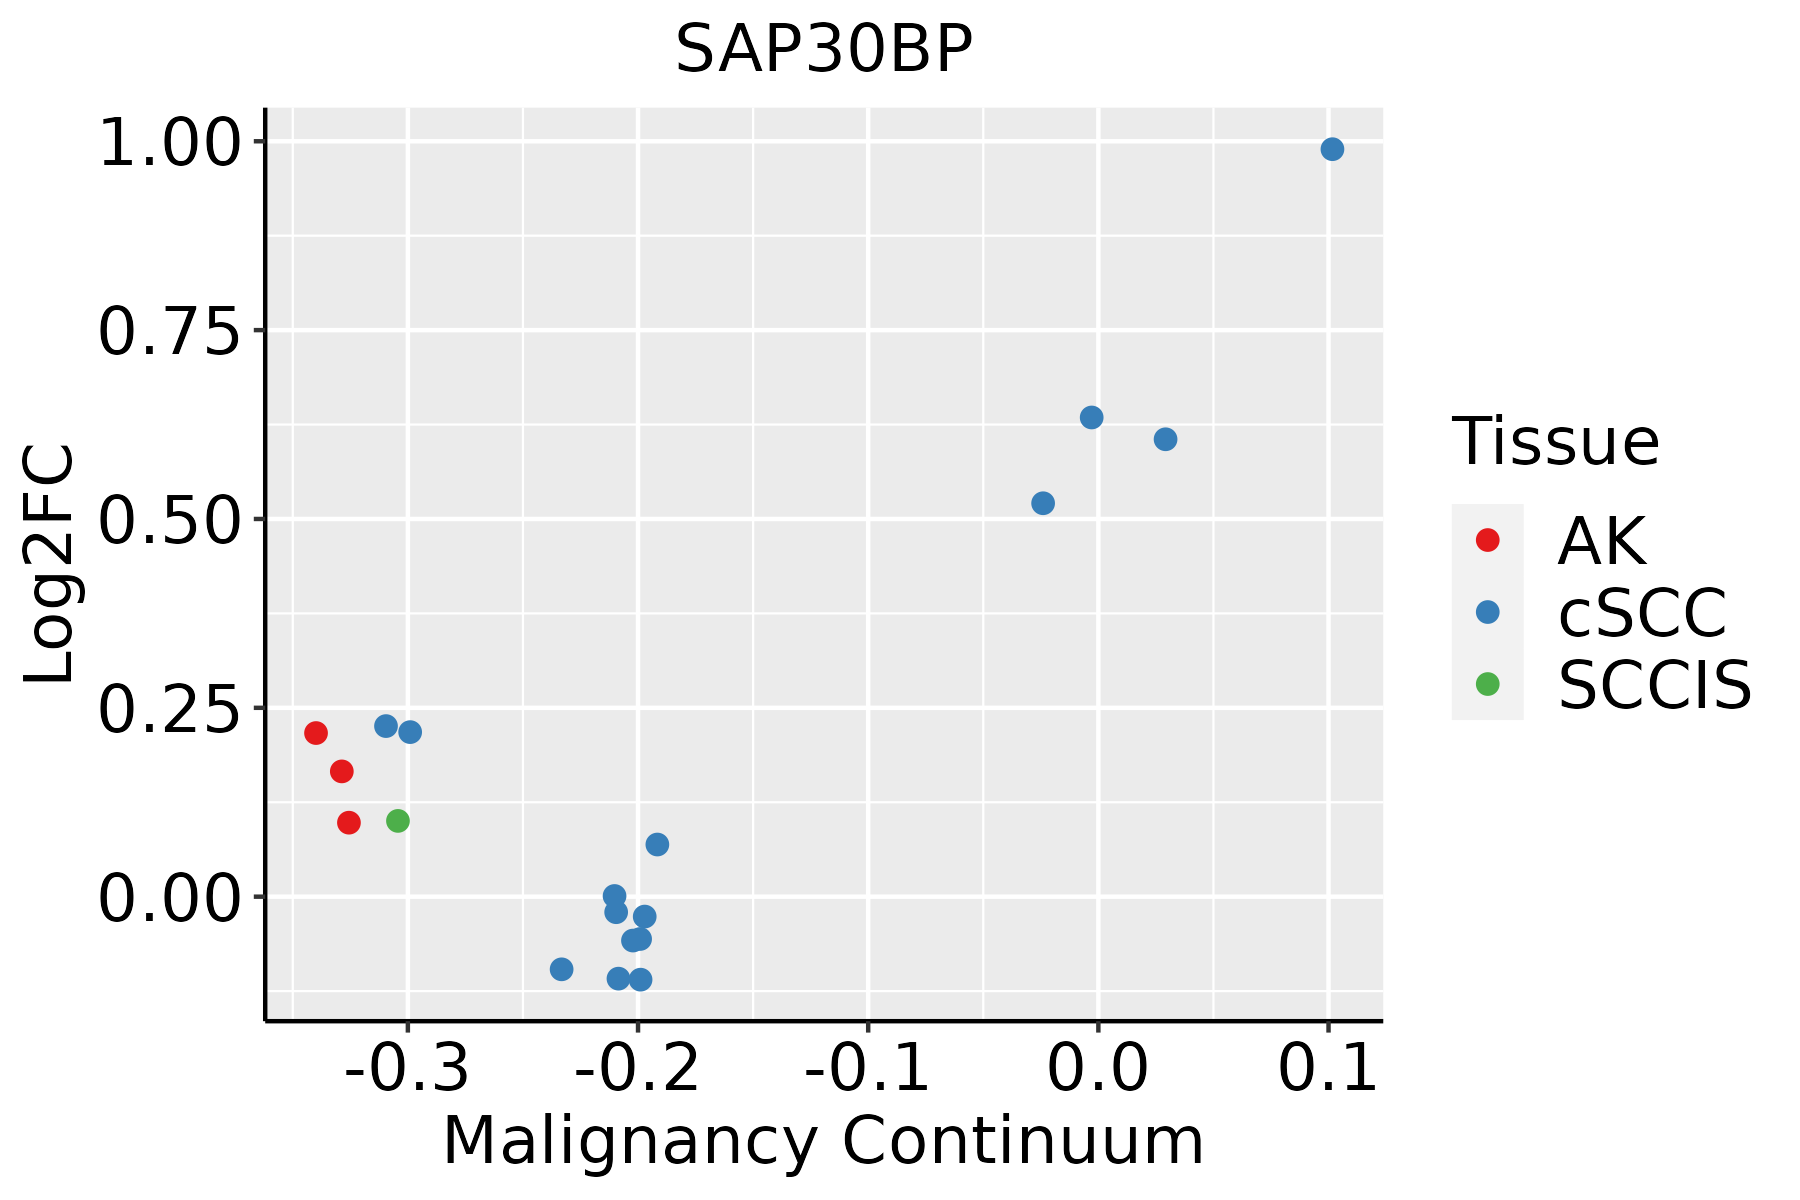
AK: Actinic keratosis
cSCC: Cutaneous squamous cell carcinoma
SCCIS:squamous cell carcinoma in situ
ThyroidThe image shows the transcriptomic changes along malignancy continuum.log2FC in expression of this searched gene in stem-like cells from each diseased tissue sample relative to stem-like cells in normal samples in each tissue plotted against the malignancy continuum. Samples are colored based on if they are from different disease stage.
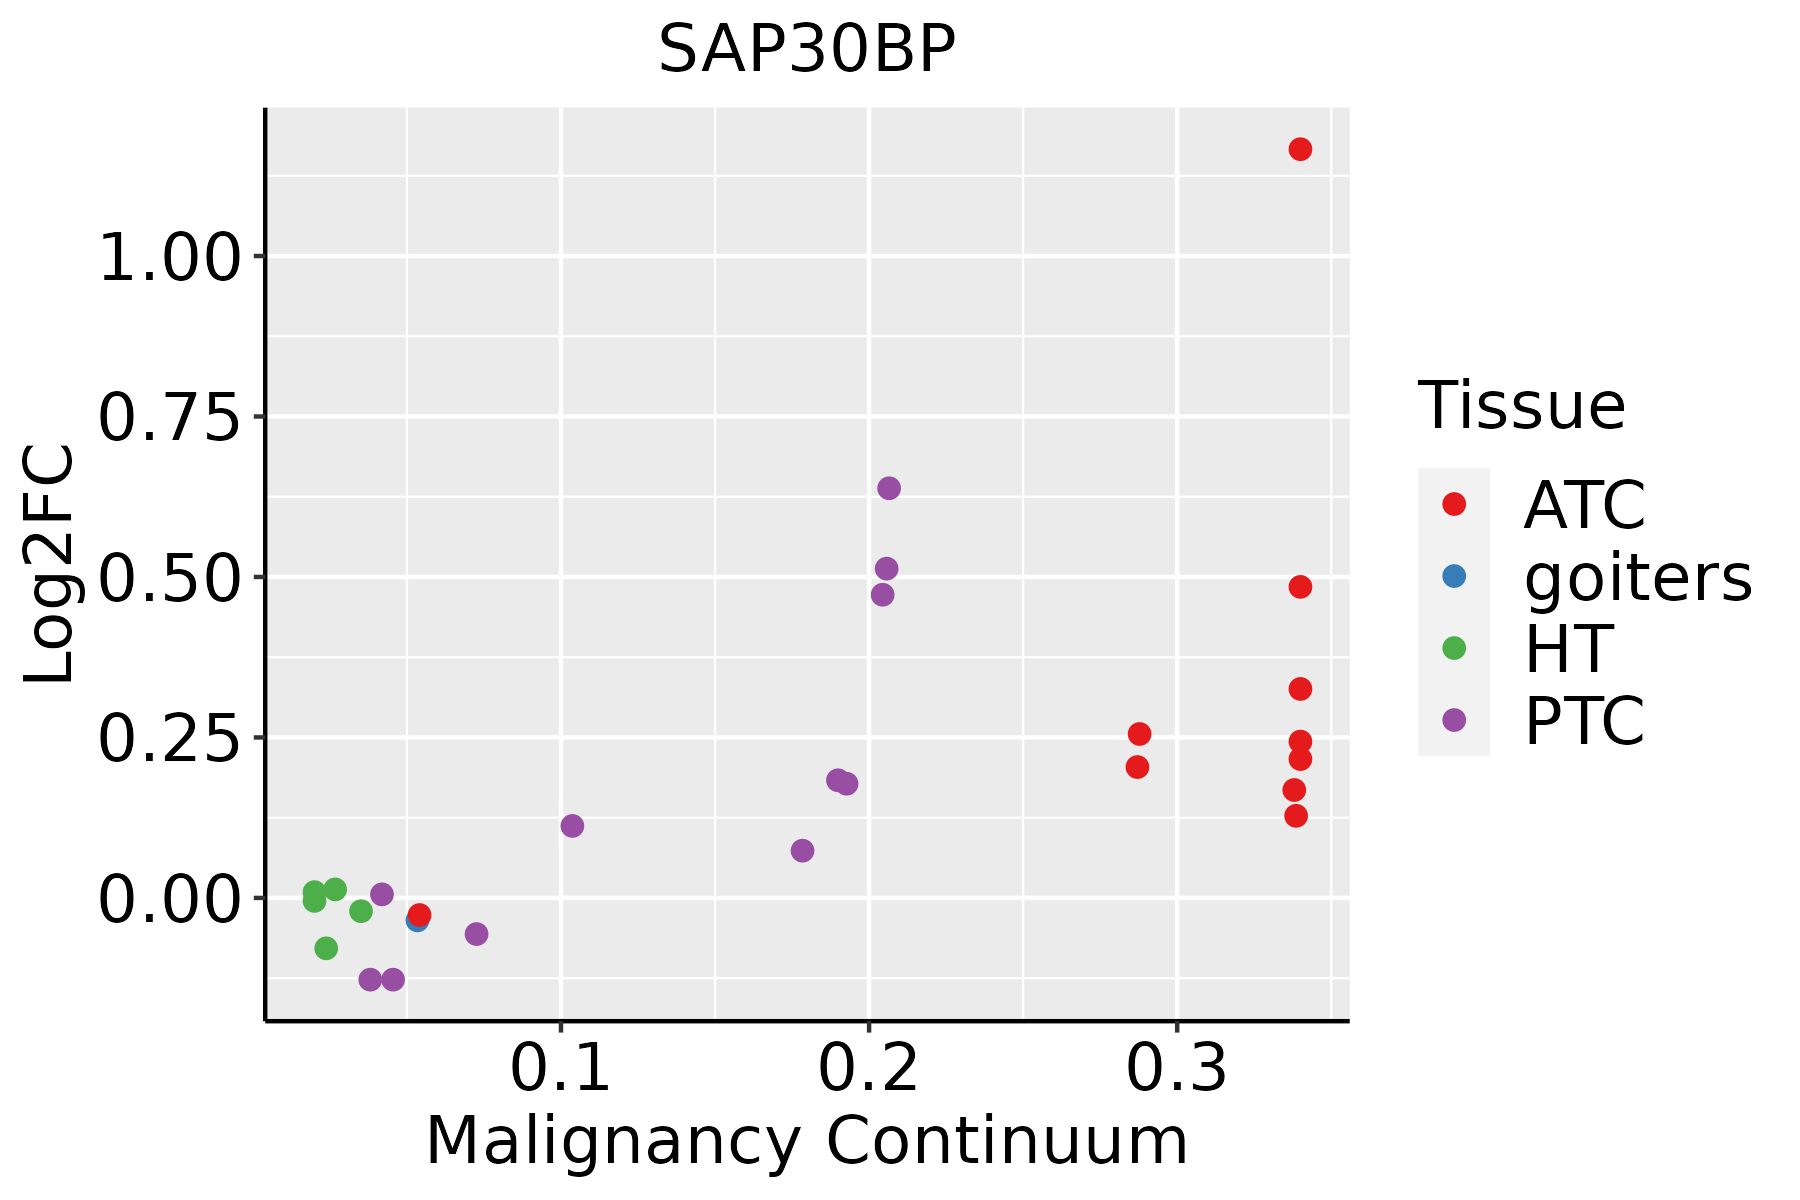
ATC: Anaplastic thyroid cancer
HT: Hashimoto's thyroiditis
PTC: Papillary thyroid cancer
∗log2FC in expression of this searched gene in stem-like cells from each diseased tissue sample relative to stem-like cells in normal samples in each tissue plotted against the malignancy continuum. Samples are colored based on if they are from different disease stage.

Top

Malignant transformation related pathway analysis

check buttonFind out the enriched GO biological processes and KEGG pathways involved in transition from healthy to precancer to cancer
check button Figure of enriched GO biological processes.
TissueDisease StageEnriched GO biological Processes
ColorectumADGO analysis - Figure of enriched GO biological processes: Top 15 enriched GO BP terms are showed in the bar plot of each disease state in each tissue. Each row represents a significant GO biological process which is colored according to the -log10(p.adjust).
ColorectumSERGO analysis - Figure of enriched GO biological processes: Top 15 enriched GO BP terms are showed in the bar plot of each disease state in each tissue. Each row represents a significant GO biological process which is colored according to the -log10(p.adjust).
ColorectumMSSGO analysis - Figure of enriched GO biological processes: Top 15 enriched GO BP terms are showed in the bar plot of each disease state in each tissue. Each row represents a significant GO biological process which is colored according to the -log10(p.adjust).
ColorectumMSI-HGO analysis - Figure of enriched GO biological processes: Top 15 enriched GO BP terms are showed in the bar plot of each disease state in each tissue. Each row represents a significant GO biological process which is colored according to the -log10(p.adjust).
ColorectumFAPGO analysis - Figure of enriched GO biological processes: Top 15 enriched GO BP terms are showed in the bar plot of each disease state in each tissue. Each row represents a significant GO biological process which is colored according to the -log10(p.adjust).
∗Top 15 enriched GO BP terms are showed in the bar plot of each disease state in each tissue. Each row represents a significant GO biological process which is colored according to the -log10(p.adjust).
Page: 1 2 3 4 5 6 7 8 9 

check button Enriched GO biological processes.
GO IDTissueDisease StageDescriptionGene RatioBg Ratiopvaluep.adjustCount
GO:001657015EsophagusESCChistone modification323/8552463/187232.61e-267.88e-24323
GO:000961518EsophagusESCCresponse to virus238/8552367/187236.65e-143.32e-12238
GO:0044403111EsophagusESCCbiological process involved in symbiotic interaction186/8552290/187231.43e-104.16e-09186
GO:003105614EsophagusESCCregulation of histone modification106/8552152/187231.52e-093.55e-08106
GO:00356015EsophagusESCCprotein deacylation79/8552112/187238.30e-081.42e-0679
GO:00987325EsophagusESCCmacromolecule deacylation80/8552116/187233.19e-074.50e-0680
GO:00165754EsophagusESCChistone deacetylation60/855282/187233.85e-075.32e-0660
GO:00310583EsophagusESCCpositive regulation of histone modification65/855292/187231.04e-061.31e-0565
GO:00064765EsophagusESCCprotein deacetylation70/8552101/187231.29e-061.58e-0570
GO:005185115EsophagusESCCmodulation by host of symbiont process43/855260/187234.00e-053.22e-0443
GO:005181714EsophagusESCCmodulation of process of other organism involved in symbiotic interaction54/855281/187231.09e-047.64e-0454
GO:00903122EsophagusESCCpositive regulation of protein deacetylation20/855225/187234.81e-042.69e-0320
GO:003582114EsophagusESCCmodulation of process of other organism64/8552106/187231.61e-037.50e-0364
GO:005170214EsophagusESCCbiological process involved in interaction with symbiont57/855294/187232.46e-031.07e-0257
GO:00310652EsophagusESCCpositive regulation of histone deacetylation15/855219/187233.29e-031.35e-0215
GO:00310631EsophagusESCCregulation of histone deacetylation21/855231/187231.10e-023.70e-0221
GO:00903114EsophagusESCCregulation of protein deacetylation30/855248/187231.40e-024.57e-0230
GO:004440312LiverCirrhoticbiological process involved in symbiotic interaction131/4634290/187232.00e-141.84e-12131
GO:00518171LiverCirrhoticmodulation of process of other organism involved in symbiotic interaction44/463481/187231.11e-084.26e-0744
GO:005170211LiverCirrhoticbiological process involved in interaction with symbiont48/463494/187233.41e-081.14e-0648
Page: 1 2 3 4 5 6 7 

check button Enriched KEGG pathways.
Pathway IDTissueDisease StageDescriptionGene RatioBg Ratiopvaluep.adjustqvalueCount
Page: 1 

Top

Cell-cell communication analysis

check buttonIdentification of potential cell-cell interactions between two cell types and their ligand-receptor pairs for different disease states
LigandReceptorLRpairPathwayTissueDisease Stage
Page: 1 

Top

Single-cell gene regulatory network inference analysis

check buttonFind out the significant the regulons (TFs) and the target genes of each regulon across cell types for different disease states
TFCell TypeTissueDisease StageTarget GeneRSSRegulon Activity
∗The dot plots of a searched regulon are shown for all cell subpopulations in each disease state of each tissue based on the regulon specific score inferred using pySCENIC and by calculating the average expression.
Page: 1 

Top

Somatic mutation of malignant transformation related genes

check buttonAnnotation of somatic variants for genes involved in malignant transformation
Hugo SymbolVariant ClassVariant ClassificationdbSNP RSHGVScHGVSpHGVSp ShortSWISSPROTBIOTYPESIFTPolyPhenTumor Sample BarcodeTissueHistologySexAgeStageTherapy TypesDrugsOutcome
SAP30BPSNVMissense_Mutationrs772155823c.130G>Ap.Asp44Asnp.D44NQ9UHR5protein_codingtolerated_low_confidence(0.46)benign(0.006)TCGA-BH-A0DG-01Breastbreast invasive carcinomaFemale<65I/IIChemotherapytaxotereCR
SAP30BPSNVMissense_Mutationnovelc.559G>Cp.Asp187Hisp.D187HQ9UHR5protein_codingdeleterious(0)probably_damaging(0.997)TCGA-VS-A9U6-01Cervixcervical & endocervical cancerFemale<65I/IIChemotherapycisplatinPD
SAP30BPSNVMissense_Mutationc.95G>Ap.Gly32Aspp.G32DQ9UHR5protein_codingtolerated_low_confidence(0.09)benign(0)TCGA-AA-3710-01Colorectumcolon adenocarcinomaFemale>=65I/IIUnknownUnknownSD
SAP30BPSNVMissense_Mutationnovelc.532G>Ap.Gly178Serp.G178SQ9UHR5protein_codingdeleterious(0)probably_damaging(0.999)TCGA-AA-3821-01Colorectumcolon adenocarcinomaFemale>=65I/IIUnknownUnknownSD
SAP30BPSNVMissense_Mutationnovelc.478N>Tp.Arg160Trpp.R160WQ9UHR5protein_codingdeleterious(0.02)probably_damaging(0.999)TCGA-AA-A00N-01Colorectumcolon adenocarcinomaMale>=65I/IIUnknownUnknownPD
SAP30BPSNVMissense_Mutationc.629N>Cp.Lys210Thrp.K210TQ9UHR5protein_codingdeleterious(0)probably_damaging(0.985)TCGA-CM-6674-01Colorectumcolon adenocarcinomaMale<65I/IIUnknownUnknownSD
SAP30BPSNVMissense_Mutationc.898N>Tp.Gly300Cysp.G300CQ9UHR5protein_codingdeleterious(0)probably_damaging(1)TCGA-G4-6628-01Colorectumcolon adenocarcinomaMale>=65I/IIUnknownUnknownSD
SAP30BPSNVMissense_Mutationnovelc.251N>Ap.Ala84Aspp.A84DQ9UHR5protein_codingtolerated_low_confidence(0.14)benign(0)TCGA-A5-A2K5-01Endometriumuterine corpus endometrioid carcinomaFemale>=65I/IIUnknownUnknownSD
SAP30BPSNVMissense_Mutationnovelc.98N>Ap.Ser33Asnp.S33NQ9UHR5protein_codingtolerated_low_confidence(0.34)benign(0.006)TCGA-AP-A1DK-01Endometriumuterine corpus endometrioid carcinomaFemale<65I/IIUnknownUnknownSD
SAP30BPSNVMissense_Mutationnovelc.743N>Tp.Ala248Valp.A248VQ9UHR5protein_codingtolerated(0.27)benign(0.006)TCGA-AP-A1DK-01Endometriumuterine corpus endometrioid carcinomaFemale<65I/IIUnknownUnknownSD
Page: 1 2 3 

Top

Related drugs of malignant transformation related genes

check buttonIdentification of chemicals and drugs interact with genes involved in malignant transfromation
(DGIdb 4.0)
Entrez IDSymbolCategoryInteraction TypesDrug Claim NameDrug NamePMIDs
Page: 1