Schematic overview of the cellular and molecular mechanisms involved in the cancer progression, including the proposed cellular and molecular mechanisms in cancer cells trajectory. AT1: alveolar type 1 cells; AT2: alveolar type 2 cells; AAH: atypical adenomatous hyperplasia; AIS: adenocarcinoma in situ; MIA: minimally invasive adenocarcinoma; IA: invasive adenocarcinoma; EMT: epithelial-mesenchymal transition

Home

Download

Statistics

Help

Contact

Center for Computational Systems Medicine
leaf

Gene summary

leaf

Malignant transformation analysis

leaf

Malignant transformation related pathway analysis

leaf

Cell-cell communication analysis

leaf

Single-cell gene regulatory network inference analysis

leaf

Somatic mutation of malignant transformation related genes

leaf

Related drugs of malignant transformation related genes

Gene: SAMSN1

Gene summary for SAMSN1

check button Gene summary.

Gene informationSpeciesHuman
Gene symbol

SAMSN1

Gene ID

64092

Gene nameSAM domain, SH3 domain and nuclear localization signals 1
Gene AliasHACS1
Cytomap21q11.2
Gene Typeprotein-coding
GO ID

GO:0001775

UniProtAcc

Q9NSI8


Top

Malignant transformation analysis

check button Identification of the aberrant gene expression in precancerous and cancerous lesions by comparing the gene expression of stem-like cells in diseased tissues with normal stem cells
check button Malignant transformation involving gene list.
Entrez IDSymbolReplicatesSpeciesOrganTissueAdj P-valueLog2FCMalignancy
64092SAMSN1CA_HPV_1HumanCervixCC1.40e-06-4.84e-010.0264
64092SAMSN1CA_HPV_3HumanCervixCC2.56e-04-3.96e-010.0414
64092SAMSN1N_HPV_2HumanCervixN_HPV2.74e-05-1.35e-01-0.0131
64092SAMSN1CCI_1HumanCervixCC2.95e-05-7.59e-010.528
64092SAMSN1CCI_2HumanCervixCC1.10e-03-7.53e-010.5249
64092SAMSN1CCI_3HumanCervixCC1.06e-07-7.04e-010.516
64092SAMSN1CCII_1HumanCervixCC5.99e-15-8.40e-010.3249
64092SAMSN1TumorHumanCervixCC8.28e-32-8.40e-010.1241
64092SAMSN1sample1HumanCervixCC2.19e-12-8.40e-010.0959
64092SAMSN1sample3HumanCervixCC1.02e-27-8.27e-010.1387
64092SAMSN1H2HumanCervixHSIL_HPV5.10e-23-7.69e-010.0632
64092SAMSN1L1HumanCervixCC2.24e-14-8.30e-010.0802
64092SAMSN1T1HumanCervixCC3.82e-23-8.19e-010.0918
64092SAMSN1T2HumanCervixCC1.33e-06-8.40e-010.0709
64092SAMSN1T3HumanCervixCC1.36e-27-8.33e-010.1389
64092SAMSN1LZE4THumanEsophagusESCC1.60e-057.21e-010.0811
64092SAMSN1LZE6THumanEsophagusESCC2.46e-131.15e+000.0845
64092SAMSN1C21HumanOral cavityOSCC1.15e-104.00e-010.2678
64092SAMSN1C30HumanOral cavityOSCC7.46e-061.83e-010.3055
64092SAMSN1C38HumanOral cavityOSCC1.43e-071.09e+000.172
Page: 1 2 

check button Transcriptomic changes along malignancy continuum.
TissueExpression DynamicsAbbreviation
CervixThe image shows the transcriptomic changes along malignancy continuum.log2FC in expression of this searched gene in stem-like cells from each diseased tissue sample relative to stem-like cells in normal samples in each tissue plotted against the malignancy continuum. Samples are colored based on if they are from different disease stage.CC: Cervix cancer
HSIL_HPV: HPV-infected high-grade squamous intraepithelial lesions
N_HPV: HPV-infected normal cervix
EsophagusThe image shows the transcriptomic changes along malignancy continuum.log2FC in expression of this searched gene in stem-like cells from each diseased tissue sample relative to stem-like cells in normal samples in each tissue plotted against the malignancy continuum. Samples are colored based on if they are from different disease stage.
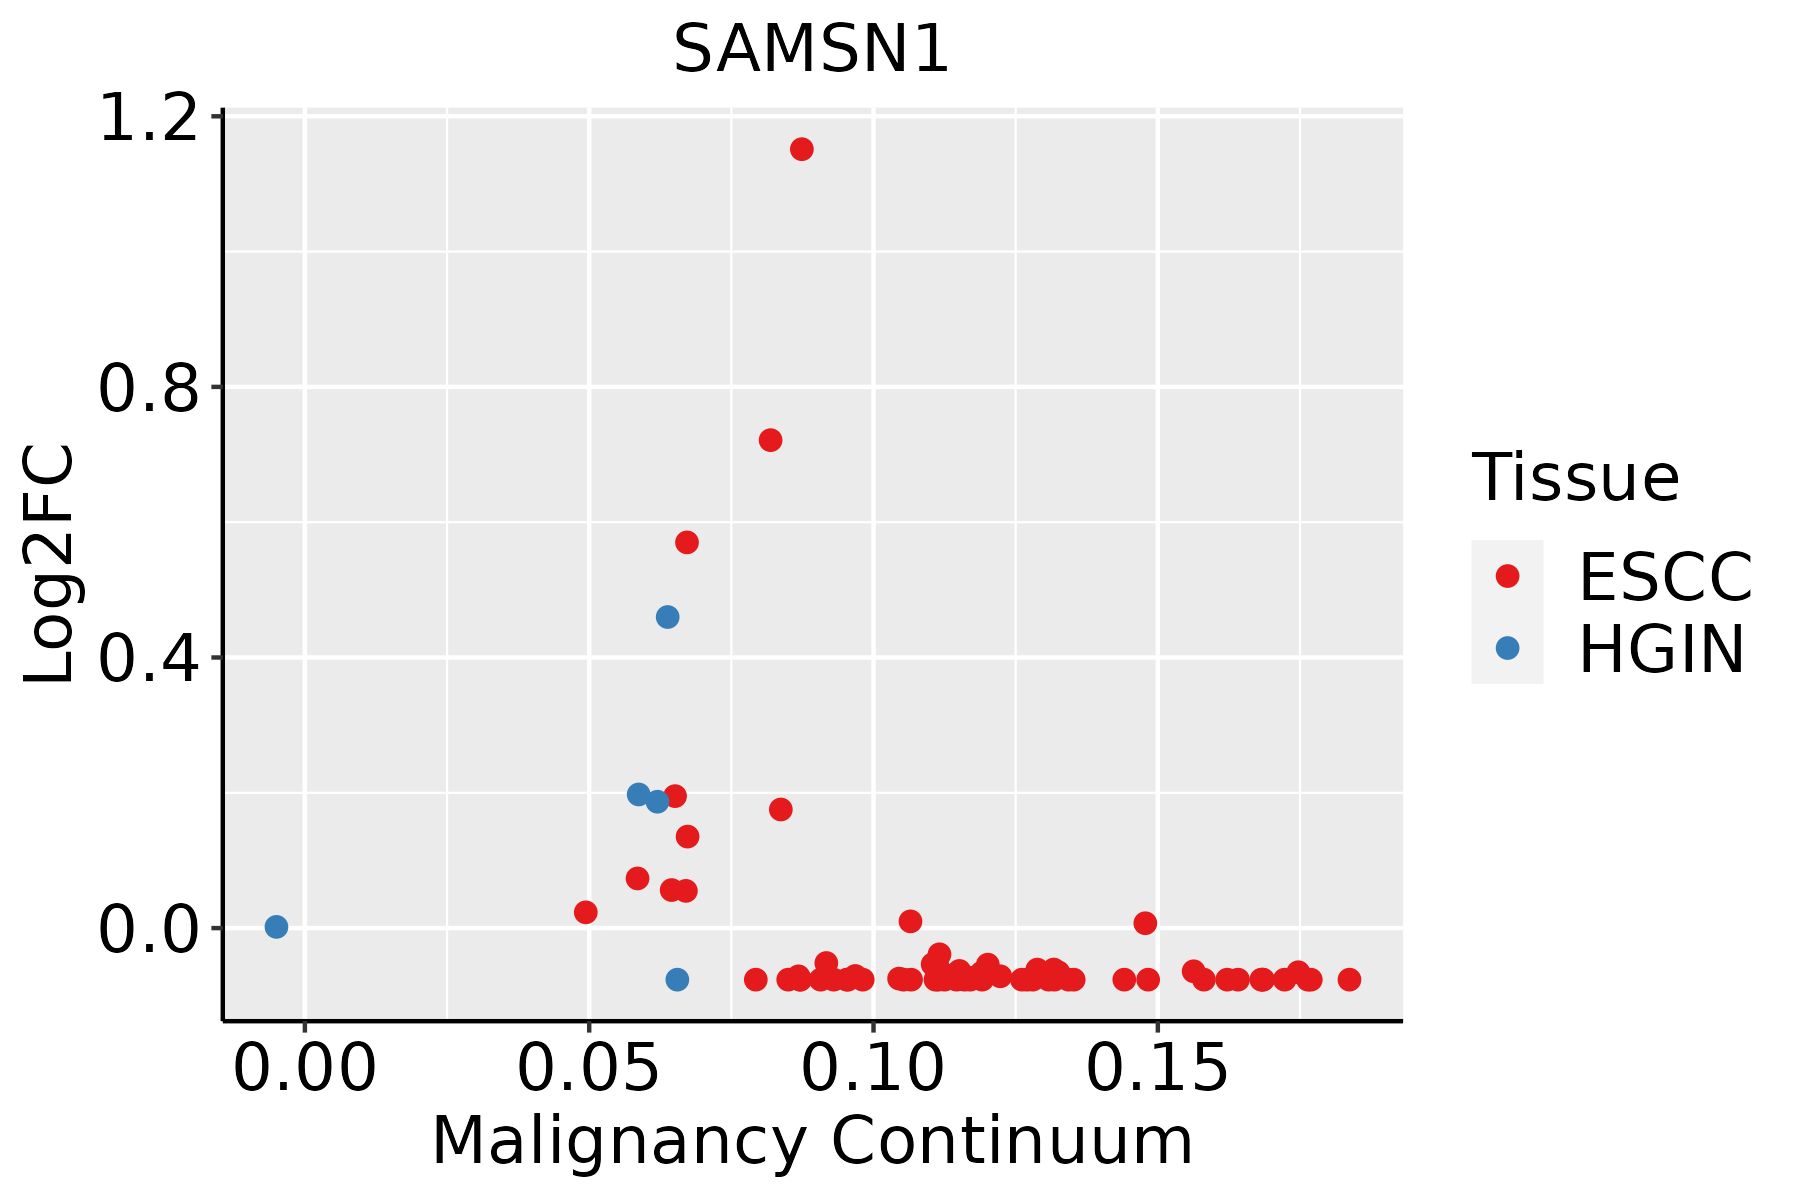
ESCC: Esophageal squamous cell carcinoma
HGIN: High-grade intraepithelial neoplasias
LGIN: Low-grade intraepithelial neoplasias
Oral CavityThe image shows the transcriptomic changes along malignancy continuum.log2FC in expression of this searched gene in stem-like cells from each diseased tissue sample relative to stem-like cells in normal samples in each tissue plotted against the malignancy continuum. Samples are colored based on if they are from different disease stage.
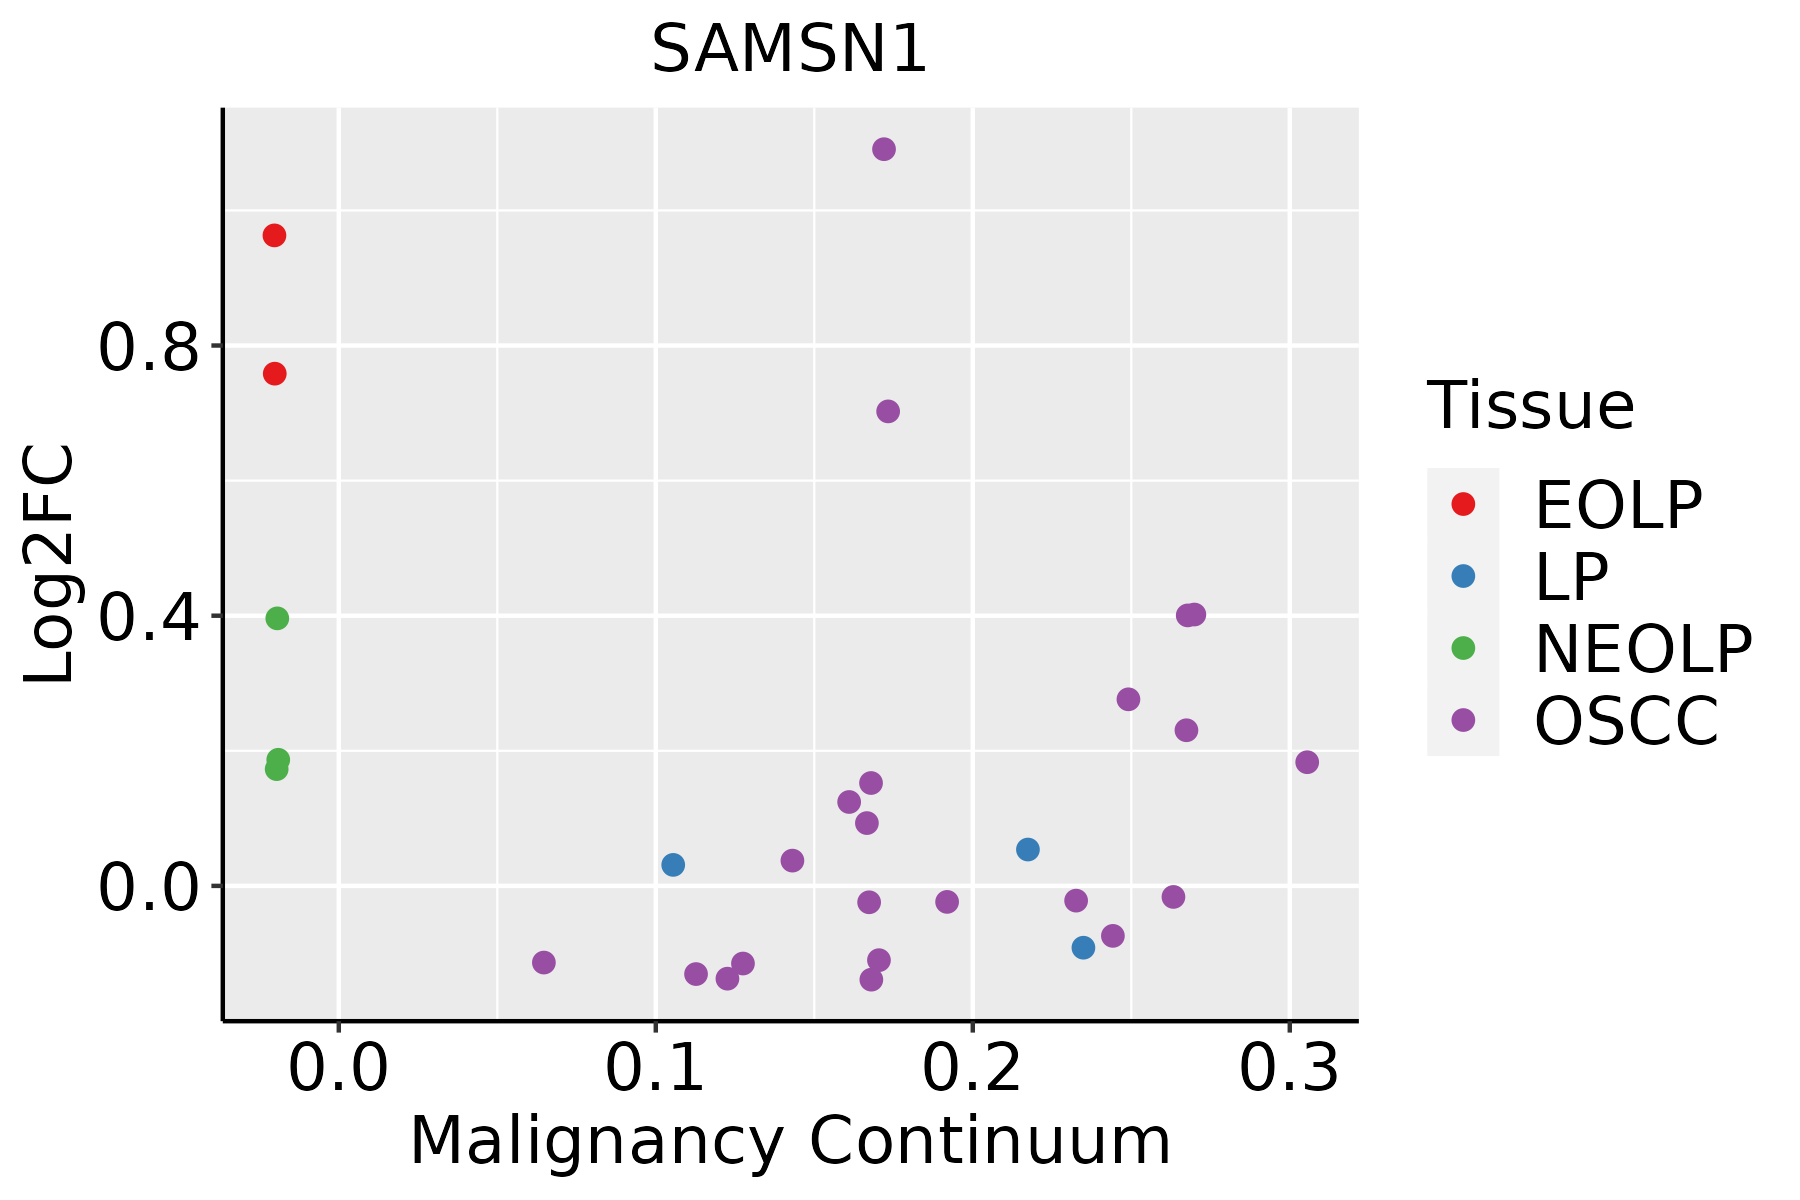
EOLP: Erosive Oral lichen planus
LP: leukoplakia
NEOLP: Non-erosive oral lichen planus
OSCC: Oral squamous cell carcinoma
ProstateThe image shows the transcriptomic changes along malignancy continuum.log2FC in expression of this searched gene in stem-like cells from each diseased tissue sample relative to stem-like cells in normal samples in each tissue plotted against the malignancy continuum. Samples are colored based on if they are from different disease stage.
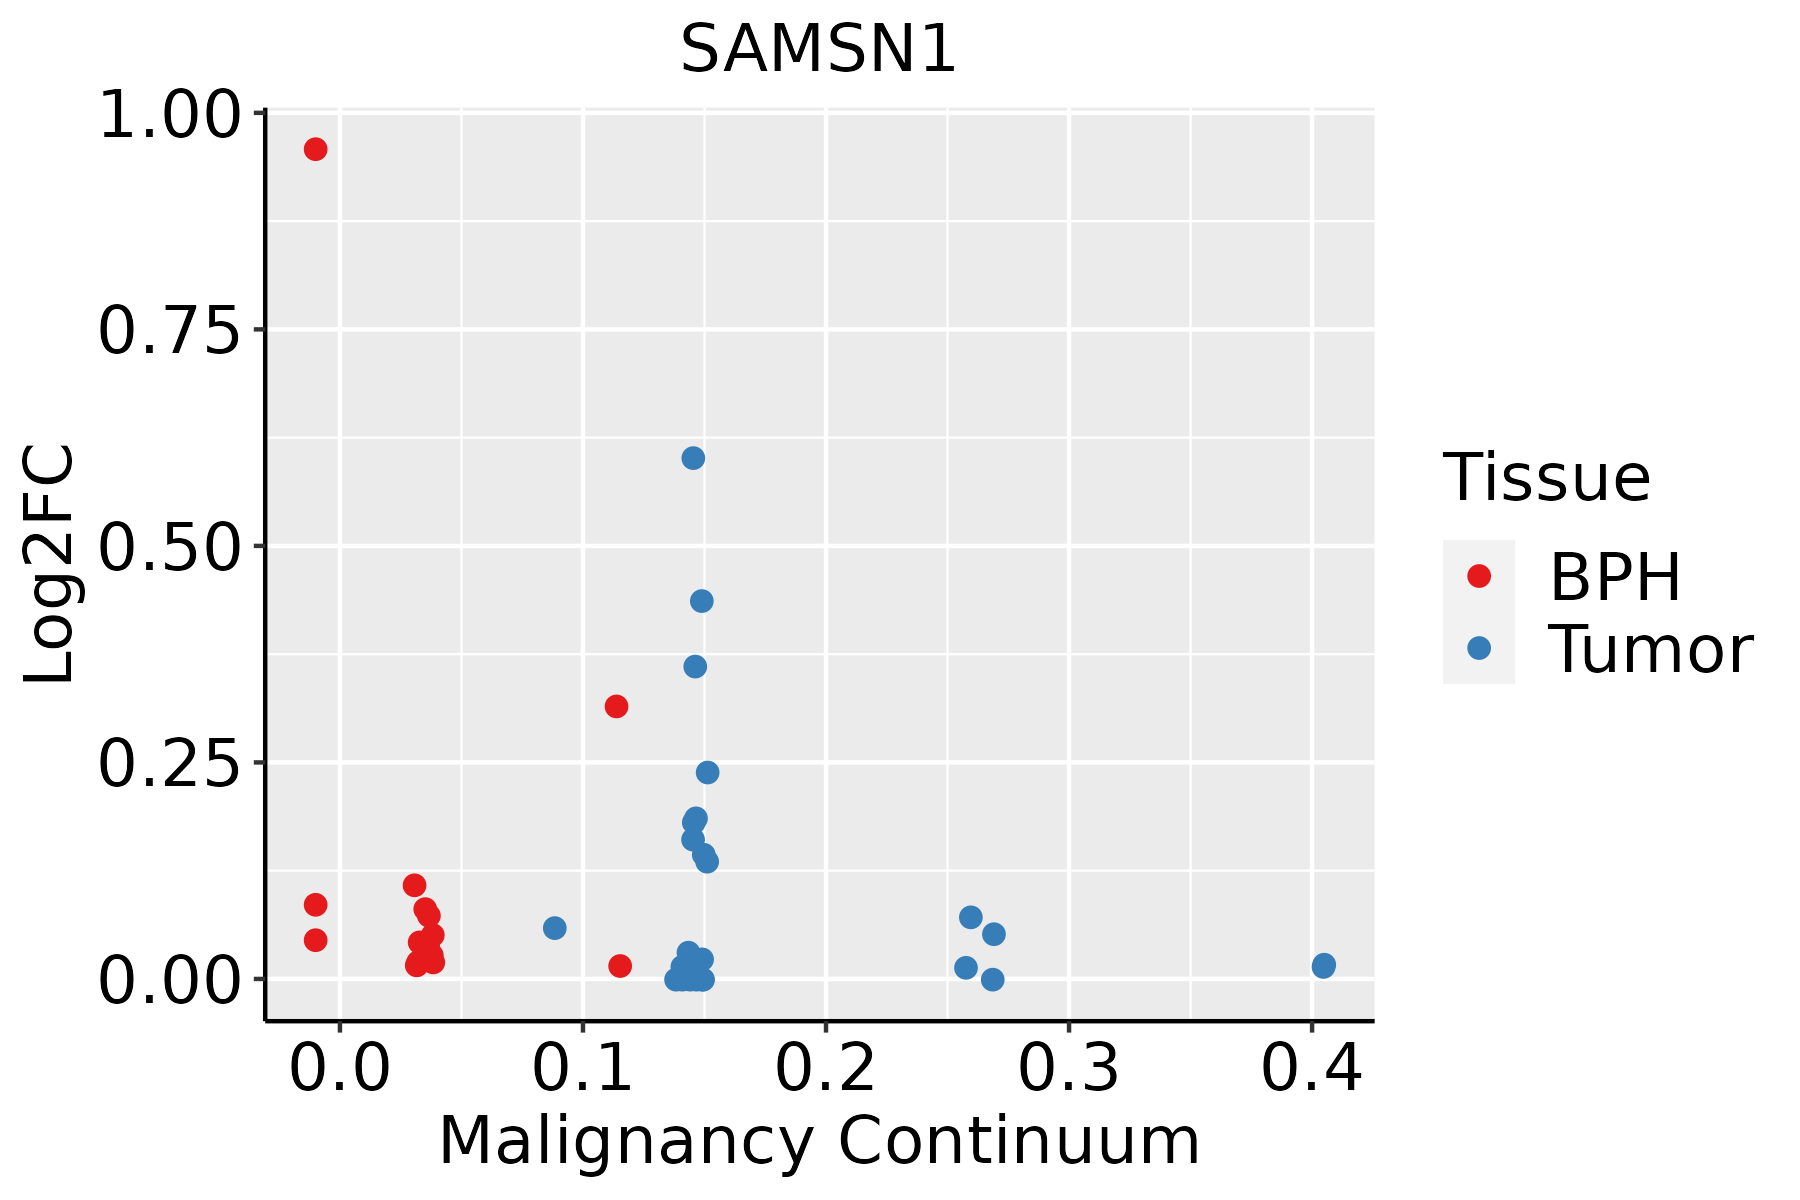
BPH: Benign Prostatic Hyperplasia
∗log2FC in expression of this searched gene in stem-like cells from each diseased tissue sample relative to stem-like cells in normal samples in each tissue plotted against the malignancy continuum. Samples are colored based on if they are from different disease stage.

Top

Malignant transformation related pathway analysis

check buttonFind out the enriched GO biological processes and KEGG pathways involved in transition from healthy to precancer to cancer
check button Figure of enriched GO biological processes.
TissueDisease StageEnriched GO biological Processes
ColorectumADGO analysis - Figure of enriched GO biological processes: Top 15 enriched GO BP terms are showed in the bar plot of each disease state in each tissue. Each row represents a significant GO biological process which is colored according to the -log10(p.adjust).
ColorectumSERGO analysis - Figure of enriched GO biological processes: Top 15 enriched GO BP terms are showed in the bar plot of each disease state in each tissue. Each row represents a significant GO biological process which is colored according to the -log10(p.adjust).
ColorectumMSSGO analysis - Figure of enriched GO biological processes: Top 15 enriched GO BP terms are showed in the bar plot of each disease state in each tissue. Each row represents a significant GO biological process which is colored according to the -log10(p.adjust).
ColorectumMSI-HGO analysis - Figure of enriched GO biological processes: Top 15 enriched GO BP terms are showed in the bar plot of each disease state in each tissue. Each row represents a significant GO biological process which is colored according to the -log10(p.adjust).
ColorectumFAPGO analysis - Figure of enriched GO biological processes: Top 15 enriched GO BP terms are showed in the bar plot of each disease state in each tissue. Each row represents a significant GO biological process which is colored according to the -log10(p.adjust).
∗Top 15 enriched GO BP terms are showed in the bar plot of each disease state in each tissue. Each row represents a significant GO biological process which is colored according to the -log10(p.adjust).
Page: 1 2 3 4 5 6 7 8 9 

check button Enriched GO biological processes.
GO IDTissueDisease StageDescriptionGene RatioBg Ratiopvaluep.adjustCount
GO:00026837CervixCCnegative regulation of immune system process94/2311434/187232.63e-081.87e-0694
GO:004593610CervixCCnegative regulation of phosphate metabolic process88/2311441/187232.92e-068.27e-0588
GO:001056310CervixCCnegative regulation of phosphorus metabolic process88/2311442/187233.21e-068.77e-0588
GO:004232610CervixCCnegative regulation of phosphorylation77/2311385/187231.09e-052.38e-0477
GO:0051250CervixCCnegative regulation of lymphocyte activation39/2311157/187231.23e-052.57e-0439
GO:000193310CervixCCnegative regulation of protein phosphorylation69/2311342/187232.29e-054.01e-0469
GO:0002695CervixCCnegative regulation of leukocyte activation43/2311187/187233.47e-055.60e-0443
GO:0050866CervixCCnegative regulation of cell activation44/2311210/187232.76e-043.02e-0344
GO:00507773CervixCCnegative regulation of immune response41/2311194/187233.63e-043.76e-0341
GO:0002819CervixCCregulation of adaptive immune response35/2311183/187235.38e-033.11e-0235
GO:000268312CervixHSIL_HPVnegative regulation of immune system process39/737434/187231.51e-066.60e-0539
GO:004593615CervixHSIL_HPVnegative regulation of phosphate metabolic process36/737441/187233.12e-058.94e-0436
GO:001056315CervixHSIL_HPVnegative regulation of phosphorus metabolic process36/737442/187233.27e-059.16e-0436
GO:000193314CervixHSIL_HPVnegative regulation of protein phosphorylation30/737342/187233.80e-051.03e-0330
GO:004232614CervixHSIL_HPVnegative regulation of phosphorylation32/737385/187236.03e-051.44e-0332
GO:0050864CervixHSIL_HPVregulation of B cell activation19/737198/187233.19e-045.15e-0319
GO:00028191CervixHSIL_HPVregulation of adaptive immune response17/737183/187239.31e-041.18e-0217
GO:00026951CervixHSIL_HPVnegative regulation of leukocyte activation17/737187/187231.18e-031.41e-0217
GO:00512501CervixHSIL_HPVnegative regulation of lymphocyte activation15/737157/187231.37e-031.56e-0215
GO:00508661CervixHSIL_HPVnegative regulation of cell activation18/737210/187231.68e-031.81e-0218
Page: 1 2 3 4 

check button Enriched KEGG pathways.
Pathway IDTissueDisease StageDescriptionGene RatioBg Ratiopvaluep.adjustqvalueCount
Page: 1 

Top

Cell-cell communication analysis

check buttonIdentification of potential cell-cell interactions between two cell types and their ligand-receptor pairs for different disease states
LigandReceptorLRpairPathwayTissueDisease Stage
Page: 1 

Top

Single-cell gene regulatory network inference analysis

check buttonFind out the significant the regulons (TFs) and the target genes of each regulon across cell types for different disease states
TFCell TypeTissueDisease StageTarget GeneRSSRegulon Activity
∗The dot plots of a searched regulon are shown for all cell subpopulations in each disease state of each tissue based on the regulon specific score inferred using pySCENIC and by calculating the average expression.
Page: 1 

Top

Somatic mutation of malignant transformation related genes

check buttonAnnotation of somatic variants for genes involved in malignant transformation
Hugo SymbolVariant ClassVariant ClassificationdbSNP RSHGVScHGVSpHGVSp ShortSWISSPROTBIOTYPESIFTPolyPhenTumor Sample BarcodeTissueHistologySexAgeStageTherapy TypesDrugsOutcome
SAMSN1SNVMissense_Mutationc.662G>Tp.Arg221Leup.R221LQ9NSI8protein_codingdeleterious(0)probably_damaging(0.998)TCGA-A2-A0EM-01Breastbreast invasive carcinomaFemale>=65I/IIHormone TherapytamoxiphenSD
SAMSN1SNVMissense_Mutationc.1138G>Ap.Glu380Lysp.E380KQ9NSI8protein_codingtolerated(0.1)benign(0.015)TCGA-D8-A1JA-01Breastbreast invasive carcinomaFemale<65III/IVChemotherapyadriamycinPD
SAMSN1SNVMissense_Mutationc.1049N>Cp.Ile350Thrp.I350TQ9NSI8protein_codingtolerated(0.43)possibly_damaging(0.466)TCGA-EW-A2FW-01Breastbreast invasive carcinomaFemale<65I/IIHormone TherapyexemestaneSD
SAMSN1SNVMissense_Mutationnovelc.200N>Gp.Ser67Cysp.S67CQ9NSI8protein_codingtolerated_low_confidence(0.19)benign(0)TCGA-LL-A5YL-01Breastbreast invasive carcinomaFemale<65I/IIChemotherapyadriamycinSD
SAMSN1insertionFrame_Shift_Insnovelc.1016_1017insGAAAGCATGCAGGCATTTTACTTGTp.Asp340LysfsTer20p.D340Kfs*20Q9NSI8protein_codingTCGA-AO-A03T-01Breastbreast invasive carcinomaFemale<65I/IIChemotherapycyclophosphamideSD
SAMSN1insertionNonsense_Mutationnovelc.370_371insTTTCTGAGTGTCAGTTTCTTCTGTTAAAATGp.Gln124LeufsTer11p.Q124Lfs*11Q9NSI8protein_codingTCGA-AR-A0U0-01Breastbreast invasive carcinomaFemale>=65I/IIUnknownUnknownSD
SAMSN1SNVMissense_Mutationnovelc.710N>Cp.Arg237Thrp.R237TQ9NSI8protein_codingdeleterious(0)benign(0.382)TCGA-C5-A1BQ-01Cervixcervical & endocervical cancerFemale>=65III/IVChemotherapycisplatinCR
SAMSN1SNVMissense_Mutationnovelc.493N>Cp.Asp165Hisp.D165HQ9NSI8protein_codingdeleterious(0.01)possibly_damaging(0.66)TCGA-JW-A5VL-01Cervixcervical & endocervical cancerFemale<65I/IIUnknownUnknownSD
SAMSN1SNVMissense_Mutationnovelc.1114G>Ap.Glu372Lysp.E372KQ9NSI8protein_codingdeleterious(0.01)benign(0.006)TCGA-JX-A3Q0-01Cervixcervical & endocervical cancerFemale<65III/IVUnknownUnknownSD
SAMSN1SNVMissense_Mutationnovelc.1152N>Tp.Glu384Aspp.E384DQ9NSI8protein_codingtolerated(0.59)benign(0.036)TCGA-UC-A7PG-06Cervixcervical & endocervical cancerFemale<65III/IVChemotherapycisplatinPD
Page: 1 2 3 4 5 6 7 8 

Top

Related drugs of malignant transformation related genes

check buttonIdentification of chemicals and drugs interact with genes involved in malignant transfromation
(DGIdb 4.0)
Entrez IDSymbolCategoryInteraction TypesDrug Claim NameDrug NamePMIDs
Page: 1