
|
|||||
|
 | |
| |
| |
| |
| |
| |
|
Gene: SAMM50 |
Gene summary for SAMM50 |
| Gene information | Species | Human | Gene symbol | SAMM50 | Gene ID | 25813 |
| Gene name | SAMM50 sorting and assembly machinery component | |
| Gene Alias | CGI-51 | |
| Cytomap | 22q13.31 | |
| Gene Type | protein-coding | GO ID | GO:0006605 | UniProtAcc | Q9Y512 |
Top |
Malignant transformation analysis |
| Identification of the aberrant gene expression in precancerous and cancerous lesions by comparing the gene expression of stem-like cells in diseased tissues with normal stem cells |
| Entrez ID | Symbol | Replicates | Species | Organ | Tissue | Adj P-value | Log2FC | Malignancy |
| 25813 | SAMM50 | LZE2T | Human | Esophagus | ESCC | 4.56e-05 | 8.79e-01 | 0.082 |
| 25813 | SAMM50 | LZE4T | Human | Esophagus | ESCC | 2.34e-10 | 3.88e-01 | 0.0811 |
| 25813 | SAMM50 | LZE7T | Human | Esophagus | ESCC | 6.17e-18 | 9.65e-01 | 0.0667 |
| 25813 | SAMM50 | LZE8T | Human | Esophagus | ESCC | 1.60e-05 | 3.39e-01 | 0.067 |
| 25813 | SAMM50 | LZE21D1 | Human | Esophagus | HGIN | 4.95e-02 | 3.39e-01 | 0.0632 |
| 25813 | SAMM50 | LZE22D1 | Human | Esophagus | HGIN | 4.97e-04 | 1.15e-01 | 0.0595 |
| 25813 | SAMM50 | LZE24T | Human | Esophagus | ESCC | 6.80e-22 | 5.48e-01 | 0.0596 |
| 25813 | SAMM50 | LZE21T | Human | Esophagus | ESCC | 1.17e-07 | 5.17e-01 | 0.0655 |
| 25813 | SAMM50 | LZE6T | Human | Esophagus | ESCC | 1.39e-05 | 3.52e-01 | 0.0845 |
| 25813 | SAMM50 | P1T-E | Human | Esophagus | ESCC | 1.60e-09 | 3.61e-01 | 0.0875 |
| 25813 | SAMM50 | P2T-E | Human | Esophagus | ESCC | 1.63e-40 | 6.60e-01 | 0.1177 |
| 25813 | SAMM50 | P4T-E | Human | Esophagus | ESCC | 4.25e-32 | 7.34e-01 | 0.1323 |
| 25813 | SAMM50 | P5T-E | Human | Esophagus | ESCC | 4.20e-26 | 5.24e-01 | 0.1327 |
| 25813 | SAMM50 | P8T-E | Human | Esophagus | ESCC | 1.91e-31 | 5.33e-01 | 0.0889 |
| 25813 | SAMM50 | P9T-E | Human | Esophagus | ESCC | 2.61e-23 | 4.14e-01 | 0.1131 |
| 25813 | SAMM50 | P10T-E | Human | Esophagus | ESCC | 4.21e-45 | 7.11e-01 | 0.116 |
| 25813 | SAMM50 | P11T-E | Human | Esophagus | ESCC | 2.60e-19 | 8.07e-01 | 0.1426 |
| 25813 | SAMM50 | P12T-E | Human | Esophagus | ESCC | 6.57e-48 | 8.05e-01 | 0.1122 |
| 25813 | SAMM50 | P15T-E | Human | Esophagus | ESCC | 1.58e-43 | 8.75e-01 | 0.1149 |
| 25813 | SAMM50 | P16T-E | Human | Esophagus | ESCC | 4.96e-55 | 9.29e-01 | 0.1153 |
| Page: 1 2 3 4 5 6 |
| Tissue | Expression Dynamics | Abbreviation |
| Esophagus | 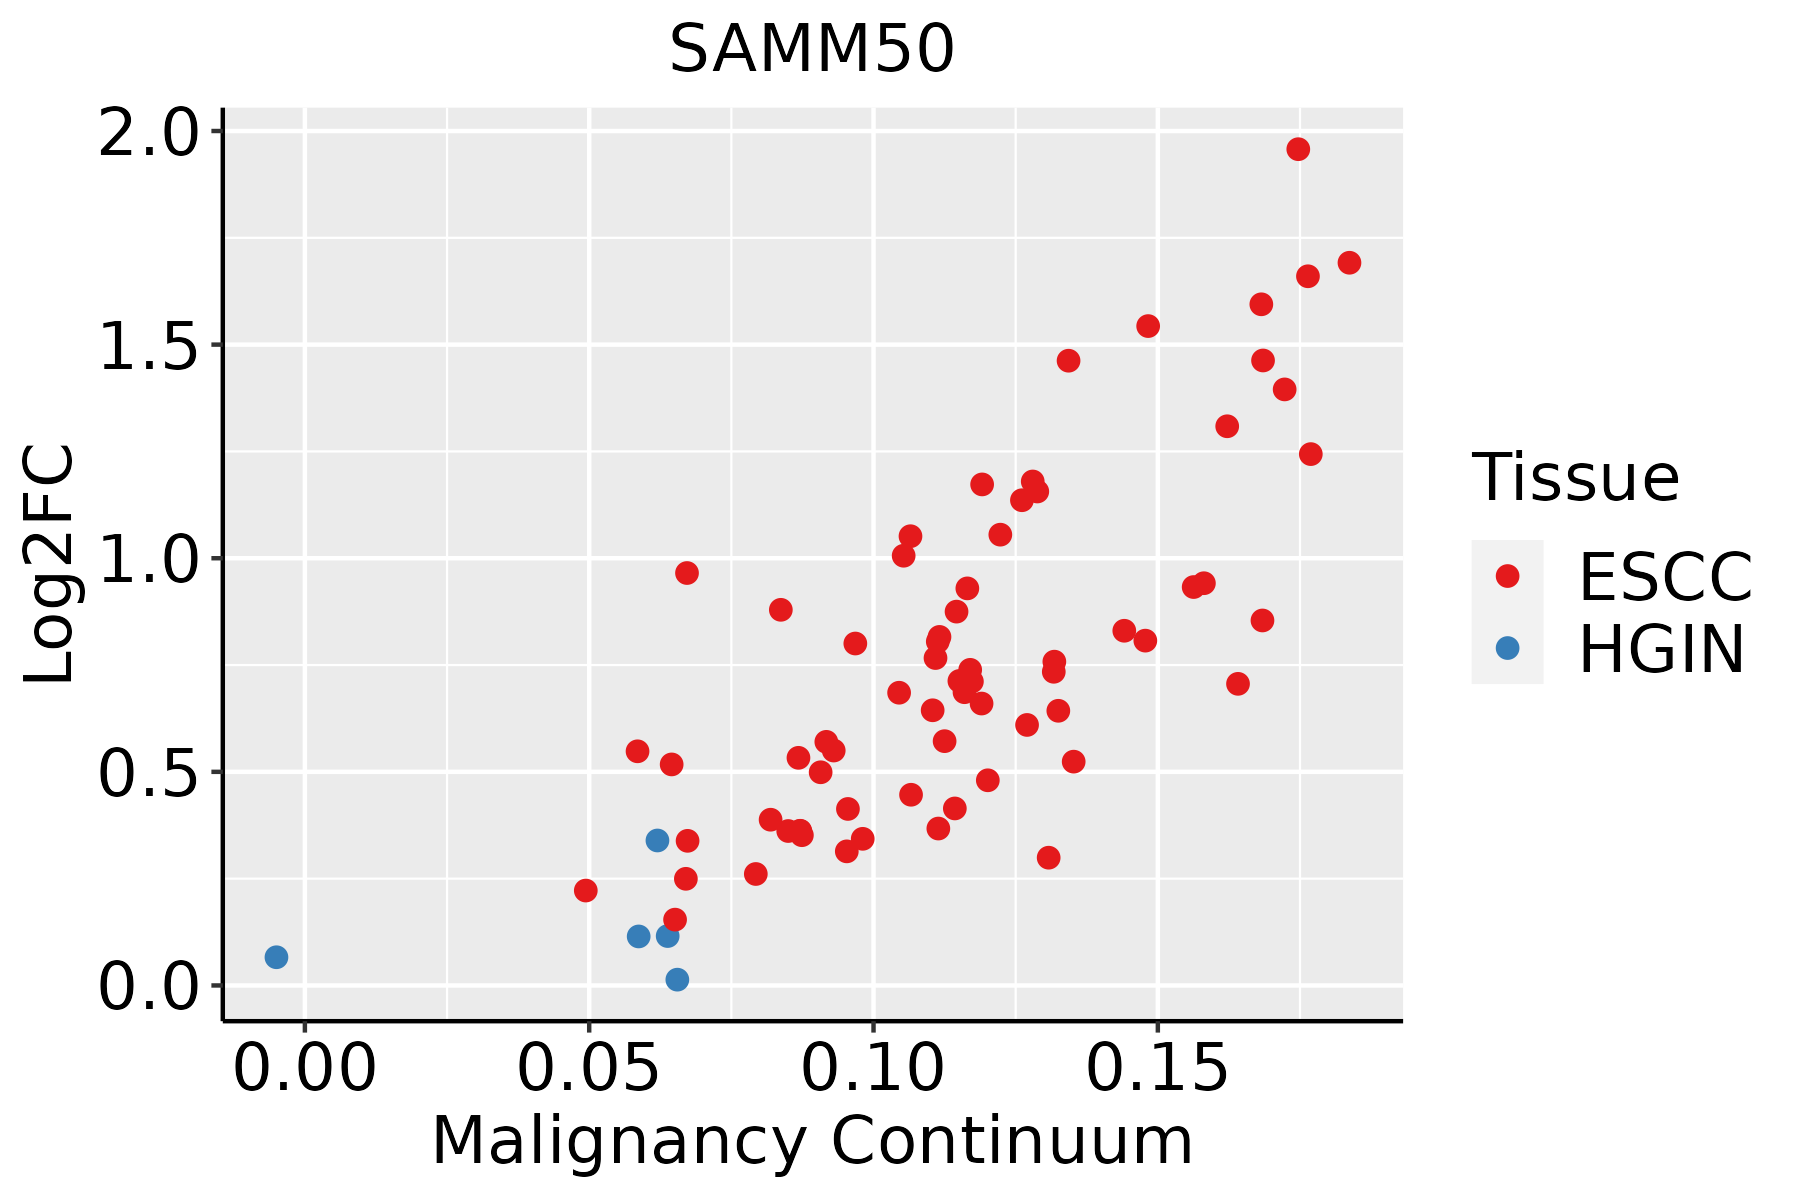 | ESCC: Esophageal squamous cell carcinoma |
| HGIN: High-grade intraepithelial neoplasias | ||
| LGIN: Low-grade intraepithelial neoplasias | ||
| Liver |  | HCC: Hepatocellular carcinoma |
| NAFLD: Non-alcoholic fatty liver disease | ||
| Oral Cavity | 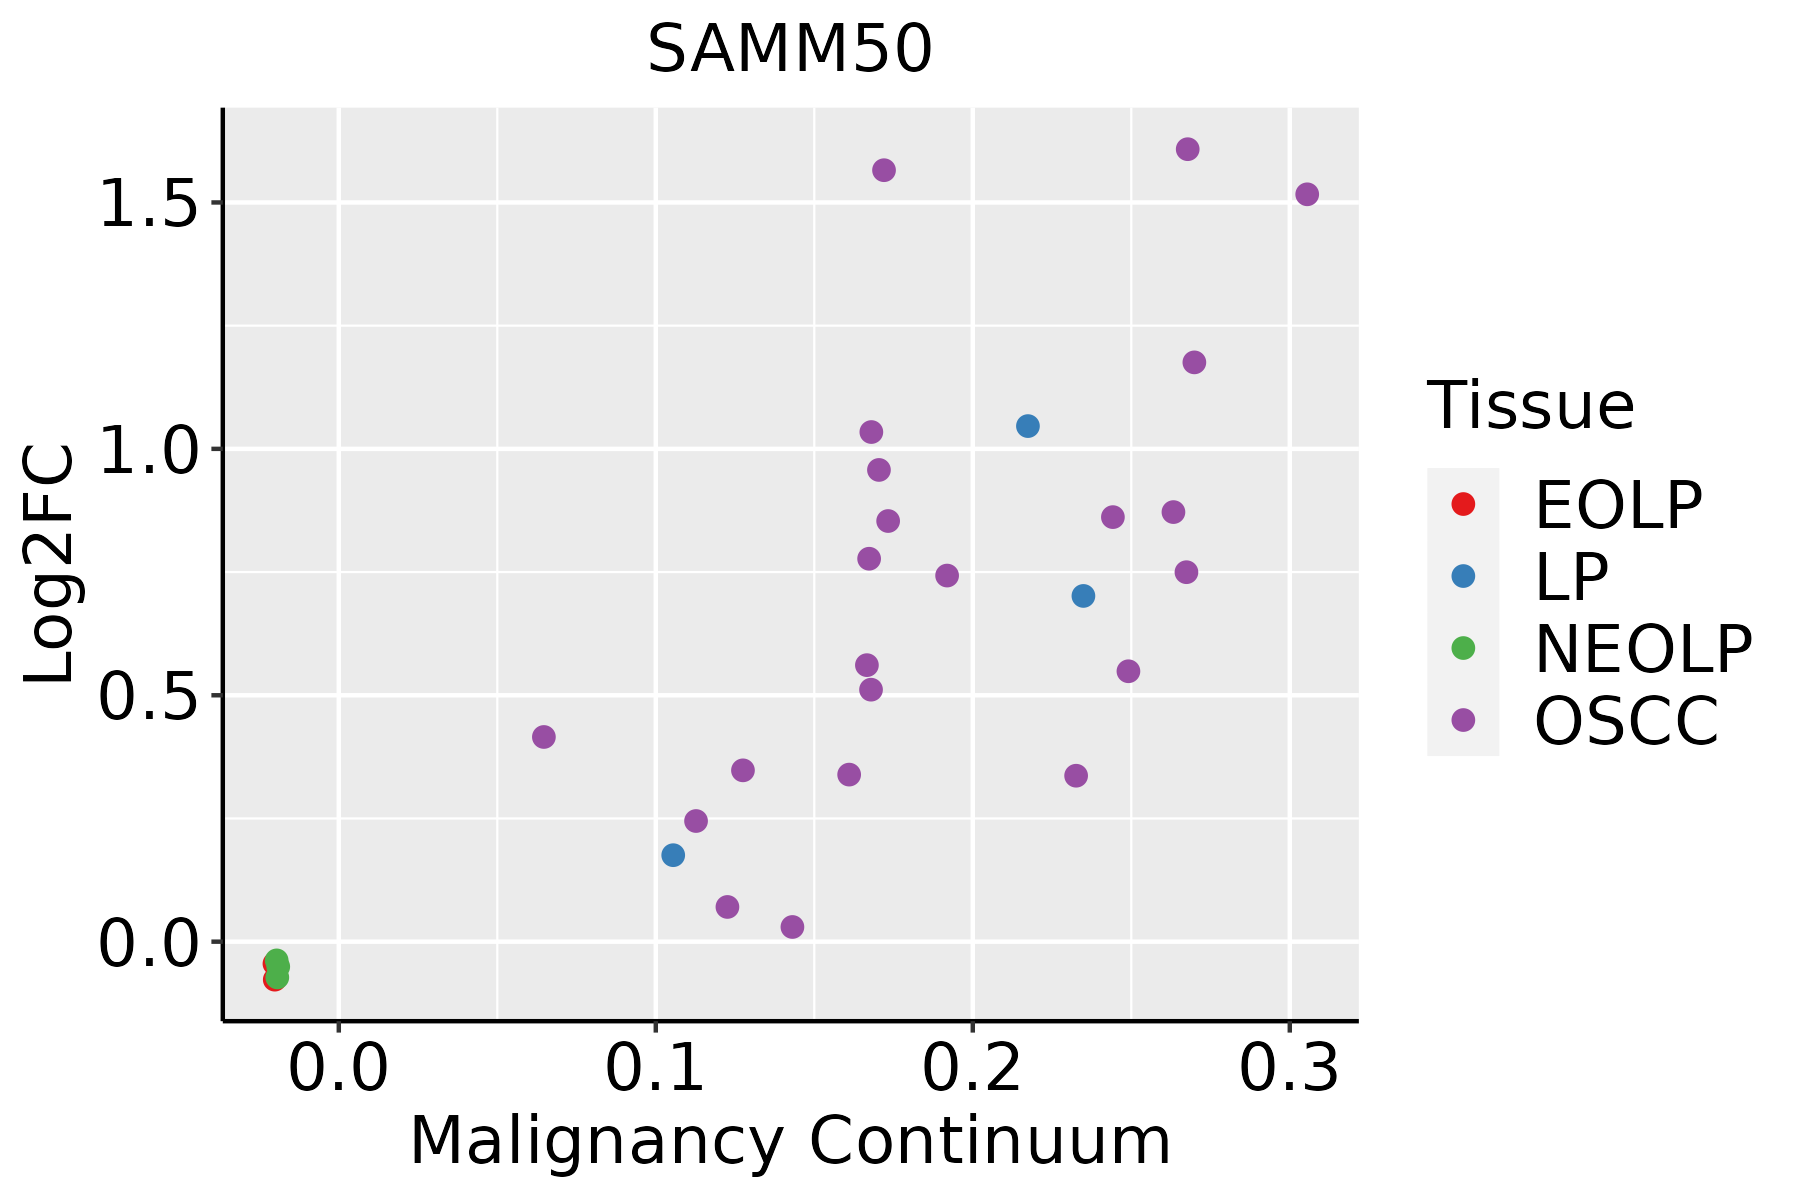 | EOLP: Erosive Oral lichen planus |
| LP: leukoplakia | ||
| NEOLP: Non-erosive oral lichen planus | ||
| OSCC: Oral squamous cell carcinoma | ||
| Skin |  | AK: Actinic keratosis |
| cSCC: Cutaneous squamous cell carcinoma | ||
| SCCIS:squamous cell carcinoma in situ | ||
| Thyroid | 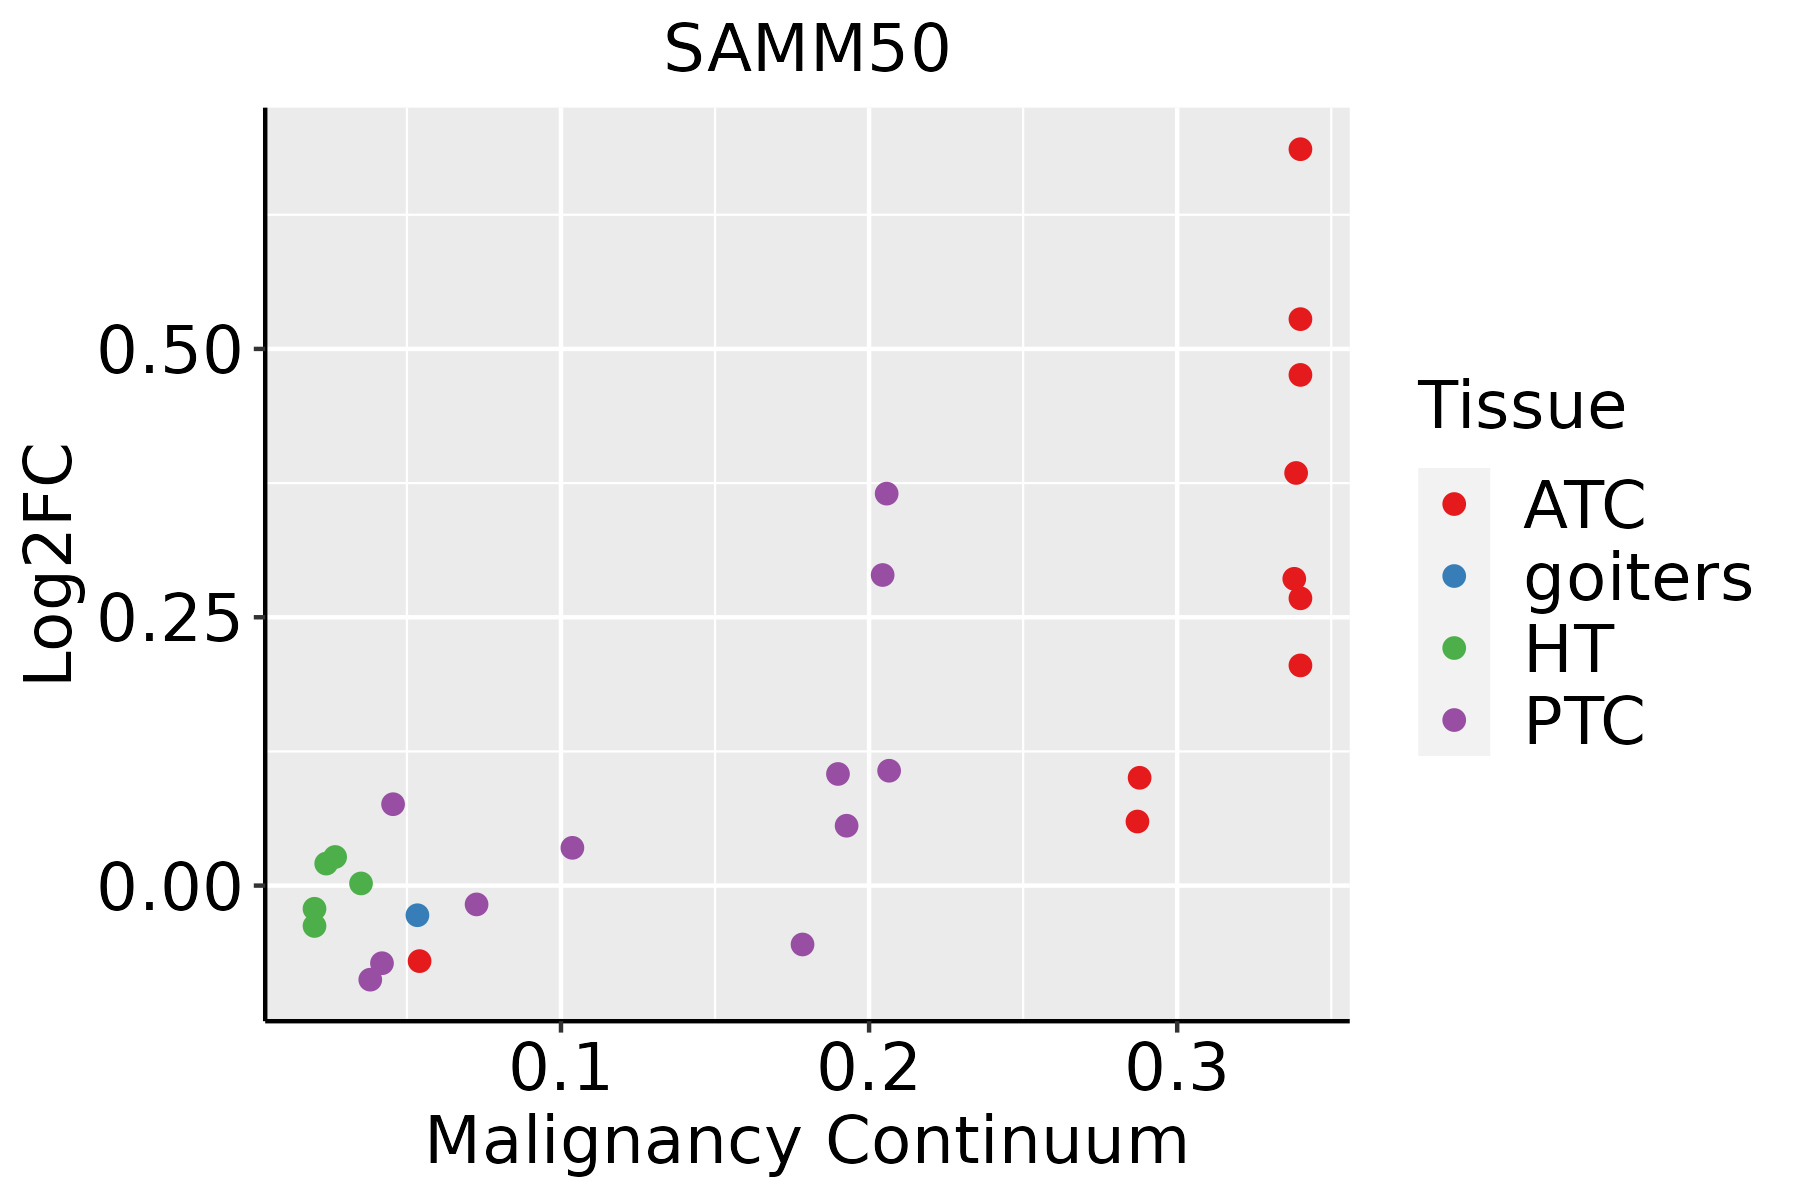 | ATC: Anaplastic thyroid cancer |
| HT: Hashimoto's thyroiditis | ||
| PTC: Papillary thyroid cancer |
| ∗log2FC in expression of this searched gene in stem-like cells from each diseased tissue sample relative to stem-like cells in normal samples in each tissue plotted against the malignancy continuum. Samples are colored based on if they are from different disease stage. |
Top |
Malignant transformation related pathway analysis |
| Find out the enriched GO biological processes and KEGG pathways involved in transition from healthy to precancer to cancer |
| Tissue | Disease Stage | Enriched GO biological Processes |
| Colorectum | AD |  |
| Colorectum | SER |  |
| Colorectum | MSS |  |
| Colorectum | MSI-H |  |
| Colorectum | FAP |  |
| ∗Top 15 enriched GO BP terms are showed in the bar plot of each disease state in each tissue. Each row represents a significant GO biological process which is colored according to the -log10(p.adjust). |
| Page: 1 2 3 4 5 6 7 8 9 |
| GO ID | Tissue | Disease Stage | Description | Gene Ratio | Bg Ratio | pvalue | p.adjust | Count |
| GO:003310820 | Esophagus | HGIN | mitochondrial respiratory chain complex assembly | 47/2587 | 93/18723 | 3.15e-17 | 8.60e-15 | 47 |
| GO:007259420 | Esophagus | HGIN | establishment of protein localization to organelle | 120/2587 | 422/18723 | 1.73e-15 | 4.00e-13 | 120 |
| GO:000683920 | Esophagus | HGIN | mitochondrial transport | 74/2587 | 254/18723 | 1.32e-10 | 1.32e-08 | 74 |
| GO:007058520 | Esophagus | HGIN | protein localization to mitochondrion | 43/2587 | 125/18723 | 4.43e-09 | 3.03e-07 | 43 |
| GO:007265520 | Esophagus | HGIN | establishment of protein localization to mitochondrion | 41/2587 | 120/18723 | 1.26e-08 | 7.96e-07 | 41 |
| GO:000660525 | Esophagus | HGIN | protein targeting | 78/2587 | 314/18723 | 1.08e-07 | 5.47e-06 | 78 |
| GO:009015020 | Esophagus | HGIN | establishment of protein localization to membrane | 67/2587 | 260/18723 | 1.96e-07 | 9.57e-06 | 67 |
| GO:000700618 | Esophagus | HGIN | mitochondrial membrane organization | 37/2587 | 116/18723 | 4.61e-07 | 2.07e-05 | 37 |
| GO:000662620 | Esophagus | HGIN | protein targeting to mitochondrion | 33/2587 | 100/18723 | 7.99e-07 | 3.35e-05 | 33 |
| GO:00512057 | Esophagus | HGIN | protein insertion into membrane | 21/2587 | 57/18723 | 1.16e-05 | 3.29e-04 | 21 |
| GO:001703817 | Esophagus | HGIN | protein import | 51/2587 | 206/18723 | 1.79e-05 | 4.86e-04 | 51 |
| GO:00070076 | Esophagus | HGIN | inner mitochondrial membrane organization | 16/2587 | 38/18723 | 1.82e-05 | 4.93e-04 | 16 |
| GO:009015117 | Esophagus | HGIN | establishment of protein localization to mitochondrial membrane | 13/2587 | 30/18723 | 7.76e-05 | 1.74e-03 | 13 |
| GO:00512049 | Esophagus | HGIN | protein insertion into mitochondrial membrane | 10/2587 | 25/18723 | 1.12e-03 | 1.36e-02 | 10 |
| GO:0072594110 | Esophagus | ESCC | establishment of protein localization to organelle | 311/8552 | 422/18723 | 3.02e-32 | 2.13e-29 | 311 |
| GO:0006605111 | Esophagus | ESCC | protein targeting | 229/8552 | 314/18723 | 4.93e-23 | 1.01e-20 | 229 |
| GO:0006839110 | Esophagus | ESCC | mitochondrial transport | 187/8552 | 254/18723 | 8.35e-20 | 9.81e-18 | 187 |
| GO:0033108110 | Esophagus | ESCC | mitochondrial respiratory chain complex assembly | 83/8552 | 93/18723 | 9.56e-19 | 1.05e-16 | 83 |
| GO:0090150110 | Esophagus | ESCC | establishment of protein localization to membrane | 182/8552 | 260/18723 | 1.27e-15 | 8.19e-14 | 182 |
| GO:0072655110 | Esophagus | ESCC | establishment of protein localization to mitochondrion | 97/8552 | 120/18723 | 2.17e-15 | 1.33e-13 | 97 |
| Page: 1 2 3 4 5 6 7 |
| Pathway ID | Tissue | Disease Stage | Description | Gene Ratio | Bg Ratio | pvalue | p.adjust | qvalue | Count |
| Page: 1 |
Top |
Cell-cell communication analysis |
| Identification of potential cell-cell interactions between two cell types and their ligand-receptor pairs for different disease states |
| Ligand | Receptor | LRpair | Pathway | Tissue | Disease Stage |
| Page: 1 |
Top |
Single-cell gene regulatory network inference analysis |
| Find out the significant the regulons (TFs) and the target genes of each regulon across cell types for different disease states |
| TF | Cell Type | Tissue | Disease Stage | Target Gene | RSS | Regulon Activity |
| ∗The dot plots of a searched regulon are shown for all cell subpopulations in each disease state of each tissue based on the regulon specific score inferred using pySCENIC and by calculating the average expression. |
| Page: 1 |
Top |
Somatic mutation of malignant transformation related genes |
| Annotation of somatic variants for genes involved in malignant transformation |
| Hugo Symbol | Variant Class | Variant Classification | dbSNP RS | HGVSc | HGVSp | HGVSp Short | SWISSPROT | BIOTYPE | SIFT | PolyPhen | Tumor Sample Barcode | Tissue | Histology | Sex | Age | Stage | Therapy Types | Drugs | Outcome |
| SAMM50 | SNV | Missense_Mutation | c.1120N>A | p.Leu374Ile | p.L374I | Q9Y512 | protein_coding | deleterious(0.04) | benign(0.168) | TCGA-EW-A1IZ-01 | Breast | breast invasive carcinoma | Female | <65 | III/IV | Chemotherapy | taxotere | SD | |
| SAMM50 | SNV | Missense_Mutation | rs755098914 | c.664A>C | p.Thr222Pro | p.T222P | Q9Y512 | protein_coding | tolerated(0.1) | possibly_damaging(0.676) | TCGA-EW-A1J2-01 | Breast | breast invasive carcinoma | Female | <65 | I/II | Chemotherapy | taxotere | SD |
| SAMM50 | insertion | Frame_Shift_Ins | novel | c.286_287insCAGTCATTCTCAGGCTCTGTTGTCAGCTCCTTTTCCC | p.Phe96SerfsTer14 | p.F96Sfs*14 | Q9Y512 | protein_coding | TCGA-AN-A041-01 | Breast | breast invasive carcinoma | Female | <65 | I/II | Unknown | Unknown | SD | ||
| SAMM50 | SNV | Missense_Mutation | novel | c.167N>A | p.Gly56Glu | p.G56E | Q9Y512 | protein_coding | tolerated(1) | benign(0.003) | TCGA-2W-A8YY-01 | Cervix | cervical & endocervical cancer | Female | <65 | I/II | Chemotherapy | cisplatin | CR |
| SAMM50 | SNV | Missense_Mutation | rs765107676 | c.716C>T | p.Ser239Leu | p.S239L | Q9Y512 | protein_coding | deleterious(0.01) | benign(0.211) | TCGA-EK-A2RK-01 | Cervix | cervical & endocervical cancer | Female | >=65 | I/II | Unknown | Unknown | SD |
| SAMM50 | SNV | Missense_Mutation | c.1344G>T | p.Met448Ile | p.M448I | Q9Y512 | protein_coding | tolerated(0.11) | benign(0.09) | TCGA-AA-3864-01 | Colorectum | colon adenocarcinoma | Male | >=65 | I/II | Unknown | Unknown | SD | |
| SAMM50 | SNV | Missense_Mutation | c.383N>C | p.Leu128Ser | p.L128S | Q9Y512 | protein_coding | deleterious(0) | benign(0.355) | TCGA-AA-A010-01 | Colorectum | colon adenocarcinoma | Female | <65 | I/II | Chemotherapy | folinic | CR | |
| SAMM50 | SNV | Missense_Mutation | novel | c.692N>A | p.Val231Glu | p.V231E | Q9Y512 | protein_coding | deleterious(0.02) | possibly_damaging(0.765) | TCGA-AA-A02R-01 | Colorectum | colon adenocarcinoma | Female | >=65 | I/II | Unknown | Unknown | PD |
| SAMM50 | SNV | Missense_Mutation | novel | c.158N>C | p.Asp53Ala | p.D53A | Q9Y512 | protein_coding | deleterious(0.01) | benign(0.039) | TCGA-A5-A1OF-01 | Endometrium | uterine corpus endometrioid carcinoma | Female | <65 | I/II | Unknown | Unknown | SD |
| SAMM50 | SNV | Missense_Mutation | novel | c.1055N>A | p.Ser352Asn | p.S352N | Q9Y512 | protein_coding | deleterious(0.01) | benign(0.037) | TCGA-A5-A2K3-01 | Endometrium | uterine corpus endometrioid carcinoma | Female | >=65 | I/II | Chemotherapy | carboplatin | SD |
| Page: 1 2 3 4 5 |
Top |
Related drugs of malignant transformation related genes |
| Identification of chemicals and drugs interact with genes involved in malignant transfromation |
| (DGIdb 4.0) |
| Entrez ID | Symbol | Category | Interaction Types | Drug Claim Name | Drug Name | PMIDs |
| Page: 1 |

Copyright 2023-Present -The University of Texas Health Science Center at Houston |