
|
|||||
|
 | |
| |
| |
| |
| |
| |
|
Gene: SAMD8 |
Gene summary for SAMD8 |
| Gene information | Species | Human | Gene symbol | SAMD8 | Gene ID | 142891 |
| Gene name | sterile alpha motif domain containing 8 | |
| Gene Alias | HEL-177 | |
| Cytomap | 10q22.2 | |
| Gene Type | protein-coding | GO ID | GO:0006629 | UniProtAcc | Q96LT4 |
Top |
Malignant transformation analysis |
| Identification of the aberrant gene expression in precancerous and cancerous lesions by comparing the gene expression of stem-like cells in diseased tissues with normal stem cells |
| Entrez ID | Symbol | Replicates | Species | Organ | Tissue | Adj P-value | Log2FC | Malignancy |
| 142891 | SAMD8 | CCI_1 | Human | Cervix | CC | 3.23e-04 | 5.87e-01 | 0.528 |
| 142891 | SAMD8 | CCI_2 | Human | Cervix | CC | 6.48e-04 | 6.17e-01 | 0.5249 |
| 142891 | SAMD8 | sample3 | Human | Cervix | CC | 6.98e-05 | 1.63e-01 | 0.1387 |
| 142891 | SAMD8 | LZE4T | Human | Esophagus | ESCC | 6.80e-06 | 1.84e-01 | 0.0811 |
| 142891 | SAMD8 | LZE8T | Human | Esophagus | ESCC | 3.67e-02 | 1.11e-01 | 0.067 |
| 142891 | SAMD8 | LZE20T | Human | Esophagus | ESCC | 3.77e-03 | 3.14e-02 | 0.0662 |
| 142891 | SAMD8 | LZE24T | Human | Esophagus | ESCC | 8.96e-10 | 1.39e-01 | 0.0596 |
| 142891 | SAMD8 | LZE21T | Human | Esophagus | ESCC | 2.59e-02 | 7.34e-02 | 0.0655 |
| 142891 | SAMD8 | P1T-E | Human | Esophagus | ESCC | 7.78e-05 | 2.66e-01 | 0.0875 |
| 142891 | SAMD8 | P2T-E | Human | Esophagus | ESCC | 6.37e-21 | 2.38e-01 | 0.1177 |
| 142891 | SAMD8 | P4T-E | Human | Esophagus | ESCC | 7.35e-18 | 4.87e-01 | 0.1323 |
| 142891 | SAMD8 | P5T-E | Human | Esophagus | ESCC | 7.13e-16 | 3.42e-01 | 0.1327 |
| 142891 | SAMD8 | P8T-E | Human | Esophagus | ESCC | 1.12e-23 | 1.72e-01 | 0.0889 |
| 142891 | SAMD8 | P9T-E | Human | Esophagus | ESCC | 3.25e-13 | 2.05e-01 | 0.1131 |
| 142891 | SAMD8 | P10T-E | Human | Esophagus | ESCC | 4.35e-14 | 5.40e-02 | 0.116 |
| 142891 | SAMD8 | P11T-E | Human | Esophagus | ESCC | 1.08e-07 | 2.69e-01 | 0.1426 |
| 142891 | SAMD8 | P12T-E | Human | Esophagus | ESCC | 3.69e-19 | 3.31e-01 | 0.1122 |
| 142891 | SAMD8 | P15T-E | Human | Esophagus | ESCC | 7.74e-17 | 3.66e-01 | 0.1149 |
| 142891 | SAMD8 | P16T-E | Human | Esophagus | ESCC | 2.34e-09 | 7.82e-02 | 0.1153 |
| 142891 | SAMD8 | P20T-E | Human | Esophagus | ESCC | 3.59e-15 | 2.68e-01 | 0.1124 |
| Page: 1 2 3 4 5 |
| Tissue | Expression Dynamics | Abbreviation |
| Cervix |  | CC: Cervix cancer |
| HSIL_HPV: HPV-infected high-grade squamous intraepithelial lesions | ||
| N_HPV: HPV-infected normal cervix | ||
| Esophagus |  | ESCC: Esophageal squamous cell carcinoma |
| HGIN: High-grade intraepithelial neoplasias | ||
| LGIN: Low-grade intraepithelial neoplasias | ||
| Liver | 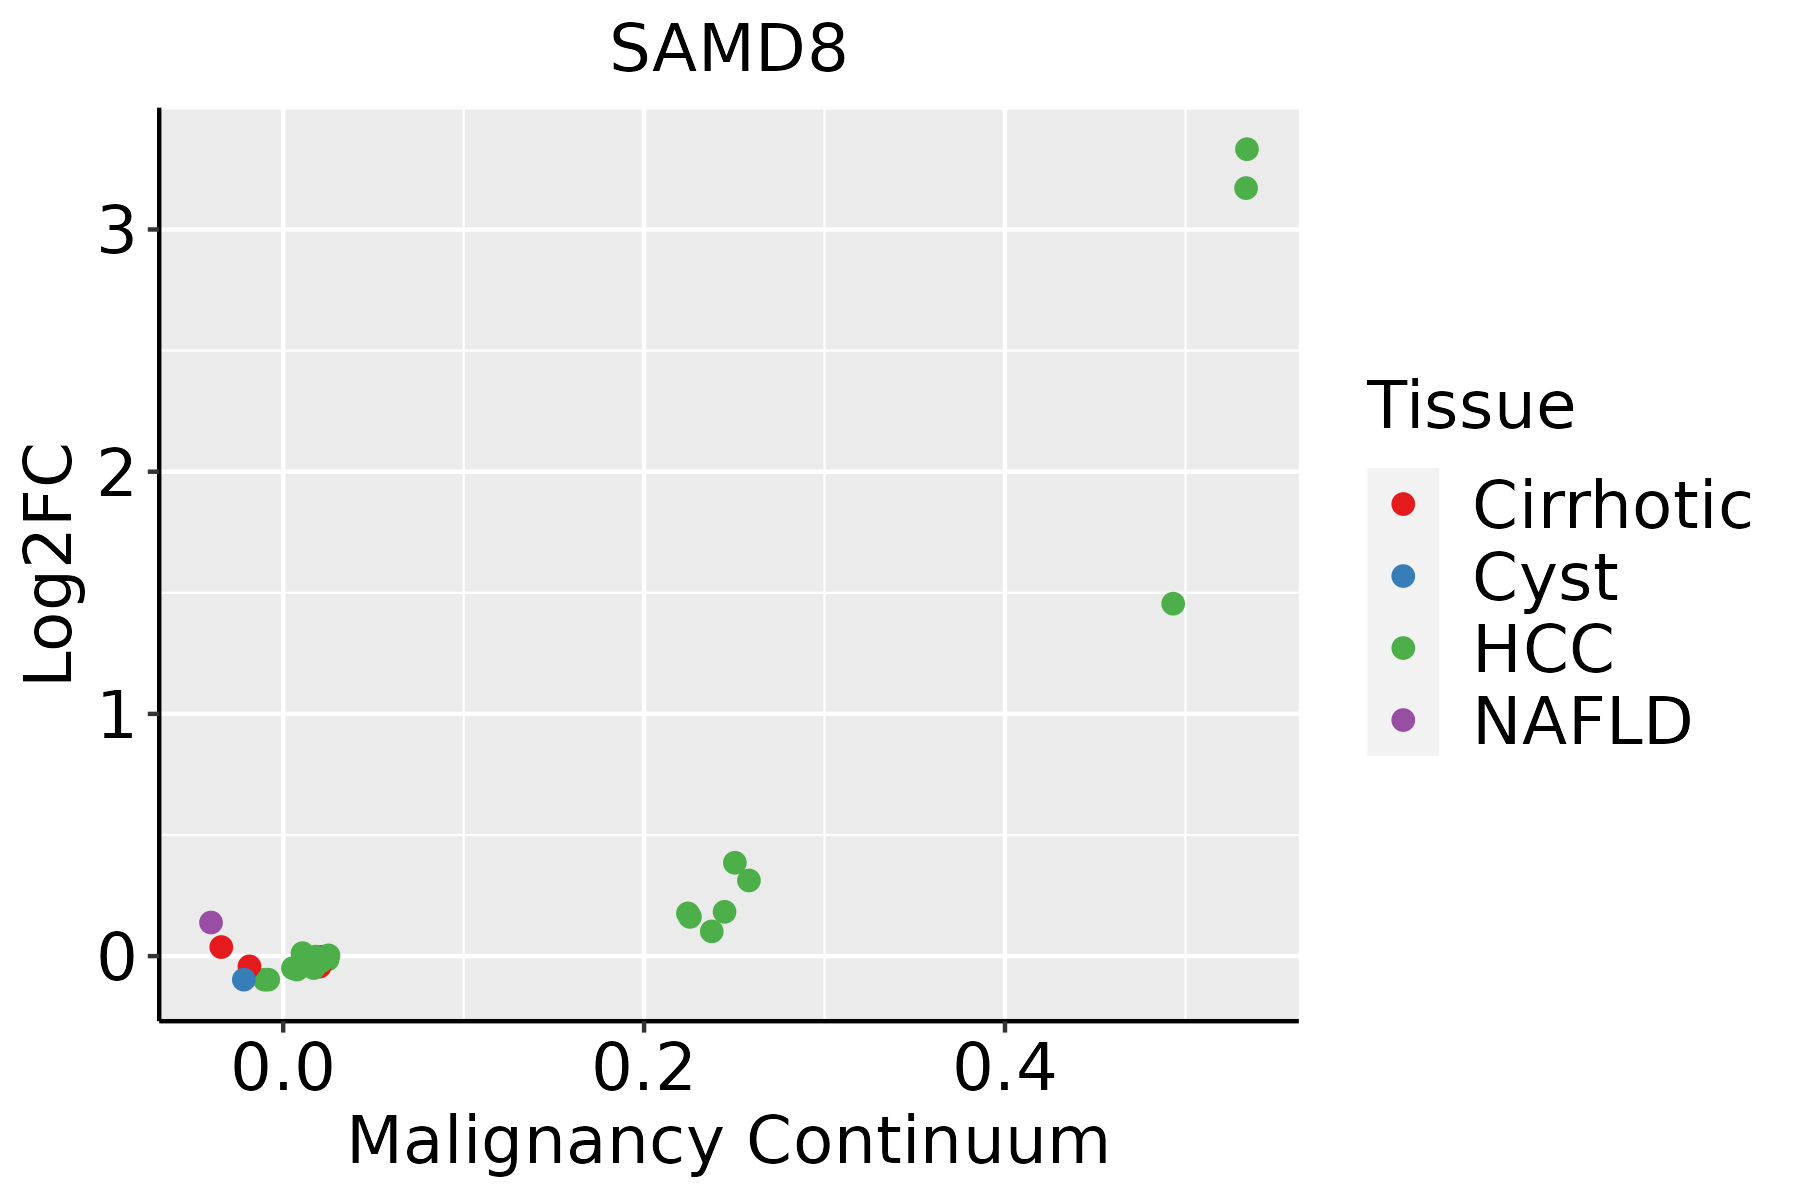 | HCC: Hepatocellular carcinoma |
| NAFLD: Non-alcoholic fatty liver disease | ||
| Oral Cavity | 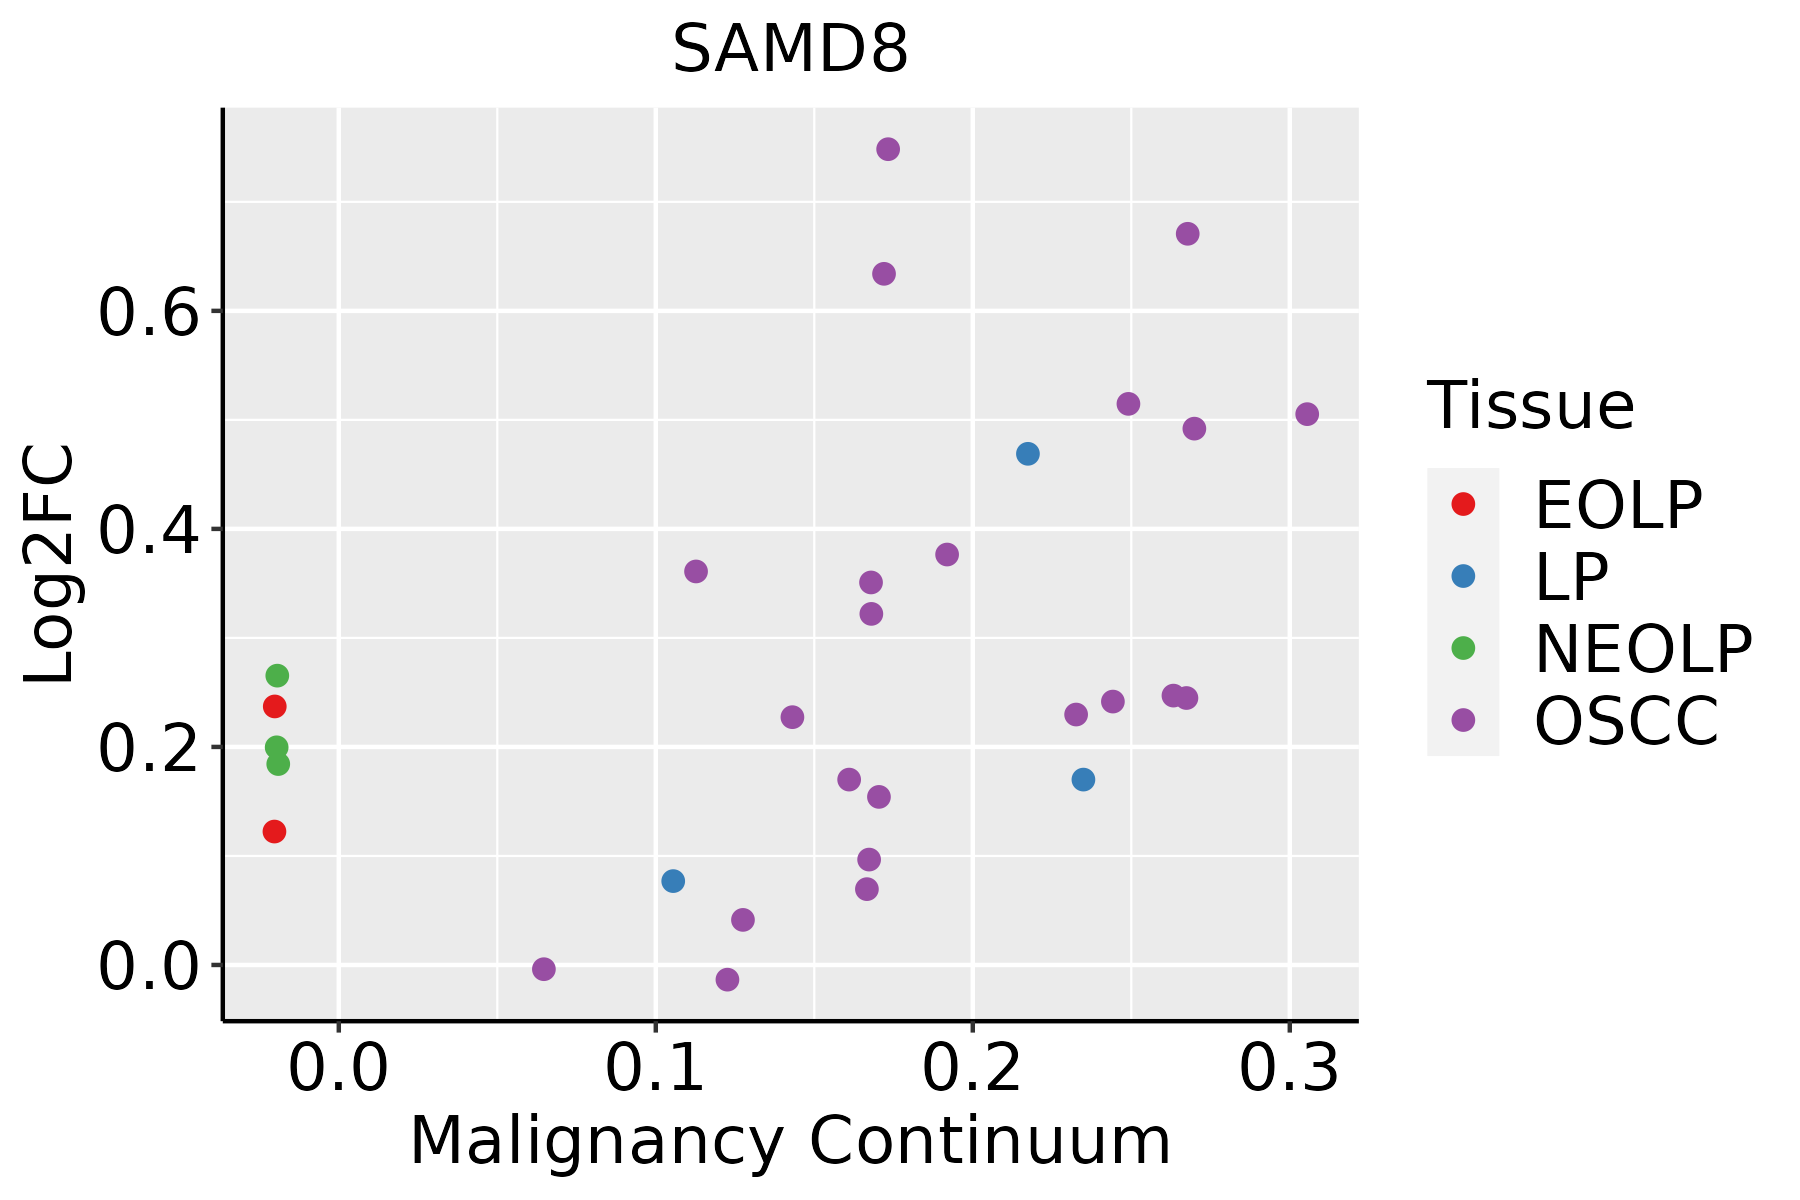 | EOLP: Erosive Oral lichen planus |
| LP: leukoplakia | ||
| NEOLP: Non-erosive oral lichen planus | ||
| OSCC: Oral squamous cell carcinoma |
| ∗log2FC in expression of this searched gene in stem-like cells from each diseased tissue sample relative to stem-like cells in normal samples in each tissue plotted against the malignancy continuum. Samples are colored based on if they are from different disease stage. |
Top |
Malignant transformation related pathway analysis |
| Find out the enriched GO biological processes and KEGG pathways involved in transition from healthy to precancer to cancer |
| Tissue | Disease Stage | Enriched GO biological Processes |
| Colorectum | AD |  |
| Colorectum | SER |  |
| Colorectum | MSS |  |
| Colorectum | MSI-H |  |
| Colorectum | FAP |  |
| ∗Top 15 enriched GO BP terms are showed in the bar plot of each disease state in each tissue. Each row represents a significant GO biological process which is colored according to the -log10(p.adjust). |
| Page: 1 2 3 4 5 6 7 8 9 |
| GO ID | Tissue | Disease Stage | Description | Gene Ratio | Bg Ratio | pvalue | p.adjust | Count |
| GO:00086544 | Esophagus | ESCC | phospholipid biosynthetic process | 162/8552 | 253/18723 | 2.59e-09 | 5.73e-08 | 162 |
| GO:00066433 | Esophagus | ESCC | membrane lipid metabolic process | 130/8552 | 203/18723 | 9.29e-08 | 1.54e-06 | 130 |
| GO:00066446 | Esophagus | ESCC | phospholipid metabolic process | 218/8552 | 383/18723 | 5.37e-06 | 5.59e-05 | 218 |
| GO:00464673 | Esophagus | ESCC | membrane lipid biosynthetic process | 91/8552 | 142/18723 | 7.19e-06 | 7.19e-05 | 91 |
| GO:00066652 | Esophagus | ESCC | sphingolipid metabolic process | 96/8552 | 155/18723 | 3.21e-05 | 2.66e-04 | 96 |
| GO:00301481 | Esophagus | ESCC | sphingolipid biosynthetic process | 62/8552 | 103/18723 | 2.10e-03 | 9.38e-03 | 62 |
| GO:00066721 | Esophagus | ESCC | ceramide metabolic process | 61/8552 | 102/18723 | 2.82e-03 | 1.19e-02 | 61 |
| GO:0046513 | Esophagus | ESCC | ceramide biosynthetic process | 40/8552 | 65/18723 | 7.25e-03 | 2.63e-02 | 40 |
| GO:00192168 | Esophagus | ESCC | regulation of lipid metabolic process | 172/8552 | 331/18723 | 1.20e-02 | 4.02e-02 | 172 |
| GO:00086542 | Liver | HCC | phospholipid biosynthetic process | 150/7958 | 253/18723 | 4.77e-08 | 1.03e-06 | 150 |
| GO:00066444 | Liver | HCC | phospholipid metabolic process | 214/7958 | 383/18723 | 7.25e-08 | 1.48e-06 | 214 |
| GO:00192162 | Liver | HCC | regulation of lipid metabolic process | 181/7958 | 331/18723 | 4.58e-06 | 5.79e-05 | 181 |
| GO:00066431 | Liver | HCC | membrane lipid metabolic process | 115/7958 | 203/18723 | 3.17e-05 | 3.22e-04 | 115 |
| GO:00468902 | Liver | HCC | regulation of lipid biosynthetic process | 96/7958 | 171/18723 | 2.14e-04 | 1.63e-03 | 96 |
| GO:0006665 | Liver | HCC | sphingolipid metabolic process | 85/7958 | 155/18723 | 1.27e-03 | 6.92e-03 | 85 |
| GO:0046467 | Liver | HCC | membrane lipid biosynthetic process | 78/7958 | 142/18723 | 1.85e-03 | 9.46e-03 | 78 |
| GO:00066432 | Oral cavity | OSCC | membrane lipid metabolic process | 111/7305 | 203/18723 | 4.02e-06 | 4.69e-05 | 111 |
| GO:00086543 | Oral cavity | OSCC | phospholipid biosynthetic process | 130/7305 | 253/18723 | 3.96e-05 | 3.46e-04 | 130 |
| GO:00066651 | Oral cavity | OSCC | sphingolipid metabolic process | 84/7305 | 155/18723 | 8.64e-05 | 6.61e-04 | 84 |
| GO:00464672 | Oral cavity | OSCC | membrane lipid biosynthetic process | 77/7305 | 142/18723 | 1.63e-04 | 1.13e-03 | 77 |
| Page: 1 2 |
| Pathway ID | Tissue | Disease Stage | Description | Gene Ratio | Bg Ratio | pvalue | p.adjust | qvalue | Count |
| Page: 1 |
Top |
Cell-cell communication analysis |
| Identification of potential cell-cell interactions between two cell types and their ligand-receptor pairs for different disease states |
| Ligand | Receptor | LRpair | Pathway | Tissue | Disease Stage |
| Page: 1 |
Top |
Single-cell gene regulatory network inference analysis |
| Find out the significant the regulons (TFs) and the target genes of each regulon across cell types for different disease states |
| TF | Cell Type | Tissue | Disease Stage | Target Gene | RSS | Regulon Activity |
| ∗The dot plots of a searched regulon are shown for all cell subpopulations in each disease state of each tissue based on the regulon specific score inferred using pySCENIC and by calculating the average expression. |
| Page: 1 |
Top |
Somatic mutation of malignant transformation related genes |
| Annotation of somatic variants for genes involved in malignant transformation |
| Hugo Symbol | Variant Class | Variant Classification | dbSNP RS | HGVSc | HGVSp | HGVSp Short | SWISSPROT | BIOTYPE | SIFT | PolyPhen | Tumor Sample Barcode | Tissue | Histology | Sex | Age | Stage | Therapy Types | Drugs | Outcome |
| SAMD8 | SNV | Missense_Mutation | c.683N>G | p.Leu228Arg | p.L228R | Q96LT4 | protein_coding | deleterious(0) | probably_damaging(0.959) | TCGA-A8-A08F-01 | Breast | breast invasive carcinoma | Female | <65 | III/IV | Chemotherapy | 5-fluorouracil | CR | |
| SAMD8 | SNV | Missense_Mutation | novel | c.664N>G | p.His222Asp | p.H222D | Q96LT4 | protein_coding | deleterious(0) | probably_damaging(0.993) | TCGA-OL-A5RW-01 | Breast | breast invasive carcinoma | Female | <65 | I/II | Chemotherapy | adriamycin | CR |
| SAMD8 | SNV | Missense_Mutation | rs763665486 | c.689G>A | p.Arg230Gln | p.R230Q | Q96LT4 | protein_coding | deleterious(0) | probably_damaging(0.999) | TCGA-2W-A8YY-01 | Cervix | cervical & endocervical cancer | Female | <65 | I/II | Chemotherapy | cisplatin | CR |
| SAMD8 | SNV | Missense_Mutation | c.587G>C | p.Arg196Thr | p.R196T | Q96LT4 | protein_coding | tolerated(0.37) | possibly_damaging(0.601) | TCGA-DG-A2KK-01 | Cervix | cervical & endocervical cancer | Female | <65 | III/IV | Chemotherapy | cisplatin | SD | |
| SAMD8 | SNV | Missense_Mutation | novel | c.1130G>C | p.Arg377Thr | p.R377T | Q96LT4 | protein_coding | deleterious(0) | probably_damaging(0.995) | TCGA-DG-A2KM-01 | Cervix | cervical & endocervical cancer | Female | <65 | I/II | Chemotherapy | cisplatin | SD |
| SAMD8 | SNV | Missense_Mutation | c.728N>T | p.Arg243Leu | p.R243L | Q96LT4 | protein_coding | deleterious(0) | probably_damaging(0.999) | TCGA-EK-A2RA-01 | Cervix | cervical & endocervical cancer | Female | >=65 | I/II | Unknown | Unknown | SD | |
| SAMD8 | SNV | Missense_Mutation | rs773128897 | c.361N>A | p.Gly121Arg | p.G121R | Q96LT4 | protein_coding | tolerated(0.31) | benign(0.05) | TCGA-A6-2672-01 | Colorectum | colon adenocarcinoma | Female | >=65 | III/IV | Unknown | Unknown | SD |
| SAMD8 | SNV | Missense_Mutation | c.455N>T | p.Thr152Ile | p.T152I | Q96LT4 | protein_coding | tolerated(0.08) | possibly_damaging(0.854) | TCGA-AD-6890-01 | Colorectum | colon adenocarcinoma | Male | >=65 | I/II | Unknown | Unknown | SD | |
| SAMD8 | SNV | Missense_Mutation | rs763665486 | c.689N>A | p.Arg230Gln | p.R230Q | Q96LT4 | protein_coding | deleterious(0) | probably_damaging(0.999) | TCGA-D5-7000-01 | Colorectum | colon adenocarcinoma | Female | >=65 | I/II | Unknown | Unknown | SD |
| SAMD8 | SNV | Missense_Mutation | c.800N>A | p.Gly267Asp | p.G267D | Q96LT4 | protein_coding | tolerated(0.18) | benign(0.015) | TCGA-A5-A0G2-01 | Endometrium | uterine corpus endometrioid carcinoma | Female | <65 | III/IV | Unknown | Unknown | SD |
| Page: 1 2 3 4 |
Top |
Related drugs of malignant transformation related genes |
| Identification of chemicals and drugs interact with genes involved in malignant transfromation |
| (DGIdb 4.0) |
| Entrez ID | Symbol | Category | Interaction Types | Drug Claim Name | Drug Name | PMIDs |
| Page: 1 |

Copyright 2023-Present -The University of Texas Health Science Center at Houston |