Schematic overview of the cellular and molecular mechanisms involved in the cancer progression, including the proposed cellular and molecular mechanisms in cancer cells trajectory. AT1: alveolar type 1 cells; AT2: alveolar type 2 cells; AAH: atypical adenomatous hyperplasia; AIS: adenocarcinoma in situ; MIA: minimally invasive adenocarcinoma; IA: invasive adenocarcinoma; EMT: epithelial-mesenchymal transition

Home

Download

Statistics

Help

Contact

Center for Computational Systems Medicine
leaf

Gene summary

leaf

Malignant transformation analysis

leaf

Malignant transformation related pathway analysis

leaf

Cell-cell communication analysis

leaf

Single-cell gene regulatory network inference analysis

leaf

Somatic mutation of malignant transformation related genes

leaf

Related drugs of malignant transformation related genes

Gene: SAFB

Gene summary for SAFB

check button Gene summary.

Gene informationSpeciesHuman
Gene symbol

SAFB

Gene ID

6294

Gene namescaffold attachment factor B
Gene AliasHAP
Cytomap19p13.3
Gene Typeprotein-coding
GO ID

GO:0006139

UniProtAcc

Q15424


Top

Malignant transformation analysis

check button Identification of the aberrant gene expression in precancerous and cancerous lesions by comparing the gene expression of stem-like cells in diseased tissues with normal stem cells
check button Malignant transformation involving gene list.
Entrez IDSymbolReplicatesSpeciesOrganTissueAdj P-valueLog2FCMalignancy
6294SAFBHTA11_866_3004761011HumanColorectumAD6.70e-064.00e-010.096
6294SAFBHTA11_7696_3000711011HumanColorectumAD5.62e-054.60e-010.0674
6294SAFBHTA11_99999965104_69814HumanColorectumMSS2.56e-023.85e-010.281
6294SAFBHTA11_99999971662_82457HumanColorectumMSS1.14e-045.07e-010.3859
6294SAFBA015-C-203HumanColorectumFAP3.40e-18-1.63e-01-0.1294
6294SAFBA002-C-201HumanColorectumFAP6.84e-04-1.17e-010.0324
6294SAFBA001-C-119HumanColorectumFAP4.71e-033.69e-02-0.1557
6294SAFBA001-C-108HumanColorectumFAP3.31e-09-9.64e-02-0.0272
6294SAFBA002-C-205HumanColorectumFAP2.65e-10-1.68e-01-0.1236
6294SAFBA015-C-006HumanColorectumFAP1.62e-06-1.72e-01-0.0994
6294SAFBA015-C-106HumanColorectumFAP6.29e-04-7.40e-02-0.0511
6294SAFBA002-C-114HumanColorectumFAP6.37e-09-7.88e-02-0.1561
6294SAFBA015-C-104HumanColorectumFAP2.09e-20-9.30e-02-0.1899
6294SAFBA001-C-014HumanColorectumFAP3.30e-05-1.15e-010.0135
6294SAFBA002-C-016HumanColorectumFAP4.35e-13-2.50e-010.0521
6294SAFBA015-C-002HumanColorectumFAP2.49e-04-2.00e-01-0.0763
6294SAFBA001-C-203HumanColorectumFAP2.13e-04-7.60e-02-0.0481
6294SAFBA002-C-116HumanColorectumFAP2.19e-17-1.48e-01-0.0452
6294SAFBA014-C-008HumanColorectumFAP1.73e-068.48e-03-0.191
6294SAFBA018-E-020HumanColorectumFAP1.30e-08-1.43e-01-0.2034
Page: 1 2 3 4 5 6 7 8 

check button Transcriptomic changes along malignancy continuum.
TissueExpression DynamicsAbbreviation
Colorectum (GSE201348)The image shows the transcriptomic changes along malignancy continuum.log2FC in expression of this searched gene in stem-like cells from each diseased tissue sample relative to stem-like cells in normal samples in each tissue plotted against the malignancy continuum. Samples are colored based on if they are from different disease stage.FAP: Familial adenomatous polyposis
CRC: Colorectal cancer
Colorectum (HTA11)The image shows the transcriptomic changes along malignancy continuum.log2FC in expression of this searched gene in stem-like cells from each diseased tissue sample relative to stem-like cells in normal samples in each tissue plotted against the malignancy continuum. Samples are colored based on if they are from different disease stage.AD: Adenomas
SER: Sessile serrated lesions
MSI-H: Microsatellite-high colorectal cancer
MSS: Microsatellite stable colorectal cancer
EsophagusThe image shows the transcriptomic changes along malignancy continuum.log2FC in expression of this searched gene in stem-like cells from each diseased tissue sample relative to stem-like cells in normal samples in each tissue plotted against the malignancy continuum. Samples are colored based on if they are from different disease stage.
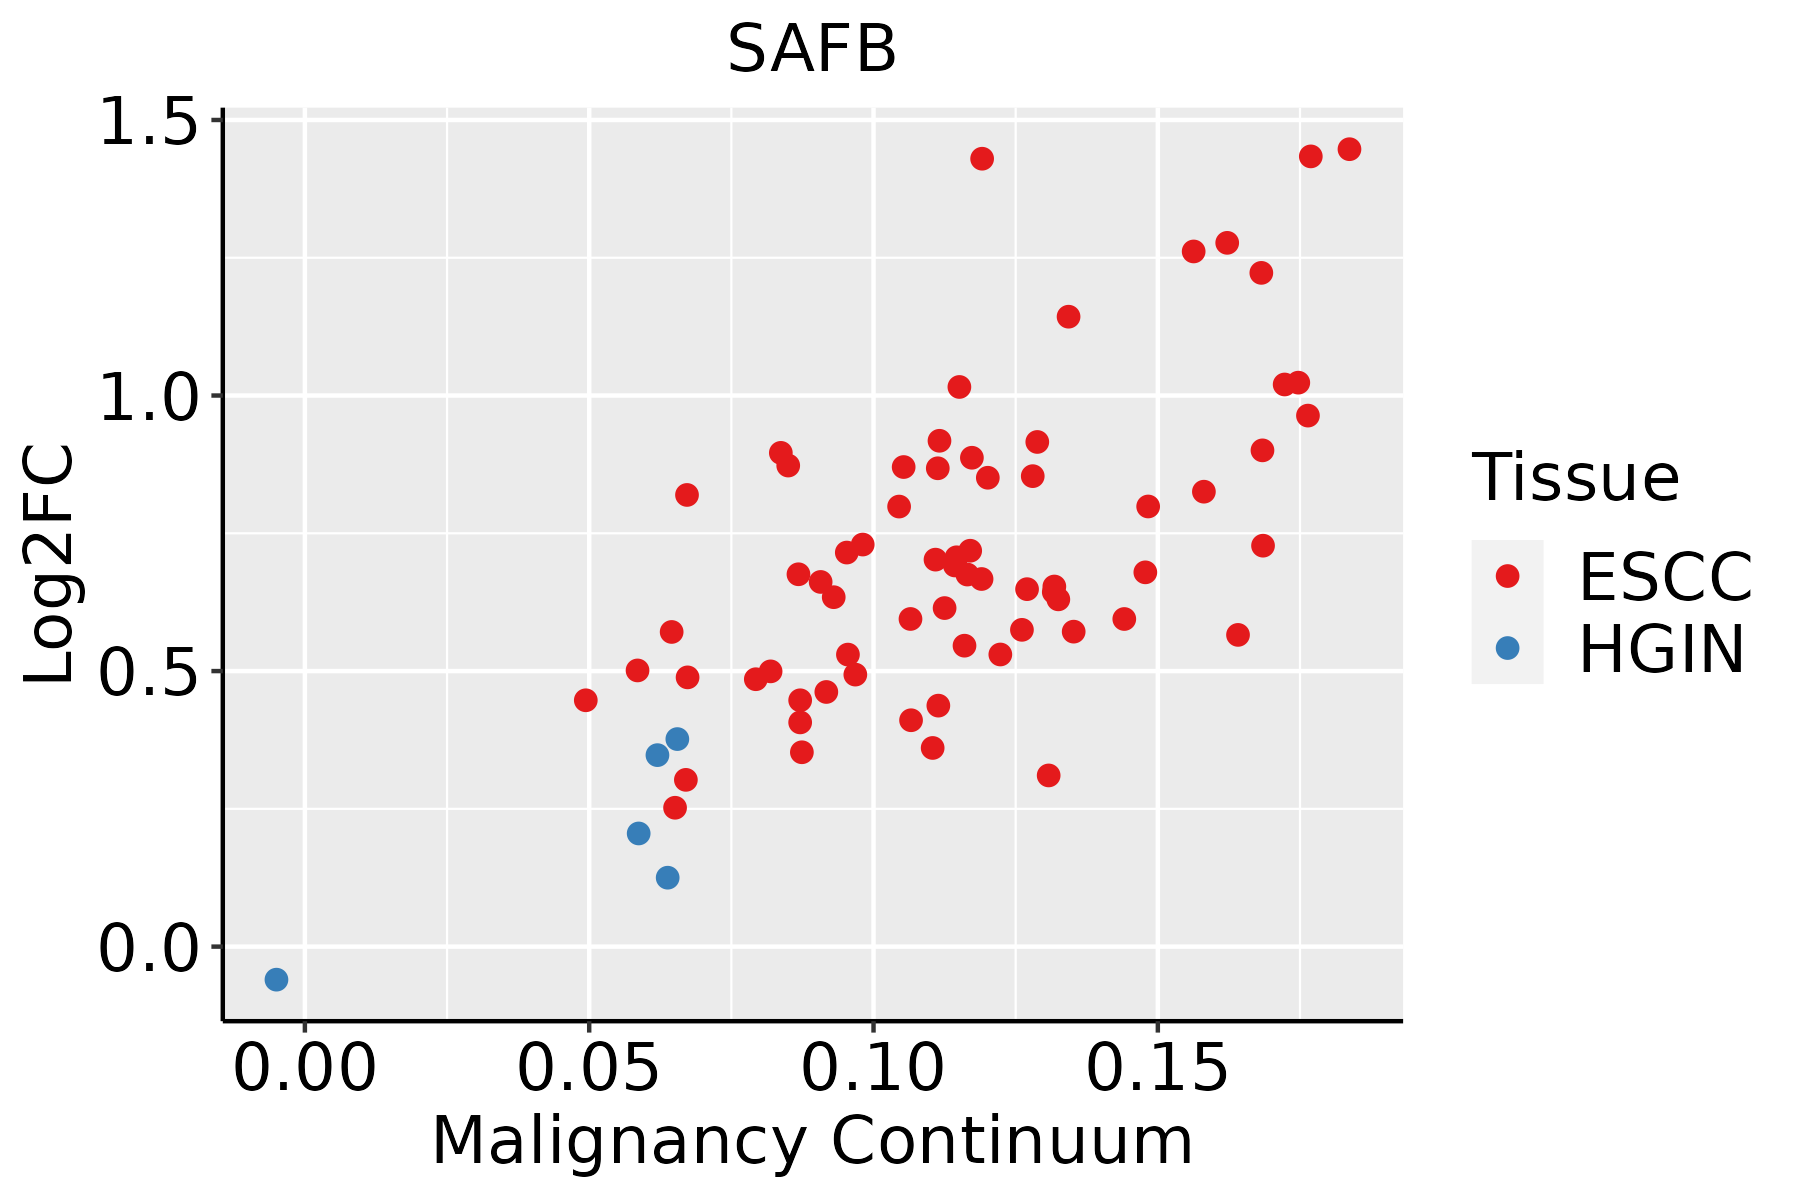
ESCC: Esophageal squamous cell carcinoma
HGIN: High-grade intraepithelial neoplasias
LGIN: Low-grade intraepithelial neoplasias
LiverThe image shows the transcriptomic changes along malignancy continuum.log2FC in expression of this searched gene in stem-like cells from each diseased tissue sample relative to stem-like cells in normal samples in each tissue plotted against the malignancy continuum. Samples are colored based on if they are from different disease stage.
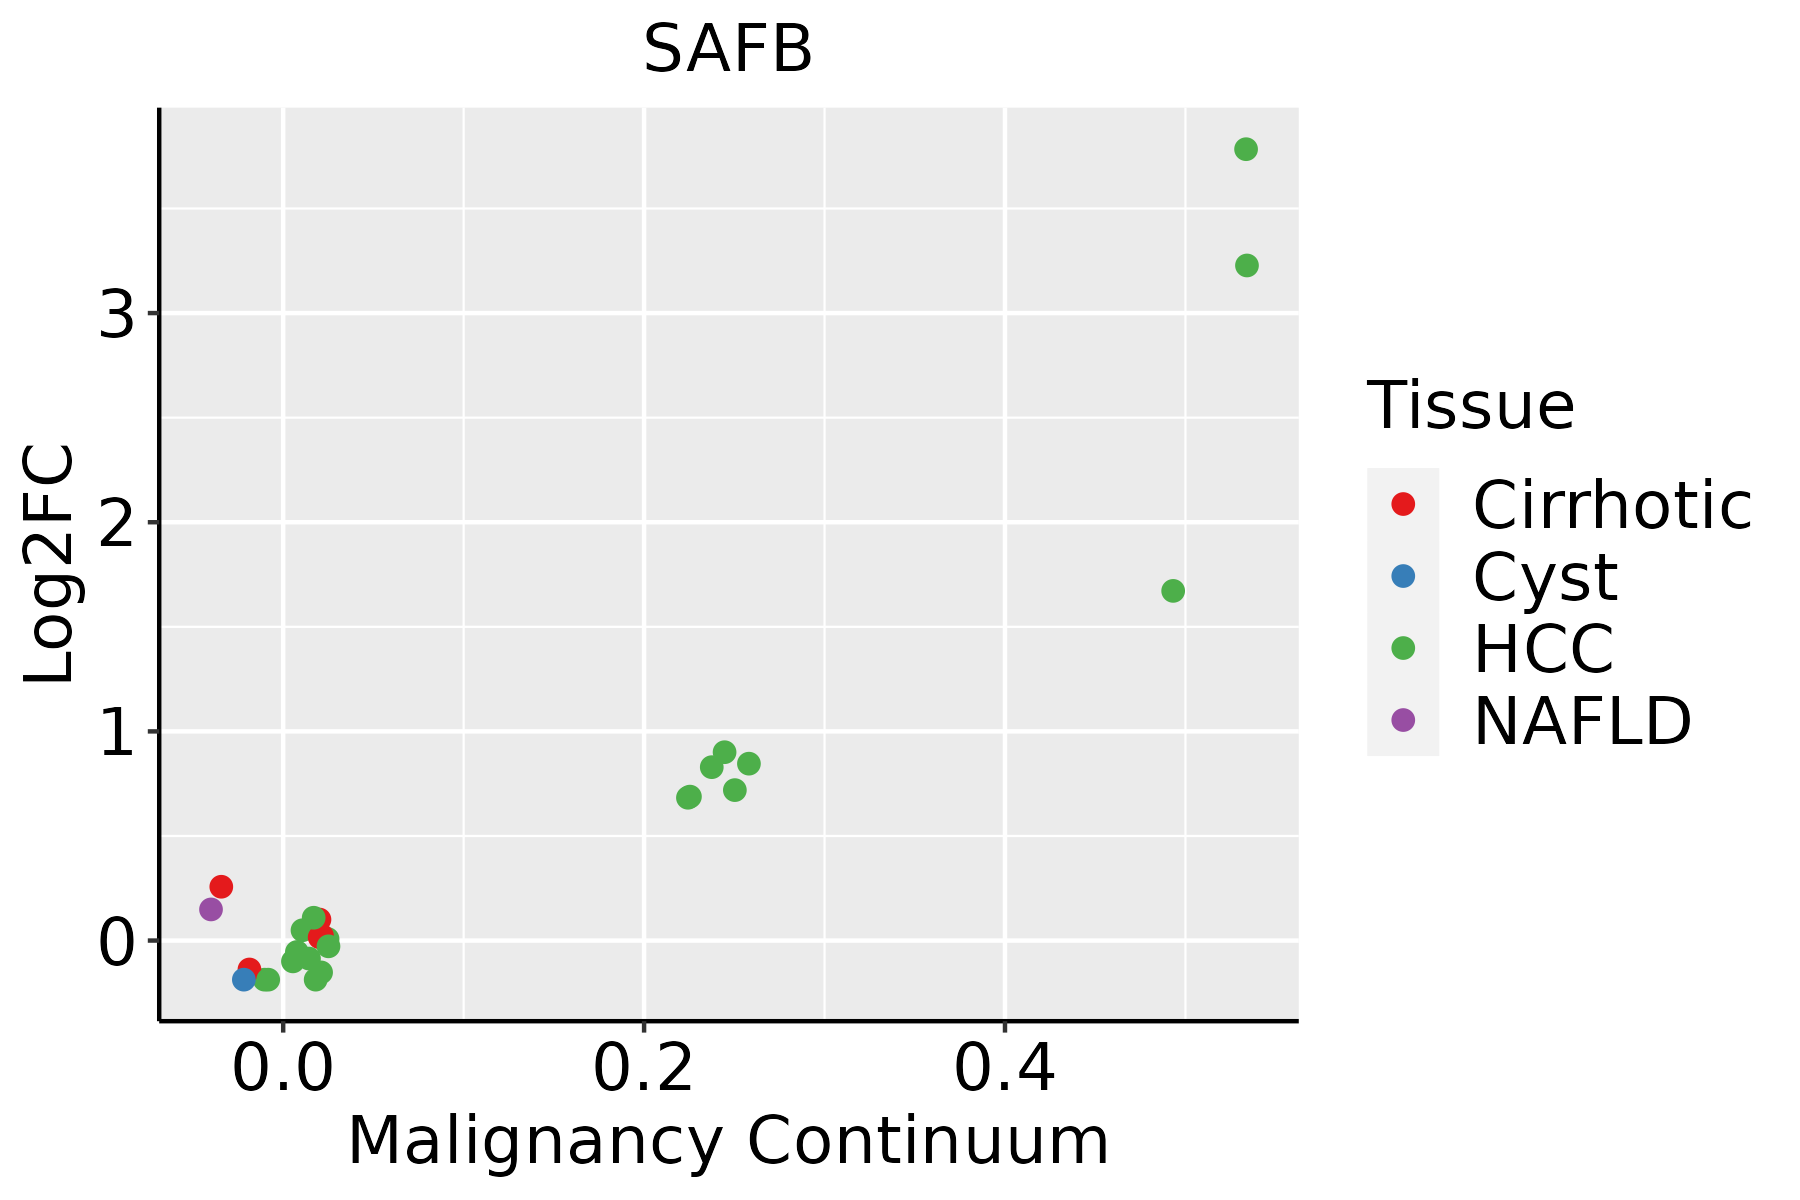
HCC: Hepatocellular carcinoma
NAFLD: Non-alcoholic fatty liver disease
Oral CavityThe image shows the transcriptomic changes along malignancy continuum.log2FC in expression of this searched gene in stem-like cells from each diseased tissue sample relative to stem-like cells in normal samples in each tissue plotted against the malignancy continuum. Samples are colored based on if they are from different disease stage.
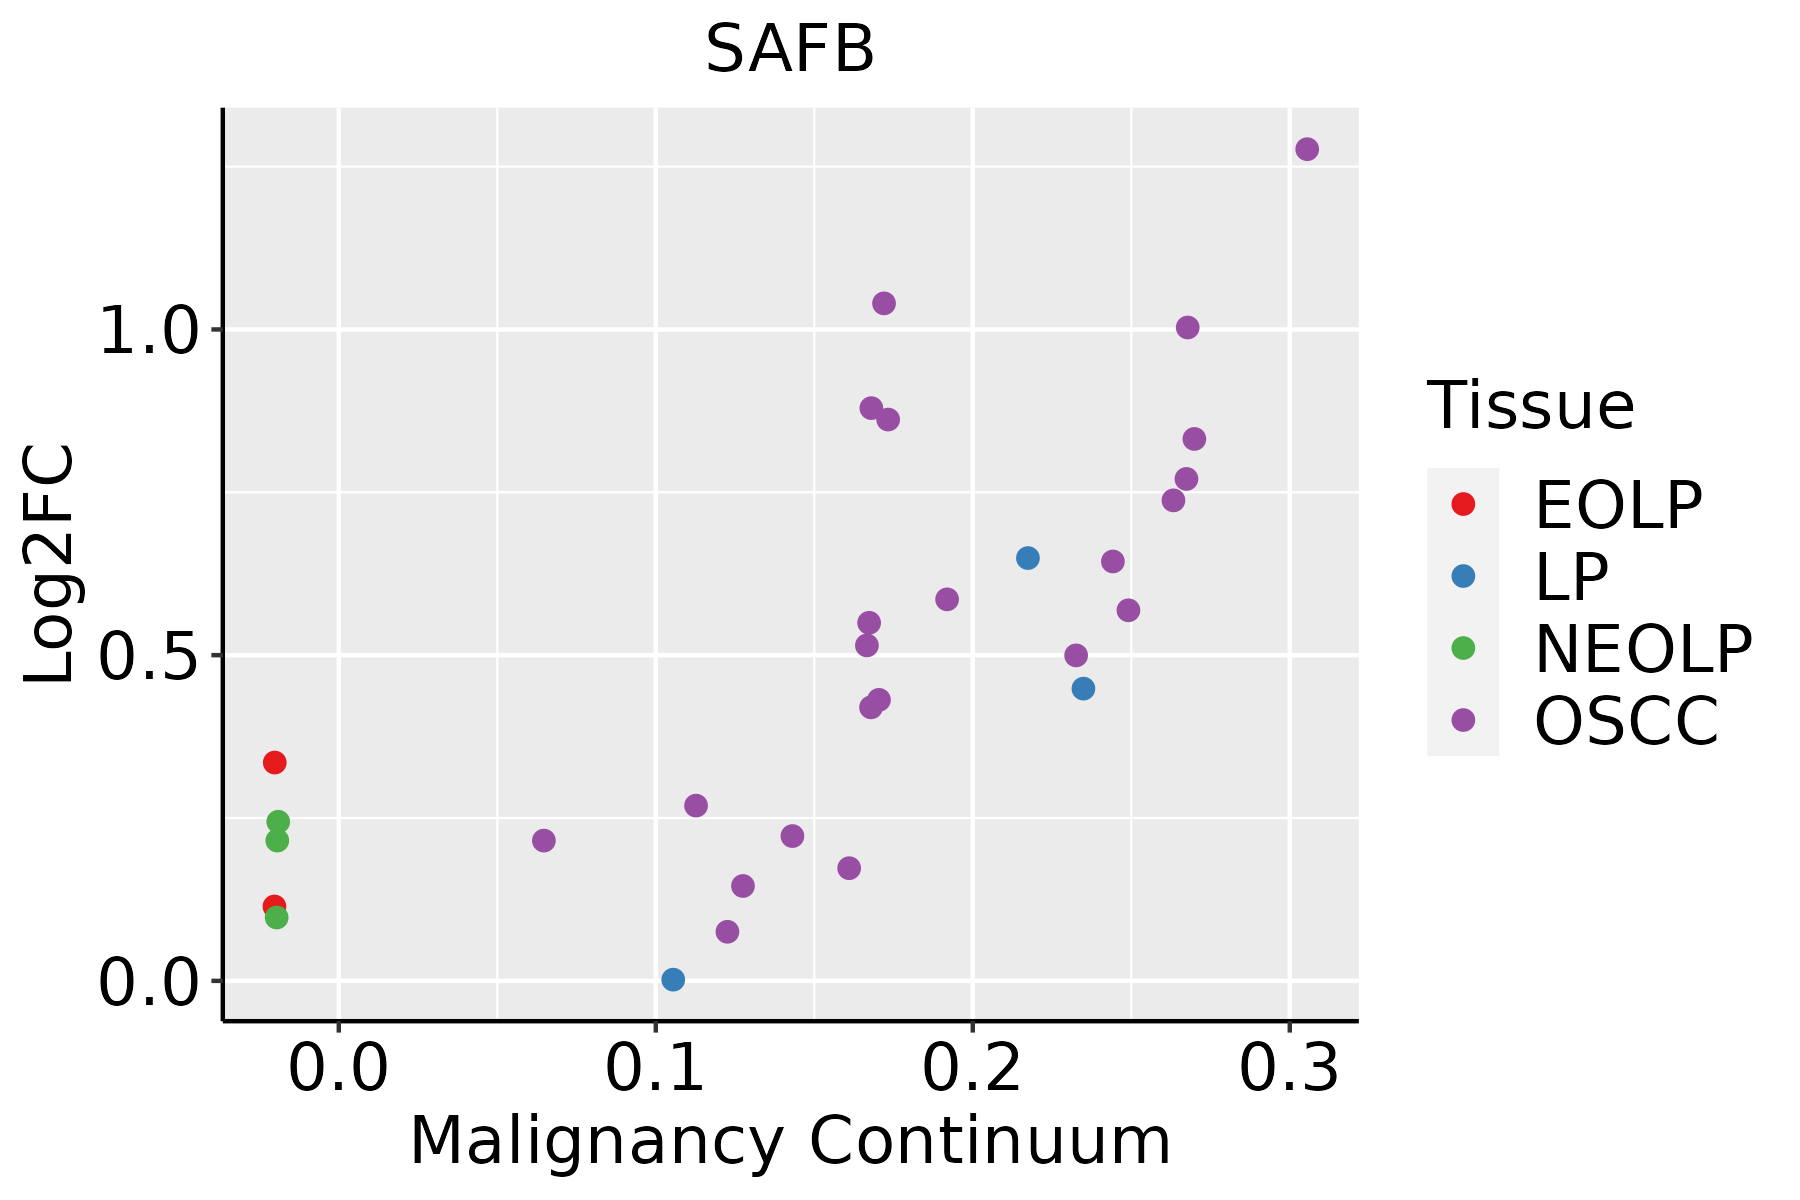
EOLP: Erosive Oral lichen planus
LP: leukoplakia
NEOLP: Non-erosive oral lichen planus
OSCC: Oral squamous cell carcinoma
SkinThe image shows the transcriptomic changes along malignancy continuum.log2FC in expression of this searched gene in stem-like cells from each diseased tissue sample relative to stem-like cells in normal samples in each tissue plotted against the malignancy continuum. Samples are colored based on if they are from different disease stage.AK: Actinic keratosis
cSCC: Cutaneous squamous cell carcinoma
SCCIS:squamous cell carcinoma in situ
ThyroidThe image shows the transcriptomic changes along malignancy continuum.log2FC in expression of this searched gene in stem-like cells from each diseased tissue sample relative to stem-like cells in normal samples in each tissue plotted against the malignancy continuum. Samples are colored based on if they are from different disease stage.
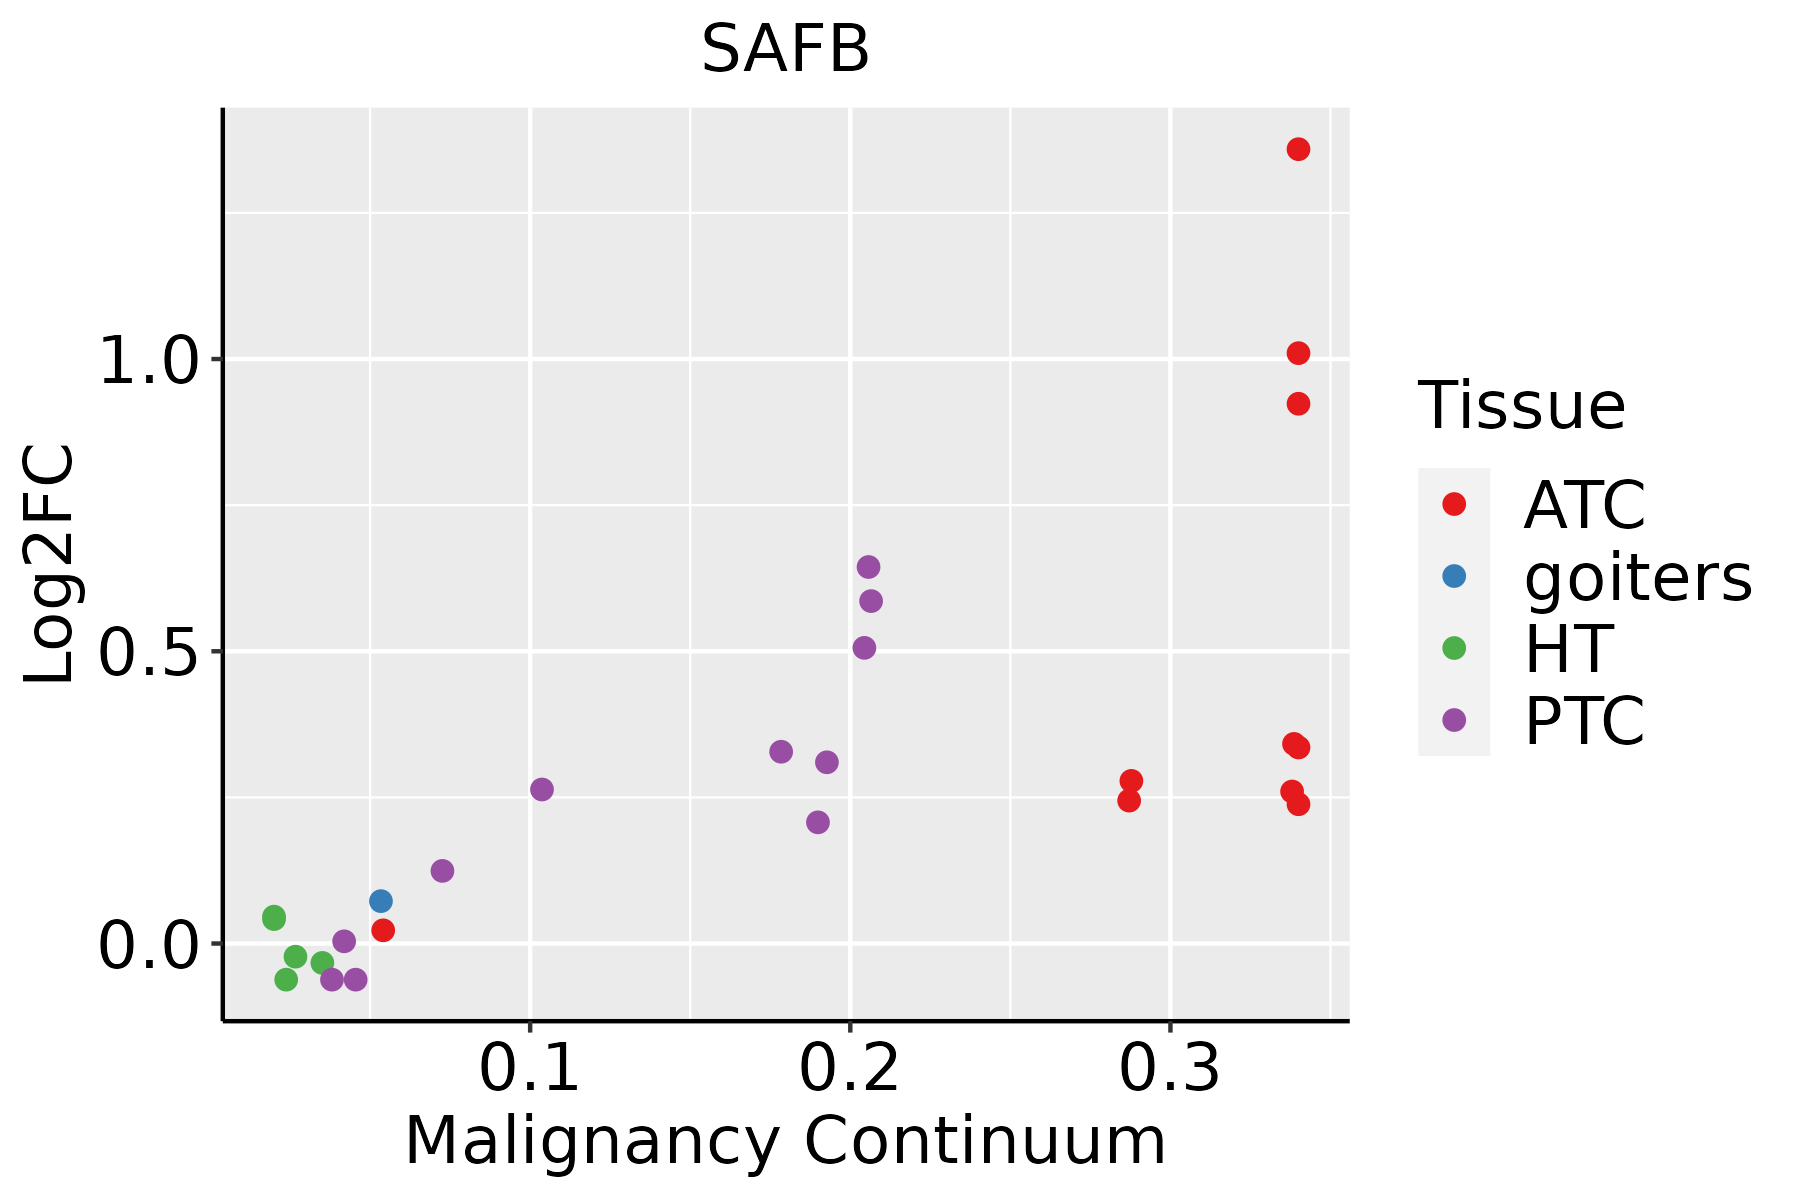
ATC: Anaplastic thyroid cancer
HT: Hashimoto's thyroiditis
PTC: Papillary thyroid cancer
∗log2FC in expression of this searched gene in stem-like cells from each diseased tissue sample relative to stem-like cells in normal samples in each tissue plotted against the malignancy continuum. Samples are colored based on if they are from different disease stage.

Top

Malignant transformation related pathway analysis

check buttonFind out the enriched GO biological processes and KEGG pathways involved in transition from healthy to precancer to cancer
check button Figure of enriched GO biological processes.
TissueDisease StageEnriched GO biological Processes
ColorectumADGO analysis - Figure of enriched GO biological processes: Top 15 enriched GO BP terms are showed in the bar plot of each disease state in each tissue. Each row represents a significant GO biological process which is colored according to the -log10(p.adjust).
ColorectumSERGO analysis - Figure of enriched GO biological processes: Top 15 enriched GO BP terms are showed in the bar plot of each disease state in each tissue. Each row represents a significant GO biological process which is colored according to the -log10(p.adjust).
ColorectumMSSGO analysis - Figure of enriched GO biological processes: Top 15 enriched GO BP terms are showed in the bar plot of each disease state in each tissue. Each row represents a significant GO biological process which is colored according to the -log10(p.adjust).
ColorectumMSI-HGO analysis - Figure of enriched GO biological processes: Top 15 enriched GO BP terms are showed in the bar plot of each disease state in each tissue. Each row represents a significant GO biological process which is colored according to the -log10(p.adjust).
ColorectumFAPGO analysis - Figure of enriched GO biological processes: Top 15 enriched GO BP terms are showed in the bar plot of each disease state in each tissue. Each row represents a significant GO biological process which is colored according to the -log10(p.adjust).
∗Top 15 enriched GO BP terms are showed in the bar plot of each disease state in each tissue. Each row represents a significant GO biological process which is colored according to the -log10(p.adjust).
Page: 1 2 3 4 5 6 7 8 9 

check button Enriched GO biological processes.
GO IDTissueDisease StageDescriptionGene RatioBg Ratiopvaluep.adjustCount
GO:1903311ColorectumADregulation of mRNA metabolic process117/3918288/187231.69e-144.23e-12117
GO:0050684ColorectumADregulation of mRNA processing61/3918137/187234.23e-103.58e-0861
GO:0071383ColorectumADcellular response to steroid hormone stimulus73/3918204/187236.31e-072.24e-0573
GO:0030522ColorectumADintracellular receptor signaling pathway87/3918265/187233.69e-061.03e-0487
GO:0043401ColorectumADsteroid hormone mediated signaling pathway51/3918136/187236.52e-061.63e-0451
GO:0048545ColorectumADresponse to steroid hormone104/3918339/187231.33e-052.90e-04104
GO:0009755ColorectumADhormone-mediated signaling pathway64/3918190/187232.78e-055.24e-0464
GO:0030518ColorectumADintracellular steroid hormone receptor signaling pathway43/3918116/187234.61e-057.97e-0443
GO:0006325ColorectumADchromatin organization119/3918409/187234.85e-058.33e-04119
GO:19033112ColorectumMSSregulation of mRNA metabolic process115/3467288/187231.23e-176.41e-15115
GO:00506842ColorectumMSSregulation of mRNA processing57/3467137/187232.88e-102.68e-0857
GO:00713832ColorectumMSScellular response to steroid hormone stimulus72/3467204/187238.87e-095.43e-0772
GO:00434012ColorectumMSSsteroid hormone mediated signaling pathway51/3467136/187231.43e-076.67e-0651
GO:00305222ColorectumMSSintracellular receptor signaling pathway84/3467265/187231.47e-076.79e-0684
GO:00485452ColorectumMSSresponse to steroid hormone101/3467339/187232.60e-071.10e-05101
GO:00305182ColorectumMSSintracellular steroid hormone receptor signaling pathway44/3467116/187236.95e-072.49e-0544
GO:00097552ColorectumMSShormone-mediated signaling pathway63/3467190/187239.26e-073.23e-0563
GO:00063252ColorectumMSSchromatin organization107/3467409/187237.22e-051.21e-03107
GO:0030520ColorectumMSSintracellular estrogen receptor signaling pathway21/346754/187233.68e-044.66e-0321
GO:19033114ColorectumFAPregulation of mRNA metabolic process97/2622288/187231.35e-174.13e-1497
Page: 1 2 3 4 5 6 7 8 9 10 11 12 

check button Enriched KEGG pathways.
Pathway IDTissueDisease StageDescriptionGene RatioBg Ratiopvaluep.adjustqvalueCount
Page: 1 

Top

Cell-cell communication analysis

check buttonIdentification of potential cell-cell interactions between two cell types and their ligand-receptor pairs for different disease states
LigandReceptorLRpairPathwayTissueDisease Stage
Page: 1 

Top

Single-cell gene regulatory network inference analysis

check buttonFind out the significant the regulons (TFs) and the target genes of each regulon across cell types for different disease states
TFCell TypeTissueDisease StageTarget GeneRSSRegulon Activity
∗The dot plots of a searched regulon are shown for all cell subpopulations in each disease state of each tissue based on the regulon specific score inferred using pySCENIC and by calculating the average expression.
Page: 1 

Top

Somatic mutation of malignant transformation related genes

check buttonAnnotation of somatic variants for genes involved in malignant transformation
Hugo SymbolVariant ClassVariant ClassificationdbSNP RSHGVScHGVSpHGVSp ShortSWISSPROTBIOTYPESIFTPolyPhenTumor Sample BarcodeTissueHistologySexAgeStageTherapy TypesDrugsOutcome
SAFBSNVMissense_Mutationrs770745797c.502N>Ap.Glu168Lysp.E168KQ15424protein_codingtolerated(0.39)benign(0.372)TCGA-AC-A7VC-01Breastbreast invasive carcinomaFemale<65I/IIUnknownUnknownSD
SAFBSNVMissense_Mutationc.2311N>Tp.Met771Leup.M771LQ15424protein_codingtolerated(0.12)benign(0.003)TCGA-AN-A041-01Breastbreast invasive carcinomaFemale<65I/IIUnknownUnknownSD
SAFBSNVMissense_Mutationc.1825N>Gp.Lys609Glup.K609EQ15424protein_codingdeleterious(0)probably_damaging(0.983)TCGA-AN-A0AK-01Breastbreast invasive carcinomaFemale>=65I/IIUnknownUnknownSD
SAFBSNVMissense_Mutationc.1534N>Gp.Asn512Aspp.N512DQ15424protein_codingtolerated(0.45)benign(0.029)TCGA-AR-A24Q-01Breastbreast invasive carcinomaFemale<65I/IIChemotherapydoxorubicinSD
SAFBSNVMissense_Mutationc.1471A>Tp.Thr491Serp.T491SQ15424protein_codingtolerated(0.61)benign(0.017)TCGA-E9-A3HO-01Breastbreast invasive carcinomaFemale<65I/IIChemotherapycyclophosphamideCR
SAFBinsertionFrame_Shift_Insnovelc.2290_2291insTGAGACTCp.Arg764MetfsTer11p.R764Mfs*11Q15424protein_codingTCGA-A2-A0EO-01Breastbreast invasive carcinomaFemale<65I/IIHormone TherapytamoxiphenSD
SAFBinsertionFrame_Shift_Insnovelc.2330_2331insATp.Gln778TyrfsTer31p.Q778Yfs*31Q15424protein_codingTCGA-A2-A0EY-01Breastbreast invasive carcinomaFemale<65I/IIChemotherapyadriamycinSD
SAFBinsertionNonsense_Mutationnovelc.2332_2333insAATGCAACTTCTATAAAGGGCCTTGTAAACTGTTCTp.Gln778_His779insCysAsnPheTyrLysGlyProCysLysLeuPheTerp.Q778_H779insCNFYKGPCKLF*Q15424protein_codingTCGA-A2-A0EY-01Breastbreast invasive carcinomaFemale<65I/IIChemotherapyadriamycinSD
SAFBinsertionFrame_Shift_Insnovelc.178_179insTTTTCAACAAACCAACAAAAAAATGCAATACCCATCTAGTAACCAAAp.Arg60LeufsTer18p.R60Lfs*18Q15424protein_codingTCGA-BH-A0B1-01Breastbreast invasive carcinomaFemale>=65I/IIChemotherapyadriamycinSD
SAFBdeletionFrame_Shift_Delnovelc.602delNp.Ile201AsnfsTer30p.I201Nfs*30Q15424protein_codingTCGA-D8-A27V-01Breastbreast invasive carcinomaFemale<65I/IIHormone TherapytamoxiphenSD
Page: 1 2 3 4 5 6 7 8 9 10 

Top

Related drugs of malignant transformation related genes

check buttonIdentification of chemicals and drugs interact with genes involved in malignant transfromation
(DGIdb 4.0)
Entrez IDSymbolCategoryInteraction TypesDrug Claim NameDrug NamePMIDs
Page: 1