
|
|||||
|
 | |
| |
| |
| |
| |
| |
|
Gene: SAE1 |
Gene summary for SAE1 |
| Gene information | Species | Human | Gene symbol | SAE1 | Gene ID | 10055 |
| Gene name | SUMO1 activating enzyme subunit 1 | |
| Gene Alias | AOS1 | |
| Cytomap | 19q13.32 | |
| Gene Type | protein-coding | GO ID | GO:0006464 | UniProtAcc | Q9UBE0 |
Top |
Malignant transformation analysis |
| Identification of the aberrant gene expression in precancerous and cancerous lesions by comparing the gene expression of stem-like cells in diseased tissues with normal stem cells |
| Entrez ID | Symbol | Replicates | Species | Organ | Tissue | Adj P-value | Log2FC | Malignancy |
| 10055 | SAE1 | AEH-subject1 | Human | Endometrium | AEH | 4.45e-06 | 1.95e-01 | -0.3059 |
| 10055 | SAE1 | AEH-subject2 | Human | Endometrium | AEH | 2.32e-05 | 1.30e-01 | -0.2525 |
| 10055 | SAE1 | AEH-subject3 | Human | Endometrium | AEH | 1.10e-06 | 1.18e-01 | -0.2576 |
| 10055 | SAE1 | EEC-subject1 | Human | Endometrium | EEC | 5.71e-03 | 1.80e-02 | -0.2682 |
| 10055 | SAE1 | EEC-subject2 | Human | Endometrium | EEC | 2.86e-02 | -1.12e-02 | -0.2607 |
| 10055 | SAE1 | EEC-subject3 | Human | Endometrium | EEC | 4.64e-05 | -1.41e-01 | -0.2525 |
| 10055 | SAE1 | EEC-subject4 | Human | Endometrium | EEC | 3.06e-02 | -5.47e-02 | -0.2571 |
| 10055 | SAE1 | GSM5276934 | Human | Endometrium | EEC | 4.02e-04 | -1.69e-01 | -0.0913 |
| 10055 | SAE1 | GSM6177620_NYU_UCEC1_lib1_lib1 | Human | Endometrium | EEC | 3.44e-15 | -1.33e-01 | -0.1869 |
| 10055 | SAE1 | GSM6177620_NYU_UCEC1_lib2_lib2 | Human | Endometrium | EEC | 7.26e-18 | -1.49e-01 | -0.1875 |
| 10055 | SAE1 | GSM6177620_NYU_UCEC1_lib3_lib3 | Human | Endometrium | EEC | 4.37e-21 | -4.70e-02 | -0.1883 |
| 10055 | SAE1 | GSM6177621_NYU_UCEC2_lib1_lib1 | Human | Endometrium | EEC | 6.20e-10 | -7.04e-02 | -0.1934 |
| 10055 | SAE1 | GSM6177622_NYU_UCEC3_lib1_lib1 | Human | Endometrium | EEC | 5.85e-21 | -3.14e-02 | -0.1917 |
| 10055 | SAE1 | GSM6177622_NYU_UCEC3_lib2_lib2 | Human | Endometrium | EEC | 2.40e-22 | -7.21e-02 | -0.1916 |
| 10055 | SAE1 | LZE4T | Human | Esophagus | ESCC | 2.23e-22 | 6.72e-01 | 0.0811 |
| 10055 | SAE1 | LZE5T | Human | Esophagus | ESCC | 2.55e-05 | 3.49e-01 | 0.0514 |
| 10055 | SAE1 | LZE7T | Human | Esophagus | ESCC | 2.77e-10 | 8.11e-01 | 0.0667 |
| 10055 | SAE1 | LZE8T | Human | Esophagus | ESCC | 5.31e-05 | 2.94e-01 | 0.067 |
| 10055 | SAE1 | LZE22T | Human | Esophagus | ESCC | 4.44e-06 | 7.82e-01 | 0.068 |
| 10055 | SAE1 | LZE24T | Human | Esophagus | ESCC | 5.30e-16 | 5.62e-01 | 0.0596 |
| Page: 1 2 3 4 5 6 7 |
| Tissue | Expression Dynamics | Abbreviation |
| Endometrium | 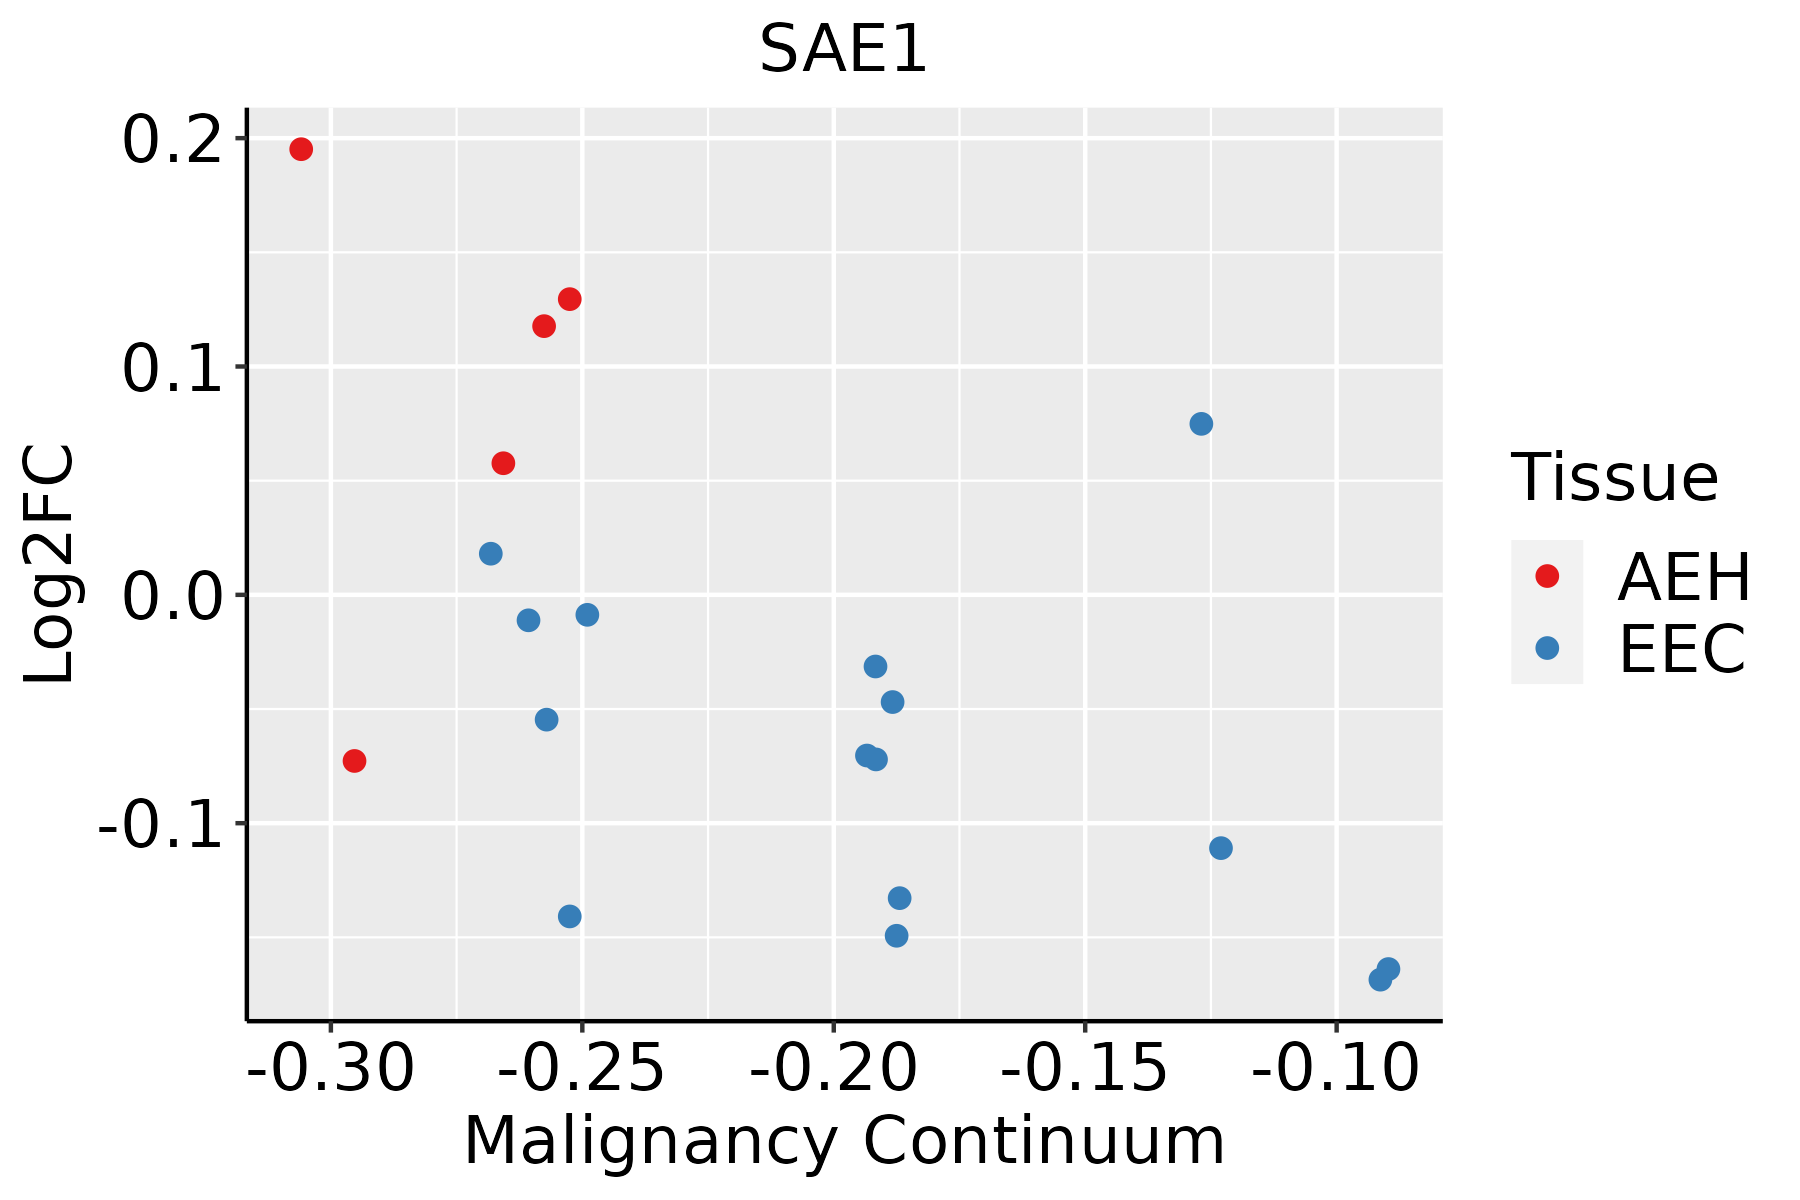 | AEH: Atypical endometrial hyperplasia |
| EEC: Endometrioid Cancer | ||
| Esophagus |  | ESCC: Esophageal squamous cell carcinoma |
| HGIN: High-grade intraepithelial neoplasias | ||
| LGIN: Low-grade intraepithelial neoplasias | ||
| Liver |  | HCC: Hepatocellular carcinoma |
| NAFLD: Non-alcoholic fatty liver disease | ||
| Oral Cavity | 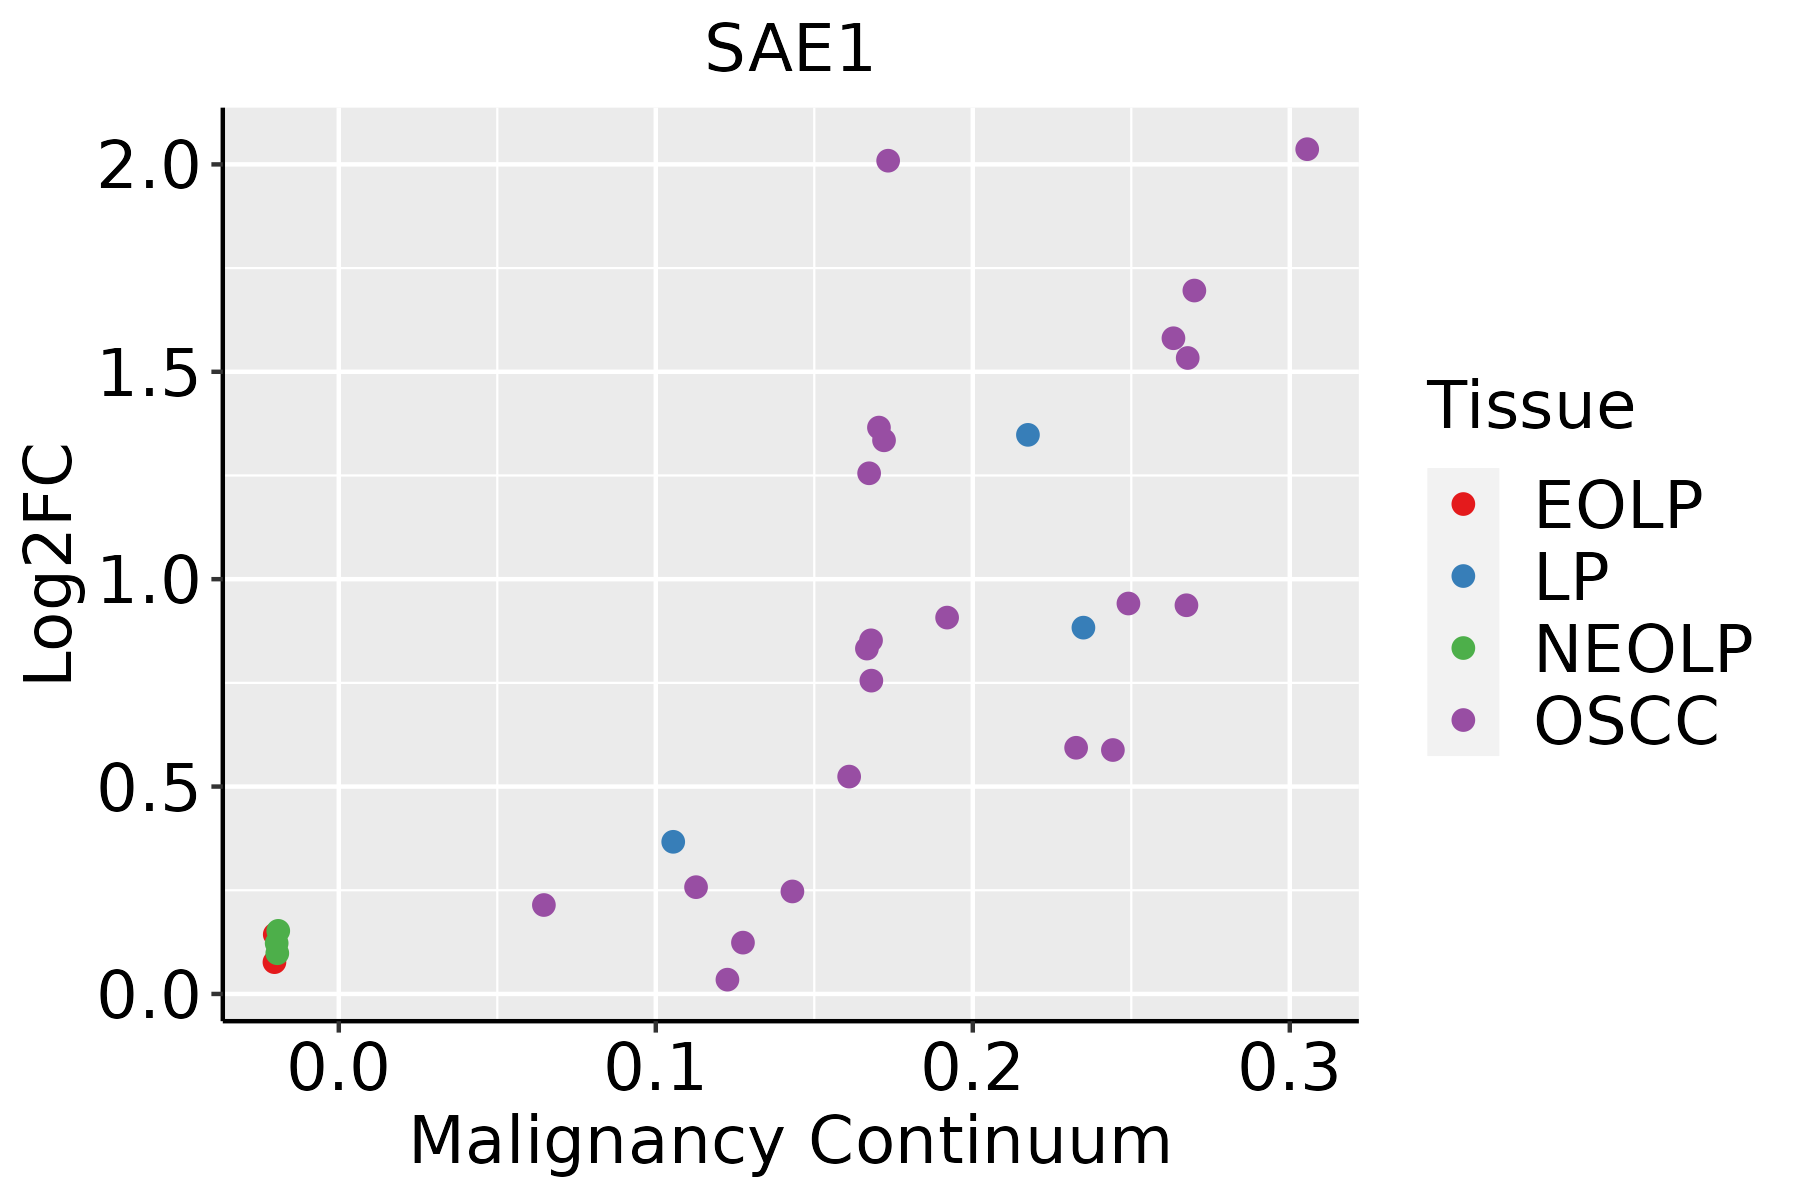 | EOLP: Erosive Oral lichen planus |
| LP: leukoplakia | ||
| NEOLP: Non-erosive oral lichen planus | ||
| OSCC: Oral squamous cell carcinoma | ||
| Skin | 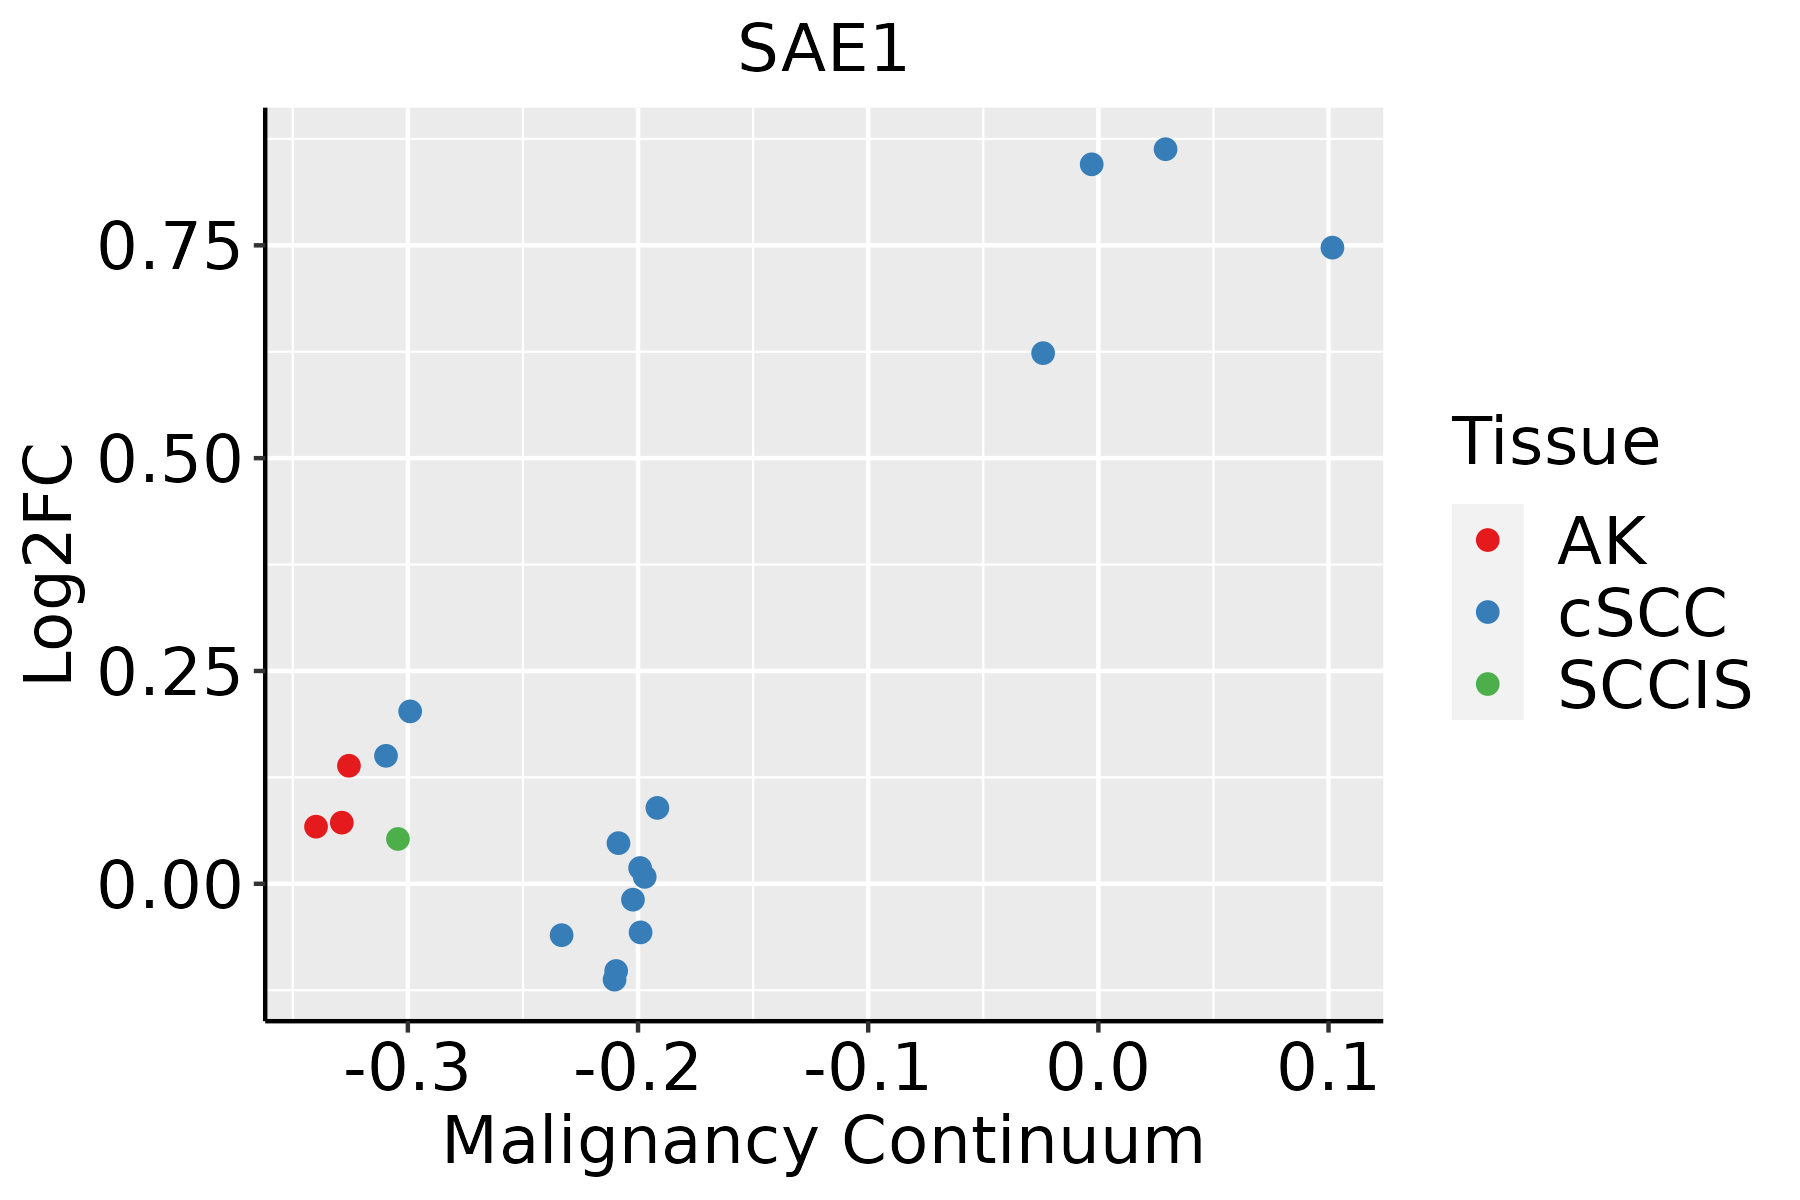 | AK: Actinic keratosis |
| cSCC: Cutaneous squamous cell carcinoma | ||
| SCCIS:squamous cell carcinoma in situ | ||
| Thyroid |  | ATC: Anaplastic thyroid cancer |
| HT: Hashimoto's thyroiditis | ||
| PTC: Papillary thyroid cancer |
| ∗log2FC in expression of this searched gene in stem-like cells from each diseased tissue sample relative to stem-like cells in normal samples in each tissue plotted against the malignancy continuum. Samples are colored based on if they are from different disease stage. |
Top |
Malignant transformation related pathway analysis |
| Find out the enriched GO biological processes and KEGG pathways involved in transition from healthy to precancer to cancer |
| Tissue | Disease Stage | Enriched GO biological Processes |
| Colorectum | AD |  |
| Colorectum | SER |  |
| Colorectum | MSS |  |
| Colorectum | MSI-H |  |
| Colorectum | FAP |  |
| ∗Top 15 enriched GO BP terms are showed in the bar plot of each disease state in each tissue. Each row represents a significant GO biological process which is colored according to the -log10(p.adjust). |
| Page: 1 2 3 4 5 6 7 8 9 |
| GO ID | Tissue | Disease Stage | Description | Gene Ratio | Bg Ratio | pvalue | p.adjust | Count |
| GO:190332016 | Endometrium | AEH | regulation of protein modification by small protein conjugation or removal | 67/2100 | 242/18723 | 1.10e-12 | 2.26e-10 | 67 |
| GO:000683910 | Endometrium | AEH | mitochondrial transport | 66/2100 | 254/18723 | 3.55e-11 | 4.96e-09 | 66 |
| GO:190495115 | Endometrium | AEH | positive regulation of establishment of protein localization | 74/2100 | 319/18723 | 7.05e-10 | 6.51e-08 | 74 |
| GO:190382916 | Endometrium | AEH | positive regulation of cellular protein localization | 66/2100 | 276/18723 | 1.57e-09 | 1.36e-07 | 66 |
| GO:007259410 | Endometrium | AEH | establishment of protein localization to organelle | 89/2100 | 422/18723 | 2.41e-09 | 1.90e-07 | 89 |
| GO:000660516 | Endometrium | AEH | protein targeting | 68/2100 | 314/18723 | 6.30e-08 | 3.38e-06 | 68 |
| GO:005122215 | Endometrium | AEH | positive regulation of protein transport | 66/2100 | 303/18723 | 7.79e-08 | 3.99e-06 | 66 |
| GO:003315710 | Endometrium | AEH | regulation of intracellular protein transport | 51/2100 | 229/18723 | 1.13e-06 | 3.75e-05 | 51 |
| GO:003238810 | Endometrium | AEH | positive regulation of intracellular transport | 46/2100 | 202/18723 | 1.96e-06 | 5.93e-05 | 46 |
| GO:00323869 | Endometrium | AEH | regulation of intracellular transport | 66/2100 | 337/18723 | 4.18e-06 | 1.10e-04 | 66 |
| GO:00903168 | Endometrium | AEH | positive regulation of intracellular protein transport | 38/2100 | 160/18723 | 5.22e-06 | 1.33e-04 | 38 |
| GO:007058510 | Endometrium | AEH | protein localization to mitochondrion | 32/2100 | 125/18723 | 5.38e-06 | 1.36e-04 | 32 |
| GO:007265510 | Endometrium | AEH | establishment of protein localization to mitochondrion | 31/2100 | 120/18723 | 6.13e-06 | 1.50e-04 | 31 |
| GO:000662610 | Endometrium | AEH | protein targeting to mitochondrion | 26/2100 | 100/18723 | 2.96e-05 | 5.47e-04 | 26 |
| GO:19033225 | Endometrium | AEH | positive regulation of protein modification by small protein conjugation or removal | 31/2100 | 138/18723 | 1.14e-04 | 1.61e-03 | 31 |
| GO:19032145 | Endometrium | AEH | regulation of protein targeting to mitochondrion | 13/2100 | 44/18723 | 7.79e-04 | 7.36e-03 | 13 |
| GO:19037476 | Endometrium | AEH | regulation of establishment of protein localization to mitochondrion | 14/2100 | 50/18723 | 8.97e-04 | 8.24e-03 | 14 |
| GO:19035335 | Endometrium | AEH | regulation of protein targeting | 18/2100 | 81/18723 | 3.28e-03 | 2.30e-02 | 18 |
| GO:19037495 | Endometrium | AEH | positive regulation of establishment of protein localization to mitochondrion | 10/2100 | 36/18723 | 5.04e-03 | 3.16e-02 | 10 |
| GO:19039554 | Endometrium | AEH | positive regulation of protein targeting to mitochondrion | 9/2100 | 32/18723 | 7.02e-03 | 4.07e-02 | 9 |
| Page: 1 2 3 4 5 6 7 8 9 10 |
| Pathway ID | Tissue | Disease Stage | Description | Gene Ratio | Bg Ratio | pvalue | p.adjust | qvalue | Count |
| hsa0412016 | Endometrium | AEH | Ubiquitin mediated proteolysis | 41/1197 | 142/8465 | 3.42e-06 | 4.27e-05 | 3.13e-05 | 41 |
| hsa0412017 | Endometrium | AEH | Ubiquitin mediated proteolysis | 41/1197 | 142/8465 | 3.42e-06 | 4.27e-05 | 3.13e-05 | 41 |
| hsa0412023 | Endometrium | EEC | Ubiquitin mediated proteolysis | 41/1237 | 142/8465 | 7.86e-06 | 9.58e-05 | 7.14e-05 | 41 |
| hsa0412033 | Endometrium | EEC | Ubiquitin mediated proteolysis | 41/1237 | 142/8465 | 7.86e-06 | 9.58e-05 | 7.14e-05 | 41 |
| hsa0412027 | Esophagus | ESCC | Ubiquitin mediated proteolysis | 122/4205 | 142/8465 | 6.53e-20 | 7.29e-18 | 3.74e-18 | 122 |
| hsa0412036 | Esophagus | ESCC | Ubiquitin mediated proteolysis | 122/4205 | 142/8465 | 6.53e-20 | 7.29e-18 | 3.74e-18 | 122 |
| hsa0412041 | Liver | HCC | Ubiquitin mediated proteolysis | 110/4020 | 142/8465 | 1.67e-13 | 3.74e-12 | 2.08e-12 | 110 |
| hsa0412051 | Liver | HCC | Ubiquitin mediated proteolysis | 110/4020 | 142/8465 | 1.67e-13 | 3.74e-12 | 2.08e-12 | 110 |
| hsa0412020 | Oral cavity | OSCC | Ubiquitin mediated proteolysis | 105/3704 | 142/8465 | 1.83e-13 | 4.37e-12 | 2.23e-12 | 105 |
| hsa04120110 | Oral cavity | OSCC | Ubiquitin mediated proteolysis | 105/3704 | 142/8465 | 1.83e-13 | 4.37e-12 | 2.23e-12 | 105 |
| hsa0412025 | Oral cavity | LP | Ubiquitin mediated proteolysis | 66/2418 | 142/8465 | 3.74e-06 | 3.46e-05 | 2.23e-05 | 66 |
| hsa0412035 | Oral cavity | LP | Ubiquitin mediated proteolysis | 66/2418 | 142/8465 | 3.74e-06 | 3.46e-05 | 2.23e-05 | 66 |
| Page: 1 |
Top |
Cell-cell communication analysis |
| Identification of potential cell-cell interactions between two cell types and their ligand-receptor pairs for different disease states |
| Ligand | Receptor | LRpair | Pathway | Tissue | Disease Stage |
| Page: 1 |
Top |
Single-cell gene regulatory network inference analysis |
| Find out the significant the regulons (TFs) and the target genes of each regulon across cell types for different disease states |
| TF | Cell Type | Tissue | Disease Stage | Target Gene | RSS | Regulon Activity |
| ∗The dot plots of a searched regulon are shown for all cell subpopulations in each disease state of each tissue based on the regulon specific score inferred using pySCENIC and by calculating the average expression. |
| Page: 1 |
Top |
Somatic mutation of malignant transformation related genes |
| Annotation of somatic variants for genes involved in malignant transformation |
| Hugo Symbol | Variant Class | Variant Classification | dbSNP RS | HGVSc | HGVSp | HGVSp Short | SWISSPROT | BIOTYPE | SIFT | PolyPhen | Tumor Sample Barcode | Tissue | Histology | Sex | Age | Stage | Therapy Types | Drugs | Outcome |
| SAE1 | SNV | Missense_Mutation | c.37N>C | p.Glu13Gln | p.E13Q | Q9UBE0 | protein_coding | deleterious(0) | benign(0.251) | TCGA-AC-A23H-01 | Breast | breast invasive carcinoma | Female | >=65 | I/II | Unknown | Unknown | PD | |
| SAE1 | SNV | Missense_Mutation | c.911N>T | p.Ala304Val | p.A304V | Q9UBE0 | protein_coding | deleterious(0) | possibly_damaging(0.533) | TCGA-BH-A18G-01 | Breast | breast invasive carcinoma | Female | >=65 | I/II | Unknown | Unknown | SD | |
| SAE1 | SNV | Missense_Mutation | novel | c.836N>T | p.Ser279Leu | p.S279L | Q9UBE0 | protein_coding | tolerated(0.14) | benign(0.01) | TCGA-C8-A8HP-01 | Breast | breast invasive carcinoma | Female | <65 | III/IV | Chemotherapy | 5-fluorouracil | CR |
| SAE1 | SNV | Missense_Mutation | c.376N>C | p.Phe126Leu | p.F126L | Q9UBE0 | protein_coding | deleterious(0.01) | probably_damaging(0.97) | TCGA-D8-A1XK-01 | Breast | breast invasive carcinoma | Female | <65 | I/II | Chemotherapy | doxorubicine+cyclophosphamide | SD | |
| SAE1 | SNV | Missense_Mutation | rs747367118 | c.656C>T | p.Ala219Val | p.A219V | Q9UBE0 | protein_coding | tolerated(0.38) | benign(0.263) | TCGA-E9-A1NC-01 | Breast | breast invasive carcinoma | Female | <65 | I/II | Chemotherapy | doxorubicin | CR |
| SAE1 | SNV | Missense_Mutation | rs778336657 | c.112N>T | p.Arg38Trp | p.R38W | Q9UBE0 | protein_coding | deleterious(0) | probably_damaging(0.999) | TCGA-MY-A5BE-01 | Cervix | cervical & endocervical cancer | Female | <65 | I/II | Unknown | Unknown | SD |
| SAE1 | SNV | Missense_Mutation | novel | c.58N>A | p.Asp20Asn | p.D20N | Q9UBE0 | protein_coding | deleterious(0.03) | probably_damaging(0.996) | TCGA-VS-A94Z-01 | Cervix | cervical & endocervical cancer | Female | <65 | I/II | Chemotherapy | cisplatin | CR |
| SAE1 | SNV | Missense_Mutation | rs199801330 | c.127G>A | p.Gly43Ser | p.G43S | Q9UBE0 | protein_coding | deleterious(0.05) | probably_damaging(0.992) | TCGA-5M-AAT6-01 | Colorectum | colon adenocarcinoma | Female | <65 | III/IV | Unknown | Unknown | PD |
| SAE1 | SNV | Missense_Mutation | c.689N>T | p.Lys230Met | p.K230M | Q9UBE0 | protein_coding | deleterious(0.01) | benign(0.007) | TCGA-A6-5661-01 | Colorectum | colon adenocarcinoma | Female | >=65 | I/II | Unknown | Unknown | SD | |
| SAE1 | SNV | Missense_Mutation | c.358N>A | p.Glu120Lys | p.E120K | Q9UBE0 | protein_coding | deleterious(0.05) | benign(0.102) | TCGA-AA-3869-01 | Colorectum | colon adenocarcinoma | Male | >=65 | III/IV | Chemotherapy | capecitabine | PD |
| Page: 1 2 3 |
Top |
Related drugs of malignant transformation related genes |
| Identification of chemicals and drugs interact with genes involved in malignant transfromation |
| (DGIdb 4.0) |
| Entrez ID | Symbol | Category | Interaction Types | Drug Claim Name | Drug Name | PMIDs |
| 10055 | SAE1 | ENZYME, DRUGGABLE GENOME | 4-PHENYLAMINO-[1,2]NAPHTHOQUINONE | CHEMBL299853 | ||
| 10055 | SAE1 | ENZYME, DRUGGABLE GENOME | BENSERAZIDE HYDROCHLORIDE | BENSERAZIDE HYDROCHLORIDE | ||
| 10055 | SAE1 | ENZYME, DRUGGABLE GENOME | GINGKOLIC ACID | GINGKOLIC ACID | 23920437 | |
| 10055 | SAE1 | ENZYME, DRUGGABLE GENOME | PEVONEDISTAT | PEVONEDISTAT | ||
| 10055 | SAE1 | ENZYME, DRUGGABLE GENOME | BETULINIC ACID | BETULINIC ACID | ||
| 10055 | SAE1 | ENZYME, DRUGGABLE GENOME | LIPOIC ACID, ALPHA | LIPOIC ACID, ALPHA | ||
| 10055 | SAE1 | ENZYME, DRUGGABLE GENOME | LOBARIC ACID | LOBARIC ACID | ||
| 10055 | SAE1 | ENZYME, DRUGGABLE GENOME | ASTERRIC ACID | ASTERRIC ACID |
| Page: 1 |

Copyright 2023-Present -The University of Texas Health Science Center at Houston |