
|
|||||
|
 | |
| |
| |
| |
| |
| |
|
Gene: SACS |
Gene summary for SACS |
| Gene information | Species | Human | Gene symbol | SACS | Gene ID | 26278 |
| Gene name | sacsin molecular chaperone | |
| Gene Alias | ARSACS | |
| Cytomap | 13q12.12 | |
| Gene Type | protein-coding | GO ID | GO:0006457 | UniProtAcc | Q9NZJ4 |
Top |
Malignant transformation analysis |
| Identification of the aberrant gene expression in precancerous and cancerous lesions by comparing the gene expression of stem-like cells in diseased tissues with normal stem cells |
| Entrez ID | Symbol | Replicates | Species | Organ | Tissue | Adj P-value | Log2FC | Malignancy |
| 26278 | SACS | HCC1_Meng | Human | Liver | HCC | 7.47e-29 | 1.10e-01 | 0.0246 |
| 26278 | SACS | HCC2_Meng | Human | Liver | HCC | 4.33e-03 | 4.21e-02 | 0.0107 |
| 26278 | SACS | HCC2 | Human | Liver | HCC | 6.71e-09 | 3.20e+00 | 0.5341 |
| 26278 | SACS | S014 | Human | Liver | HCC | 1.00e-11 | 3.16e-01 | 0.2254 |
| 26278 | SACS | S015 | Human | Liver | HCC | 3.44e-11 | 3.64e-01 | 0.2375 |
| 26278 | SACS | S016 | Human | Liver | HCC | 1.03e-10 | 3.19e-01 | 0.2243 |
| 26278 | SACS | S027 | Human | Liver | HCC | 7.22e-04 | 2.69e-01 | 0.2446 |
| 26278 | SACS | S028 | Human | Liver | HCC | 1.80e-19 | 5.96e-01 | 0.2503 |
| 26278 | SACS | S029 | Human | Liver | HCC | 8.63e-16 | 5.78e-01 | 0.2581 |
| 26278 | SACS | ATC09 | Human | Thyroid | ATC | 1.87e-07 | 2.07e-01 | 0.2871 |
| 26278 | SACS | ATC11 | Human | Thyroid | ATC | 6.82e-13 | 6.83e-01 | 0.3386 |
| 26278 | SACS | ATC12 | Human | Thyroid | ATC | 3.68e-03 | 9.04e-02 | 0.34 |
| 26278 | SACS | ATC13 | Human | Thyroid | ATC | 1.53e-48 | 8.17e-01 | 0.34 |
| 26278 | SACS | ATC1 | Human | Thyroid | ATC | 8.64e-07 | 2.46e-01 | 0.2878 |
| 26278 | SACS | ATC2 | Human | Thyroid | ATC | 1.04e-12 | 1.18e+00 | 0.34 |
| 26278 | SACS | ATC3 | Human | Thyroid | ATC | 8.75e-16 | 7.15e-01 | 0.338 |
| 26278 | SACS | ATC4 | Human | Thyroid | ATC | 5.04e-05 | 1.25e-01 | 0.34 |
| 26278 | SACS | ATC5 | Human | Thyroid | ATC | 1.40e-46 | 9.06e-01 | 0.34 |
| Page: 1 |
| Tissue | Expression Dynamics | Abbreviation |
| Liver | 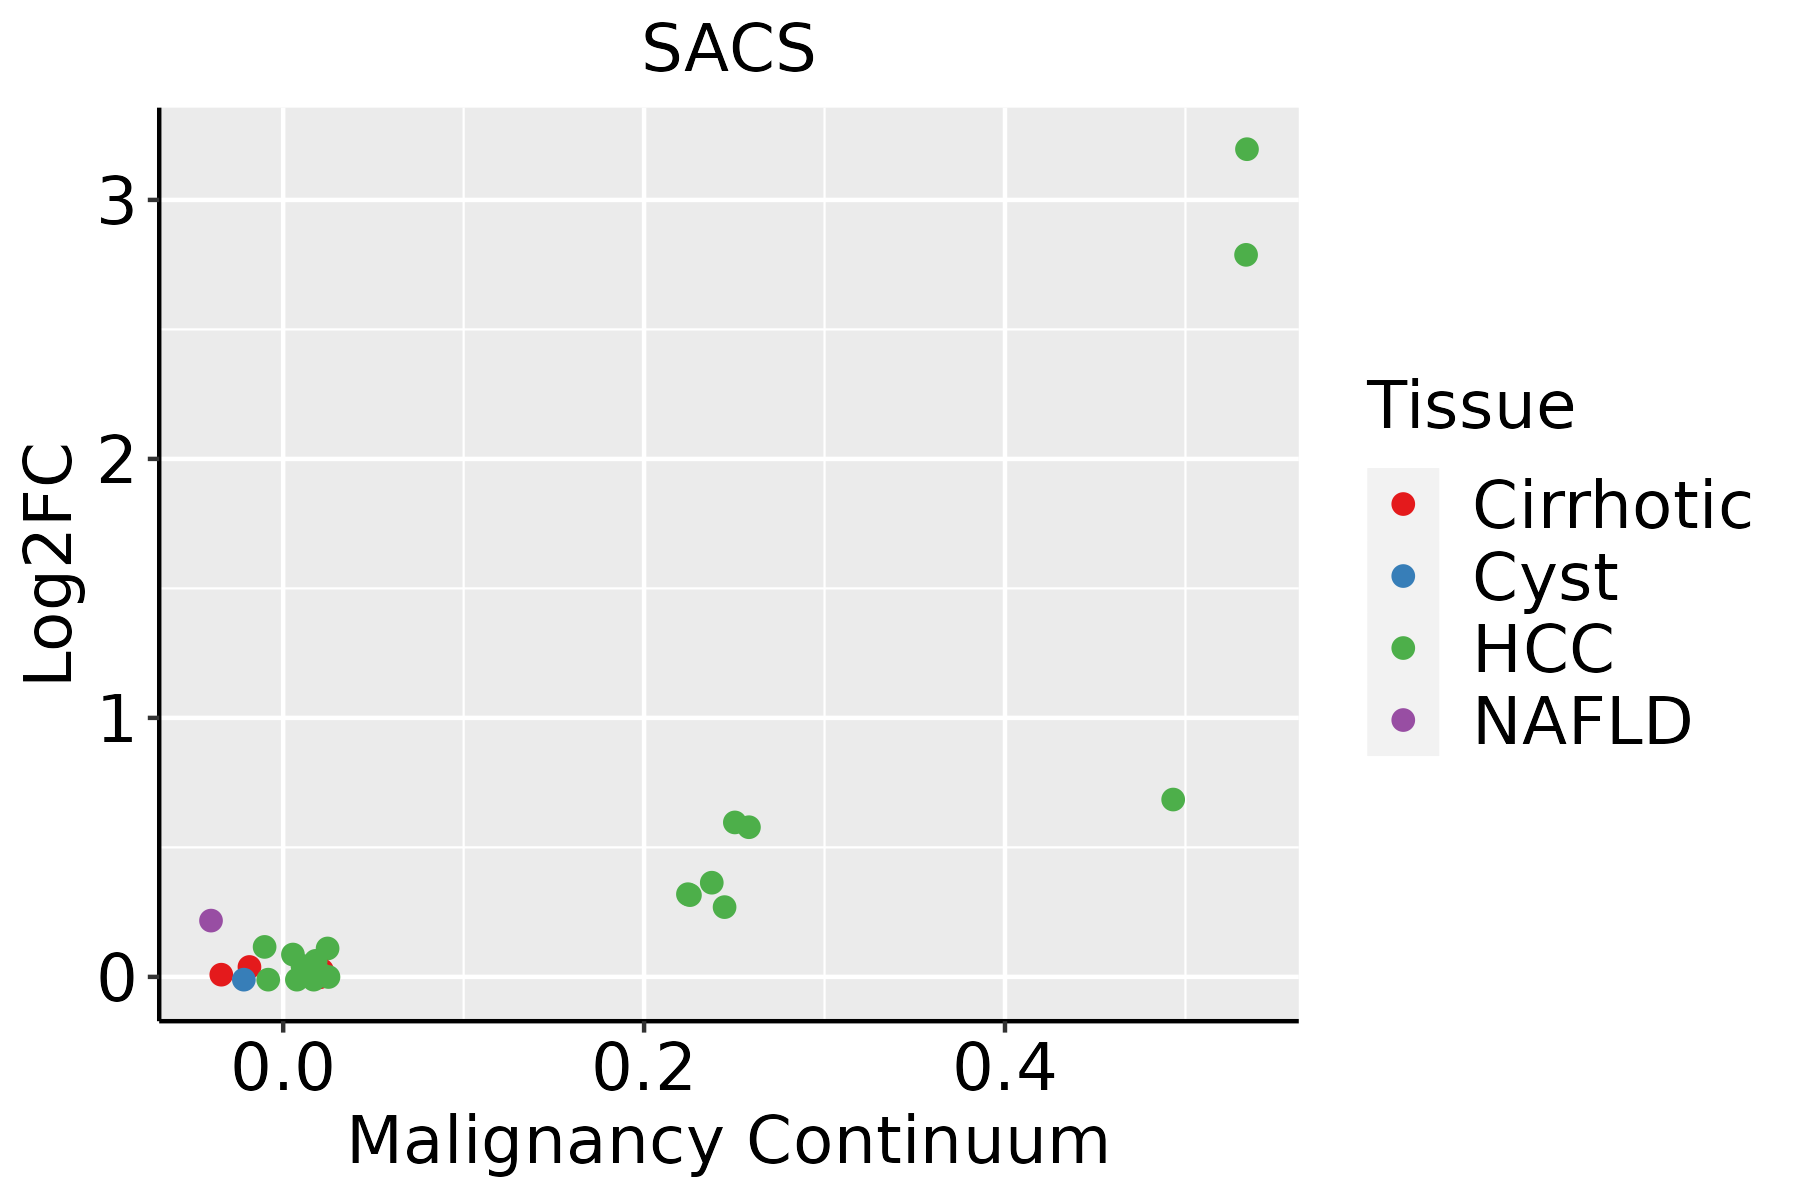 | HCC: Hepatocellular carcinoma |
| NAFLD: Non-alcoholic fatty liver disease | ||
| Thyroid | 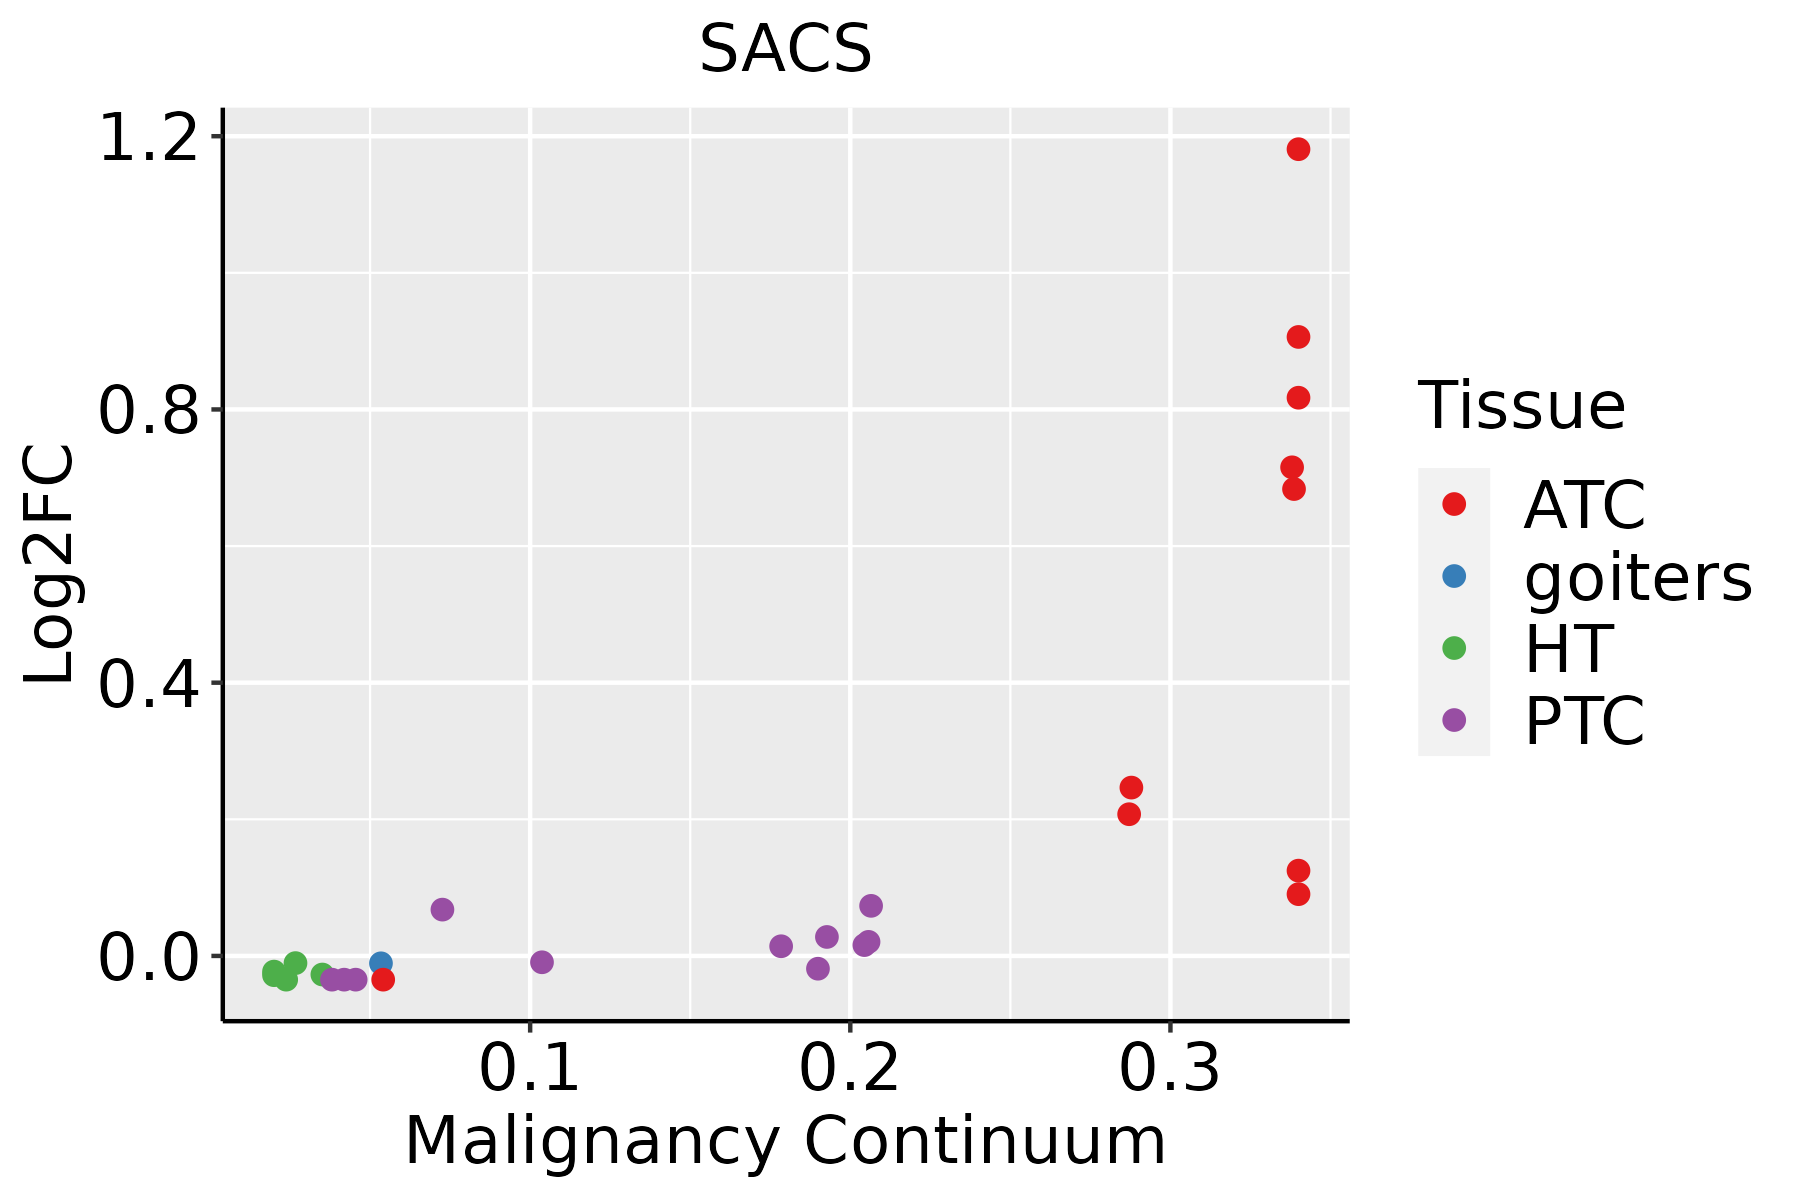 | ATC: Anaplastic thyroid cancer |
| HT: Hashimoto's thyroiditis | ||
| PTC: Papillary thyroid cancer |
| ∗log2FC in expression of this searched gene in stem-like cells from each diseased tissue sample relative to stem-like cells in normal samples in each tissue plotted against the malignancy continuum. Samples are colored based on if they are from different disease stage. |
Top |
Malignant transformation related pathway analysis |
| Find out the enriched GO biological processes and KEGG pathways involved in transition from healthy to precancer to cancer |
| Tissue | Disease Stage | Enriched GO biological Processes |
| Colorectum | AD |  |
| Colorectum | SER |  |
| Colorectum | MSS |  |
| Colorectum | MSI-H |  |
| Colorectum | FAP |  |
| ∗Top 15 enriched GO BP terms are showed in the bar plot of each disease state in each tissue. Each row represents a significant GO biological process which is colored according to the -log10(p.adjust). |
| Page: 1 2 3 4 5 6 7 8 9 |
| GO ID | Tissue | Disease Stage | Description | Gene Ratio | Bg Ratio | pvalue | p.adjust | Count |
| GO:000645712 | Liver | HCC | protein folding | 160/7958 | 212/18723 | 1.07e-22 | 1.88e-20 | 160 |
| GO:007084111 | Liver | HCC | inclusion body assembly | 20/7958 | 24/18723 | 4.92e-05 | 4.70e-04 | 20 |
| GO:009008311 | Liver | HCC | regulation of inclusion body assembly | 14/7958 | 17/18723 | 9.39e-04 | 5.47e-03 | 14 |
| GO:009008411 | Liver | HCC | negative regulation of inclusion body assembly | 9/7958 | 11/18723 | 9.51e-03 | 3.60e-02 | 9 |
| GO:000645733 | Thyroid | ATC | protein folding | 140/6293 | 212/18723 | 3.46e-22 | 8.09e-20 | 140 |
| GO:009008324 | Thyroid | ATC | regulation of inclusion body assembly | 12/6293 | 17/18723 | 2.02e-03 | 9.60e-03 | 12 |
| GO:0070841111 | Thyroid | ATC | inclusion body assembly | 14/6293 | 24/18723 | 1.12e-02 | 4.00e-02 | 14 |
| Page: 1 |
| Pathway ID | Tissue | Disease Stage | Description | Gene Ratio | Bg Ratio | pvalue | p.adjust | qvalue | Count |
| Page: 1 |
Top |
Cell-cell communication analysis |
| Identification of potential cell-cell interactions between two cell types and their ligand-receptor pairs for different disease states |
| Ligand | Receptor | LRpair | Pathway | Tissue | Disease Stage |
| Page: 1 |
Top |
Single-cell gene regulatory network inference analysis |
| Find out the significant the regulons (TFs) and the target genes of each regulon across cell types for different disease states |
| TF | Cell Type | Tissue | Disease Stage | Target Gene | RSS | Regulon Activity |
| ∗The dot plots of a searched regulon are shown for all cell subpopulations in each disease state of each tissue based on the regulon specific score inferred using pySCENIC and by calculating the average expression. |
| Page: 1 |
Top |
Somatic mutation of malignant transformation related genes |
| Annotation of somatic variants for genes involved in malignant transformation |
| Hugo Symbol | Variant Class | Variant Classification | dbSNP RS | HGVSc | HGVSp | HGVSp Short | SWISSPROT | BIOTYPE | SIFT | PolyPhen | Tumor Sample Barcode | Tissue | Histology | Sex | Age | Stage | Therapy Types | Drugs | Outcome |
| SACS | SNV | Missense_Mutation | novel | c.5111N>T | p.Asn1704Ile | p.N1704I | Q9NZJ4 | protein_coding | deleterious(0) | benign(0.015) | TCGA-A8-A06P-01 | Breast | breast invasive carcinoma | Female | <65 | III/IV | Unspecific | SD | |
| SACS | SNV | Missense_Mutation | rs747293426 | c.6751C>G | p.Gln2251Glu | p.Q2251E | Q9NZJ4 | protein_coding | tolerated(0.15) | benign(0.159) | TCGA-A8-A095-01 | Breast | breast invasive carcinoma | Female | <65 | I/II | Chemotherapy | 5-fluorouracil | CR |
| SACS | SNV | Missense_Mutation | c.5435C>G | p.Thr1812Arg | p.T1812R | Q9NZJ4 | protein_coding | deleterious_low_confidence(0.01) | benign(0.062) | TCGA-A8-A096-01 | Breast | breast invasive carcinoma | Female | >=65 | I/II | Unknown | Unknown | SD | |
| SACS | SNV | Missense_Mutation | rs771944361 | c.12013N>T | p.Leu4005Phe | p.L4005F | Q9NZJ4 | protein_coding | deleterious(0.02) | possibly_damaging(0.717) | TCGA-A8-A09I-01 | Breast | breast invasive carcinoma | Female | >=65 | I/II | Hormone Therapy | anastrozole | SD |
| SACS | SNV | Missense_Mutation | c.13148N>T | p.Ser4383Leu | p.S4383L | Q9NZJ4 | protein_coding | deleterious(0.02) | benign(0.251) | TCGA-AC-A23H-01 | Breast | breast invasive carcinoma | Female | >=65 | I/II | Unknown | Unknown | PD | |
| SACS | SNV | Missense_Mutation | c.7678N>C | p.Glu2560Gln | p.E2560Q | Q9NZJ4 | protein_coding | deleterious(0.01) | probably_damaging(0.991) | TCGA-AC-A23H-01 | Breast | breast invasive carcinoma | Female | >=65 | I/II | Unknown | Unknown | PD | |
| SACS | SNV | Missense_Mutation | c.13252N>A | p.Glu4418Lys | p.E4418K | Q9NZJ4 | protein_coding | deleterious(0.02) | benign(0.193) | TCGA-AC-A5XS-01 | Breast | breast invasive carcinoma | Female | >=65 | I/II | Hormone Therapy | femara | SD | |
| SACS | SNV | Missense_Mutation | novel | c.6469N>T | p.Asp2157Tyr | p.D2157Y | Q9NZJ4 | protein_coding | deleterious(0.01) | probably_damaging(0.966) | TCGA-AC-A5XS-01 | Breast | breast invasive carcinoma | Female | >=65 | I/II | Hormone Therapy | femara | SD |
| SACS | SNV | Missense_Mutation | novel | c.12312N>T | p.Met4104Ile | p.M4104I | Q9NZJ4 | protein_coding | tolerated(0.14) | benign(0.038) | TCGA-AN-A046-01 | Breast | breast invasive carcinoma | Female | >=65 | I/II | Unknown | Unknown | SD |
| SACS | SNV | Missense_Mutation | c.9190N>A | p.Glu3064Lys | p.E3064K | Q9NZJ4 | protein_coding | deleterious(0.01) | benign(0.078) | TCGA-AN-A046-01 | Breast | breast invasive carcinoma | Female | >=65 | I/II | Unknown | Unknown | SD |
| Page: 1 2 3 4 5 6 7 8 9 10 11 12 13 14 15 16 17 18 19 20 21 22 23 24 25 26 27 28 29 30 31 32 33 34 35 36 37 38 39 40 41 42 43 44 45 46 47 48 49 50 51 52 53 54 55 56 57 58 59 60 61 62 63 |
Top |
Related drugs of malignant transformation related genes |
| Identification of chemicals and drugs interact with genes involved in malignant transfromation |
| (DGIdb 4.0) |
| Entrez ID | Symbol | Category | Interaction Types | Drug Claim Name | Drug Name | PMIDs |
| Page: 1 |

Copyright 2023-Present -The University of Texas Health Science Center at Houston |