
|
|||||
|
 | |
| |
| |
| |
| |
| |
|
Gene: SACM1L |
Gene summary for SACM1L |
| Gene information | Species | Human | Gene symbol | SACM1L | Gene ID | 22908 |
| Gene name | SAC1 like phosphatidylinositide phosphatase | |
| Gene Alias | SAC1 | |
| Cytomap | 3p21.31 | |
| Gene Type | protein-coding | GO ID | GO:0006629 | UniProtAcc | Q9NTJ5 |
Top |
Malignant transformation analysis |
| Identification of the aberrant gene expression in precancerous and cancerous lesions by comparing the gene expression of stem-like cells in diseased tissues with normal stem cells |
| Entrez ID | Symbol | Replicates | Species | Organ | Tissue | Adj P-value | Log2FC | Malignancy |
| 22908 | SACM1L | HCC1_Meng | Human | Liver | HCC | 1.22e-41 | -1.13e-02 | 0.0246 |
| 22908 | SACM1L | HCC2_Meng | Human | Liver | HCC | 5.45e-07 | -3.47e-02 | 0.0107 |
| 22908 | SACM1L | HCC1 | Human | Liver | HCC | 4.77e-02 | 2.96e+00 | 0.5336 |
| 22908 | SACM1L | HCC2 | Human | Liver | HCC | 5.37e-11 | 3.55e+00 | 0.5341 |
| 22908 | SACM1L | S015 | Human | Liver | HCC | 5.78e-04 | 2.79e-01 | 0.2375 |
| 22908 | SACM1L | S016 | Human | Liver | HCC | 2.39e-03 | 2.16e-01 | 0.2243 |
| 22908 | SACM1L | S027 | Human | Liver | HCC | 2.52e-04 | 4.40e-01 | 0.2446 |
| 22908 | SACM1L | S028 | Human | Liver | HCC | 4.43e-14 | 5.59e-01 | 0.2503 |
| 22908 | SACM1L | S029 | Human | Liver | HCC | 5.90e-15 | 6.72e-01 | 0.2581 |
| 22908 | SACM1L | PTCwithoutHT_2 | Human | Thyroid | PTC | 1.15e-03 | -2.16e-01 | 0.0419 |
| 22908 | SACM1L | male-WTA | Human | Thyroid | PTC | 4.58e-31 | 7.40e-02 | 0.1037 |
| 22908 | SACM1L | PTC01 | Human | Thyroid | PTC | 1.90e-14 | -5.20e-02 | 0.1899 |
| 22908 | SACM1L | PTC03 | Human | Thyroid | PTC | 9.16e-06 | 2.71e-02 | 0.1784 |
| 22908 | SACM1L | PTC04 | Human | Thyroid | PTC | 2.19e-16 | 1.51e-01 | 0.1927 |
| 22908 | SACM1L | PTC05 | Human | Thyroid | PTC | 2.99e-18 | 3.22e-01 | 0.2065 |
| 22908 | SACM1L | PTC06 | Human | Thyroid | PTC | 1.95e-26 | 3.73e-01 | 0.2057 |
| 22908 | SACM1L | PTC07 | Human | Thyroid | PTC | 1.75e-20 | 2.23e-01 | 0.2044 |
| 22908 | SACM1L | ATC12 | Human | Thyroid | ATC | 4.55e-03 | -8.07e-02 | 0.34 |
| 22908 | SACM1L | ATC13 | Human | Thyroid | ATC | 2.48e-22 | 2.23e-01 | 0.34 |
| 22908 | SACM1L | ATC2 | Human | Thyroid | ATC | 3.98e-11 | 6.73e-01 | 0.34 |
| Page: 1 2 |
| Tissue | Expression Dynamics | Abbreviation |
| Liver | 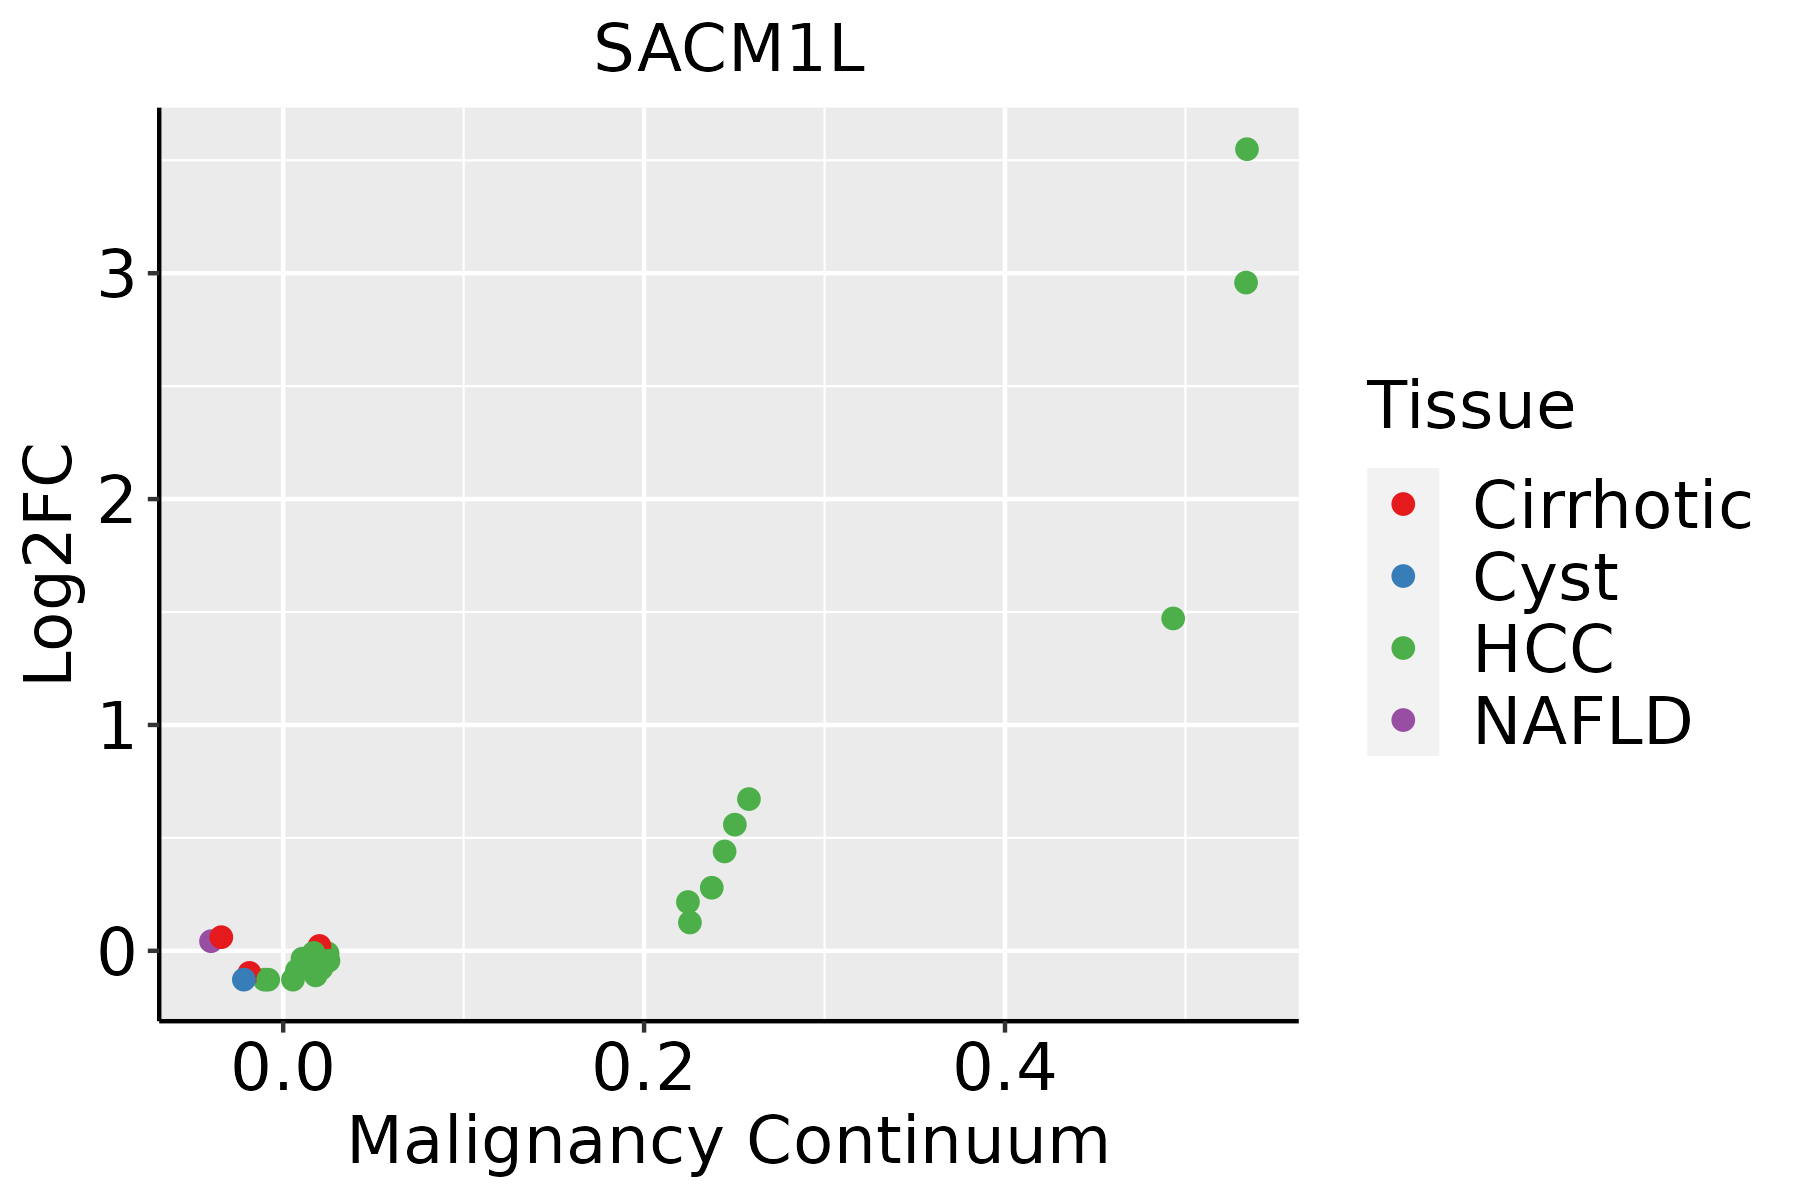 | HCC: Hepatocellular carcinoma |
| NAFLD: Non-alcoholic fatty liver disease | ||
| Thyroid | 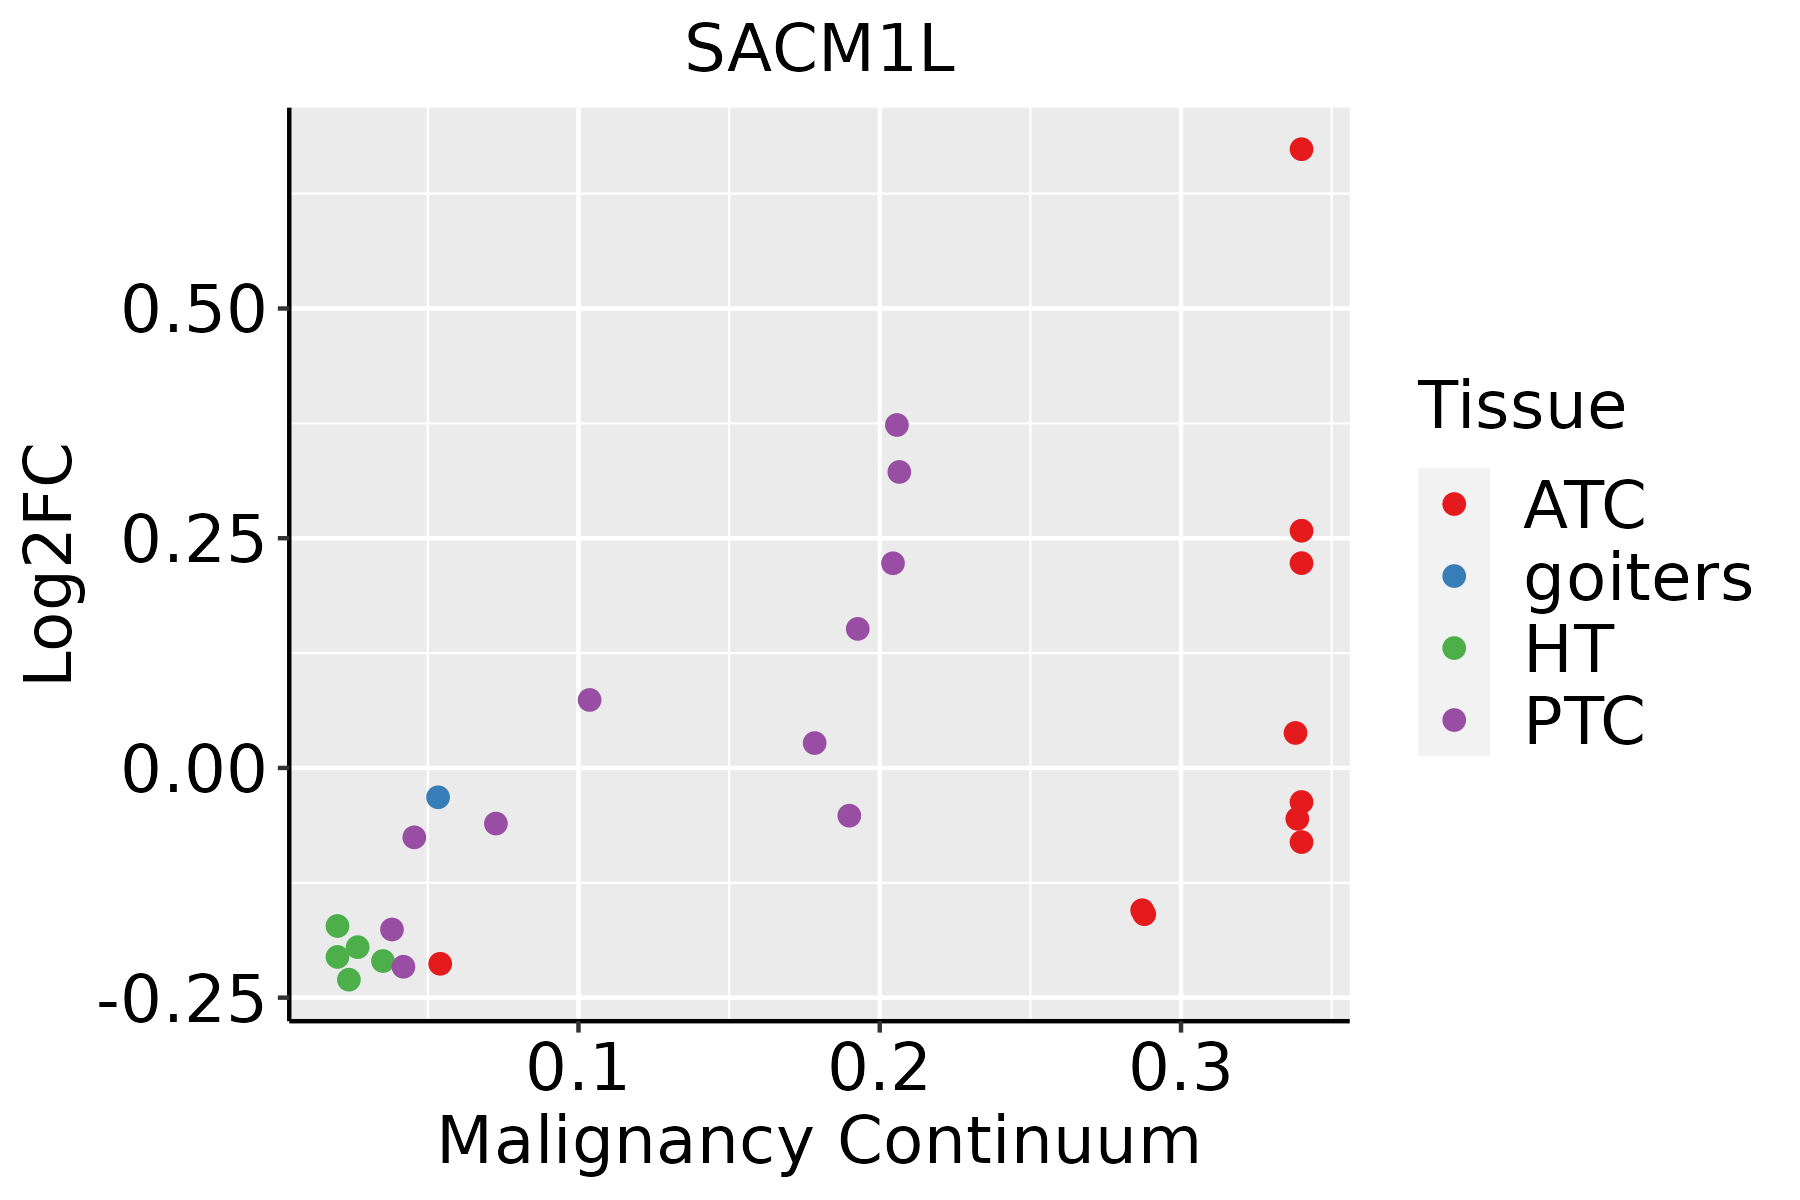 | ATC: Anaplastic thyroid cancer |
| HT: Hashimoto's thyroiditis | ||
| PTC: Papillary thyroid cancer |
| ∗log2FC in expression of this searched gene in stem-like cells from each diseased tissue sample relative to stem-like cells in normal samples in each tissue plotted against the malignancy continuum. Samples are colored based on if they are from different disease stage. |
Top |
Malignant transformation related pathway analysis |
| Find out the enriched GO biological processes and KEGG pathways involved in transition from healthy to precancer to cancer |
| Tissue | Disease Stage | Enriched GO biological Processes |
| Colorectum | AD |  |
| Colorectum | SER |  |
| Colorectum | MSS |  |
| Colorectum | MSI-H |  |
| Colorectum | FAP |  |
| ∗Top 15 enriched GO BP terms are showed in the bar plot of each disease state in each tissue. Each row represents a significant GO biological process which is colored according to the -log10(p.adjust). |
| Page: 1 2 3 4 5 6 7 8 9 |
| GO ID | Tissue | Disease Stage | Description | Gene Ratio | Bg Ratio | pvalue | p.adjust | Count |
| GO:00086542 | Liver | HCC | phospholipid biosynthetic process | 150/7958 | 253/18723 | 4.77e-08 | 1.03e-06 | 150 |
| GO:00066444 | Liver | HCC | phospholipid metabolic process | 214/7958 | 383/18723 | 7.25e-08 | 1.48e-06 | 214 |
| GO:001631121 | Liver | HCC | dephosphorylation | 230/7958 | 417/18723 | 1.00e-07 | 1.96e-06 | 230 |
| GO:004648611 | Liver | HCC | glycerolipid metabolic process | 215/7958 | 392/18723 | 4.54e-07 | 7.49e-06 | 215 |
| GO:004501711 | Liver | HCC | glycerolipid biosynthetic process | 143/7958 | 252/18723 | 3.27e-06 | 4.31e-05 | 143 |
| GO:003025821 | Liver | HCC | lipid modification | 123/7958 | 212/18723 | 3.50e-06 | 4.58e-05 | 123 |
| GO:00066504 | Liver | HCC | glycerophospholipid metabolic process | 168/7958 | 306/18723 | 7.27e-06 | 8.62e-05 | 168 |
| GO:004647411 | Liver | HCC | glycerophospholipid biosynthetic process | 121/7958 | 211/18723 | 9.12e-06 | 1.06e-04 | 121 |
| GO:0006661 | Liver | HCC | phosphatidylinositol biosynthetic process | 69/7958 | 131/18723 | 1.19e-02 | 4.35e-02 | 69 |
| GO:001631116 | Thyroid | PTC | dephosphorylation | 174/5968 | 417/18723 | 1.20e-05 | 1.31e-04 | 174 |
| GO:001631117 | Thyroid | ATC | dephosphorylation | 179/6293 | 417/18723 | 3.88e-05 | 3.15e-04 | 179 |
| Page: 1 |
| Pathway ID | Tissue | Disease Stage | Description | Gene Ratio | Bg Ratio | pvalue | p.adjust | qvalue | Count |
| Page: 1 |
Top |
Cell-cell communication analysis |
| Identification of potential cell-cell interactions between two cell types and their ligand-receptor pairs for different disease states |
| Ligand | Receptor | LRpair | Pathway | Tissue | Disease Stage |
| Page: 1 |
Top |
Single-cell gene regulatory network inference analysis |
| Find out the significant the regulons (TFs) and the target genes of each regulon across cell types for different disease states |
| TF | Cell Type | Tissue | Disease Stage | Target Gene | RSS | Regulon Activity |
| ∗The dot plots of a searched regulon are shown for all cell subpopulations in each disease state of each tissue based on the regulon specific score inferred using pySCENIC and by calculating the average expression. |
| Page: 1 |
Top |
Somatic mutation of malignant transformation related genes |
| Annotation of somatic variants for genes involved in malignant transformation |
| Hugo Symbol | Variant Class | Variant Classification | dbSNP RS | HGVSc | HGVSp | HGVSp Short | SWISSPROT | BIOTYPE | SIFT | PolyPhen | Tumor Sample Barcode | Tissue | Histology | Sex | Age | Stage | Therapy Types | Drugs | Outcome |
| SACM1L | SNV | Missense_Mutation | c.1568N>T | p.Ala523Val | p.A523V | Q9NTJ5 | protein_coding | tolerated(0.38) | benign(0.011) | TCGA-CM-5861-01 | Colorectum | colon adenocarcinoma | Female | <65 | I/II | Unknown | Unknown | PD | |
| SACM1L | SNV | Missense_Mutation | c.1726N>A | p.Asp576Asn | p.D576N | Q9NTJ5 | protein_coding | deleterious(0.04) | benign(0.089) | TCGA-NH-A5IV-01 | Colorectum | colon adenocarcinoma | Female | >=65 | I/II | Unknown | Unknown | SD | |
| SACM1L | SNV | Missense_Mutation | novel | c.142N>T | p.Val48Phe | p.V48F | Q9NTJ5 | protein_coding | deleterious(0.01) | benign(0.005) | TCGA-AG-A00Y-01 | Colorectum | rectum adenocarcinoma | Male | >=65 | I/II | Unknown | Unknown | PD |
| SACM1L | deletion | Frame_Shift_Del | c.1033delN | p.Asn346IlefsTer2 | p.N346Ifs*2 | Q9NTJ5 | protein_coding | TCGA-A6-2686-01 | Colorectum | colon adenocarcinoma | Female | >=65 | I/II | Unknown | Unknown | SD | |||
| SACM1L | SNV | Missense_Mutation | novel | c.1481N>A | p.Ser494Tyr | p.S494Y | Q9NTJ5 | protein_coding | deleterious(0) | possibly_damaging(0.67) | TCGA-A5-A0G2-01 | Endometrium | uterine corpus endometrioid carcinoma | Female | <65 | III/IV | Unknown | Unknown | SD |
| SACM1L | SNV | Missense_Mutation | novel | c.1719N>G | p.Asp573Glu | p.D573E | Q9NTJ5 | protein_coding | tolerated(1) | benign(0.003) | TCGA-AP-A1DV-01 | Endometrium | uterine corpus endometrioid carcinoma | Female | <65 | I/II | Unknown | Unknown | SD |
| SACM1L | SNV | Missense_Mutation | novel | c.61N>A | p.Glu21Lys | p.E21K | Q9NTJ5 | protein_coding | deleterious(0.01) | possibly_damaging(0.688) | TCGA-B5-A1MR-01 | Endometrium | uterine corpus endometrioid carcinoma | Female | >=65 | III/IV | Unknown | Unknown | SD |
| SACM1L | SNV | Missense_Mutation | rs780924690 | c.689N>T | p.Ser230Leu | p.S230L | Q9NTJ5 | protein_coding | tolerated(0.23) | benign(0.07) | TCGA-B5-A1MR-01 | Endometrium | uterine corpus endometrioid carcinoma | Female | >=65 | III/IV | Unknown | Unknown | SD |
| SACM1L | SNV | Missense_Mutation | novel | c.1300N>G | p.Tyr434Asp | p.Y434D | Q9NTJ5 | protein_coding | deleterious(0) | possibly_damaging(0.781) | TCGA-B5-A1MR-01 | Endometrium | uterine corpus endometrioid carcinoma | Female | >=65 | III/IV | Unknown | Unknown | SD |
| SACM1L | SNV | Missense_Mutation | novel | c.1124G>A | p.Gly375Asp | p.G375D | Q9NTJ5 | protein_coding | deleterious(0.01) | benign(0.41) | TCGA-B5-A1MX-01 | Endometrium | uterine corpus endometrioid carcinoma | Female | <65 | I/II | Hormone Therapy | megace | SD |
| Page: 1 2 3 4 |
Top |
Related drugs of malignant transformation related genes |
| Identification of chemicals and drugs interact with genes involved in malignant transfromation |
| (DGIdb 4.0) |
| Entrez ID | Symbol | Category | Interaction Types | Drug Claim Name | Drug Name | PMIDs |
| 22908 | SACM1L | NA | bupropion | BUPROPION | 22041458 |
| Page: 1 |

Copyright 2023-Present -The University of Texas Health Science Center at Houston |