
|
|||||
|
 | |
| |
| |
| |
| |
| |
|
Gene: SAAL1 |
Gene summary for SAAL1 |
| Gene information | Species | Human | Gene symbol | SAAL1 | Gene ID | 113174 |
| Gene name | serum amyloid A like 1 | |
| Gene Alias | SPACIA1 | |
| Cytomap | 11p15.1 | |
| Gene Type | protein-coding | GO ID | GO:0002941 | UniProtAcc | G1UCX3 |
Top |
Malignant transformation analysis |
| Identification of the aberrant gene expression in precancerous and cancerous lesions by comparing the gene expression of stem-like cells in diseased tissues with normal stem cells |
| Entrez ID | Symbol | Replicates | Species | Organ | Tissue | Adj P-value | Log2FC | Malignancy |
| 113174 | SAAL1 | LZE2T | Human | Esophagus | ESCC | 3.78e-04 | 4.29e-01 | 0.082 |
| 113174 | SAAL1 | LZE4T | Human | Esophagus | ESCC | 2.78e-07 | 2.05e-01 | 0.0811 |
| 113174 | SAAL1 | LZE7T | Human | Esophagus | ESCC | 5.86e-05 | 2.81e-01 | 0.0667 |
| 113174 | SAAL1 | LZE24T | Human | Esophagus | ESCC | 5.76e-06 | 1.96e-01 | 0.0596 |
| 113174 | SAAL1 | LZE21T | Human | Esophagus | ESCC | 1.21e-02 | 1.70e-01 | 0.0655 |
| 113174 | SAAL1 | P2T-E | Human | Esophagus | ESCC | 4.75e-16 | 2.05e-01 | 0.1177 |
| 113174 | SAAL1 | P4T-E | Human | Esophagus | ESCC | 2.55e-10 | 2.55e-01 | 0.1323 |
| 113174 | SAAL1 | P5T-E | Human | Esophagus | ESCC | 4.44e-08 | 1.39e-01 | 0.1327 |
| 113174 | SAAL1 | P8T-E | Human | Esophagus | ESCC | 5.79e-16 | 2.27e-01 | 0.0889 |
| 113174 | SAAL1 | P9T-E | Human | Esophagus | ESCC | 4.32e-06 | 1.91e-01 | 0.1131 |
| 113174 | SAAL1 | P10T-E | Human | Esophagus | ESCC | 4.24e-18 | 2.95e-01 | 0.116 |
| 113174 | SAAL1 | P11T-E | Human | Esophagus | ESCC | 5.70e-07 | 2.72e-01 | 0.1426 |
| 113174 | SAAL1 | P12T-E | Human | Esophagus | ESCC | 1.47e-14 | 2.53e-01 | 0.1122 |
| 113174 | SAAL1 | P15T-E | Human | Esophagus | ESCC | 6.80e-15 | 2.84e-01 | 0.1149 |
| 113174 | SAAL1 | P16T-E | Human | Esophagus | ESCC | 1.62e-13 | 2.13e-01 | 0.1153 |
| 113174 | SAAL1 | P19T-E | Human | Esophagus | ESCC | 1.74e-03 | 2.78e-01 | 0.1662 |
| 113174 | SAAL1 | P20T-E | Human | Esophagus | ESCC | 8.64e-12 | 2.60e-01 | 0.1124 |
| 113174 | SAAL1 | P21T-E | Human | Esophagus | ESCC | 7.98e-13 | 2.38e-01 | 0.1617 |
| 113174 | SAAL1 | P22T-E | Human | Esophagus | ESCC | 5.95e-29 | 4.48e-01 | 0.1236 |
| 113174 | SAAL1 | P23T-E | Human | Esophagus | ESCC | 8.69e-03 | 1.27e-01 | 0.108 |
| Page: 1 2 3 4 |
| Tissue | Expression Dynamics | Abbreviation |
| Esophagus | 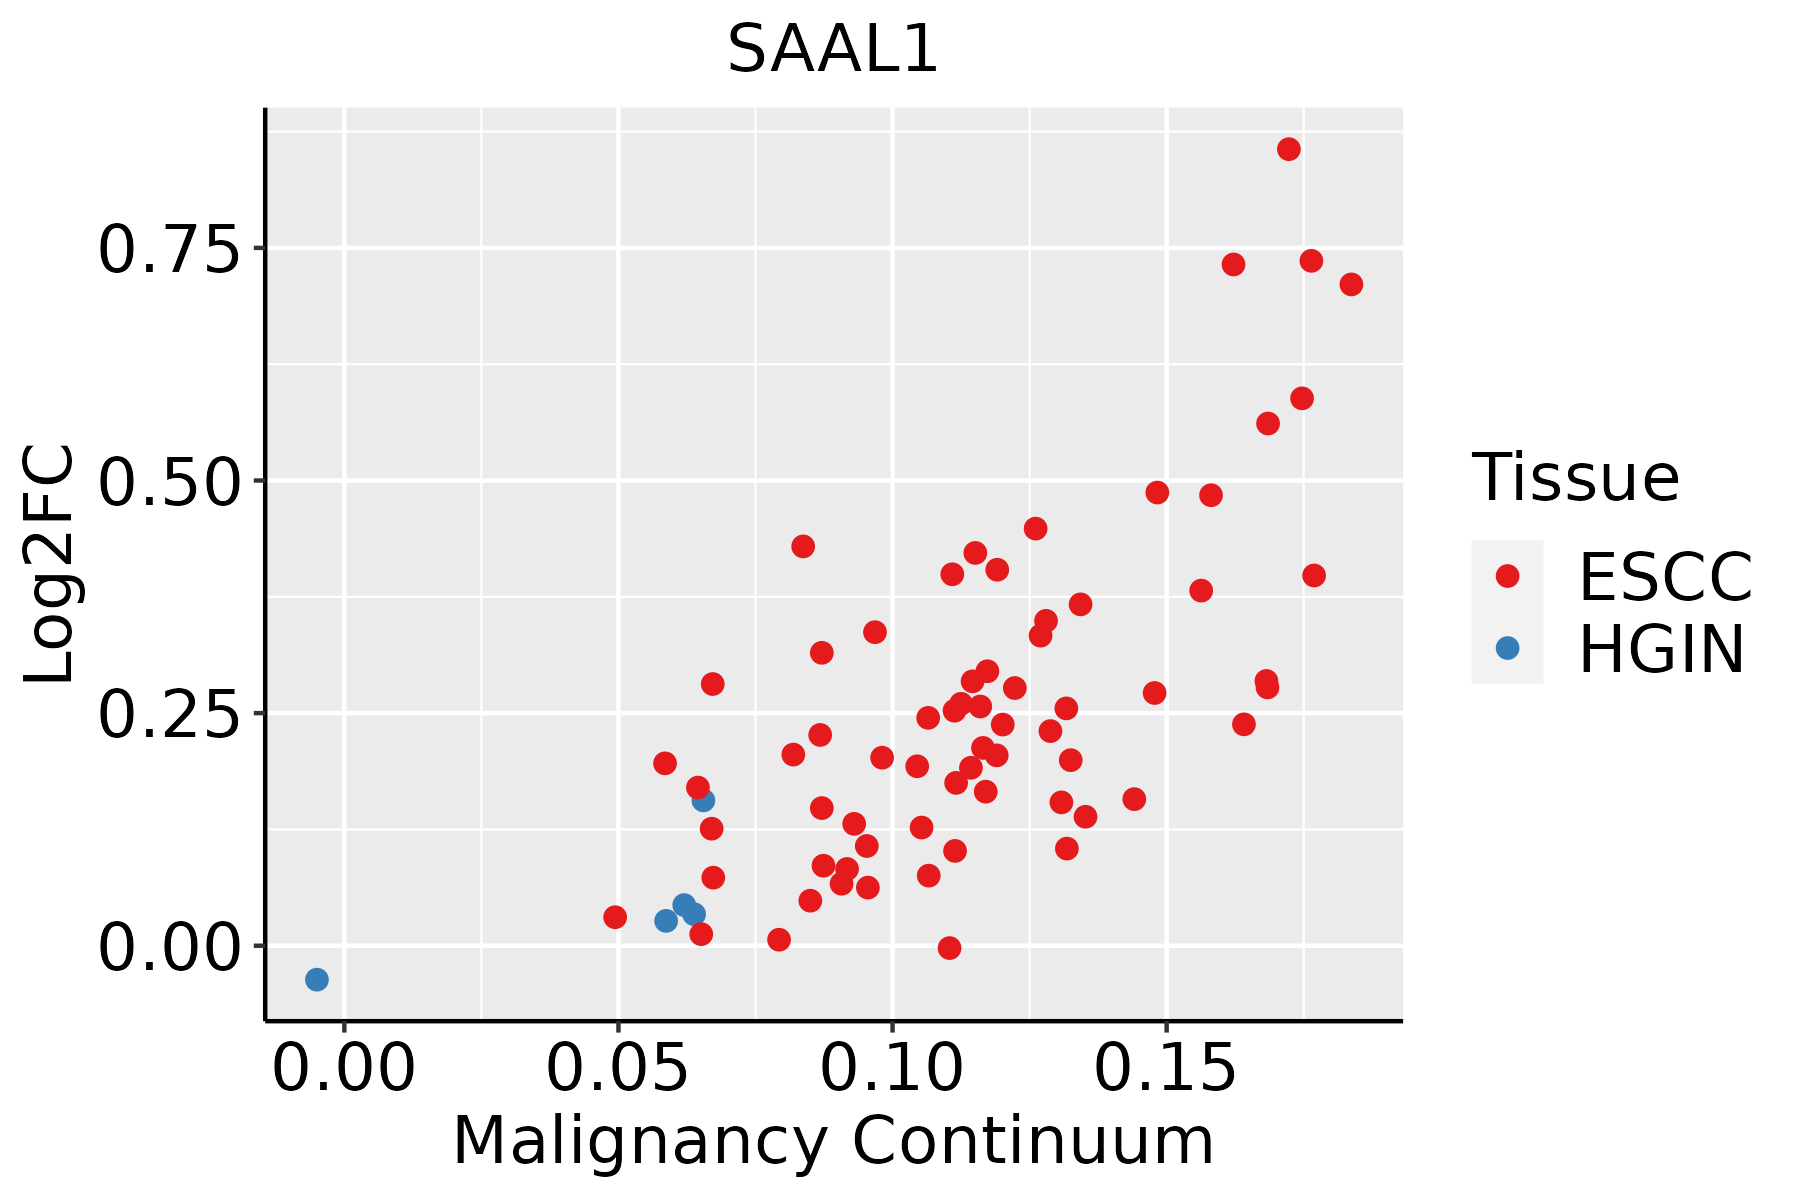 | ESCC: Esophageal squamous cell carcinoma |
| HGIN: High-grade intraepithelial neoplasias | ||
| LGIN: Low-grade intraepithelial neoplasias | ||
| Oral Cavity |  | EOLP: Erosive Oral lichen planus |
| LP: leukoplakia | ||
| NEOLP: Non-erosive oral lichen planus | ||
| OSCC: Oral squamous cell carcinoma | ||
| Skin | 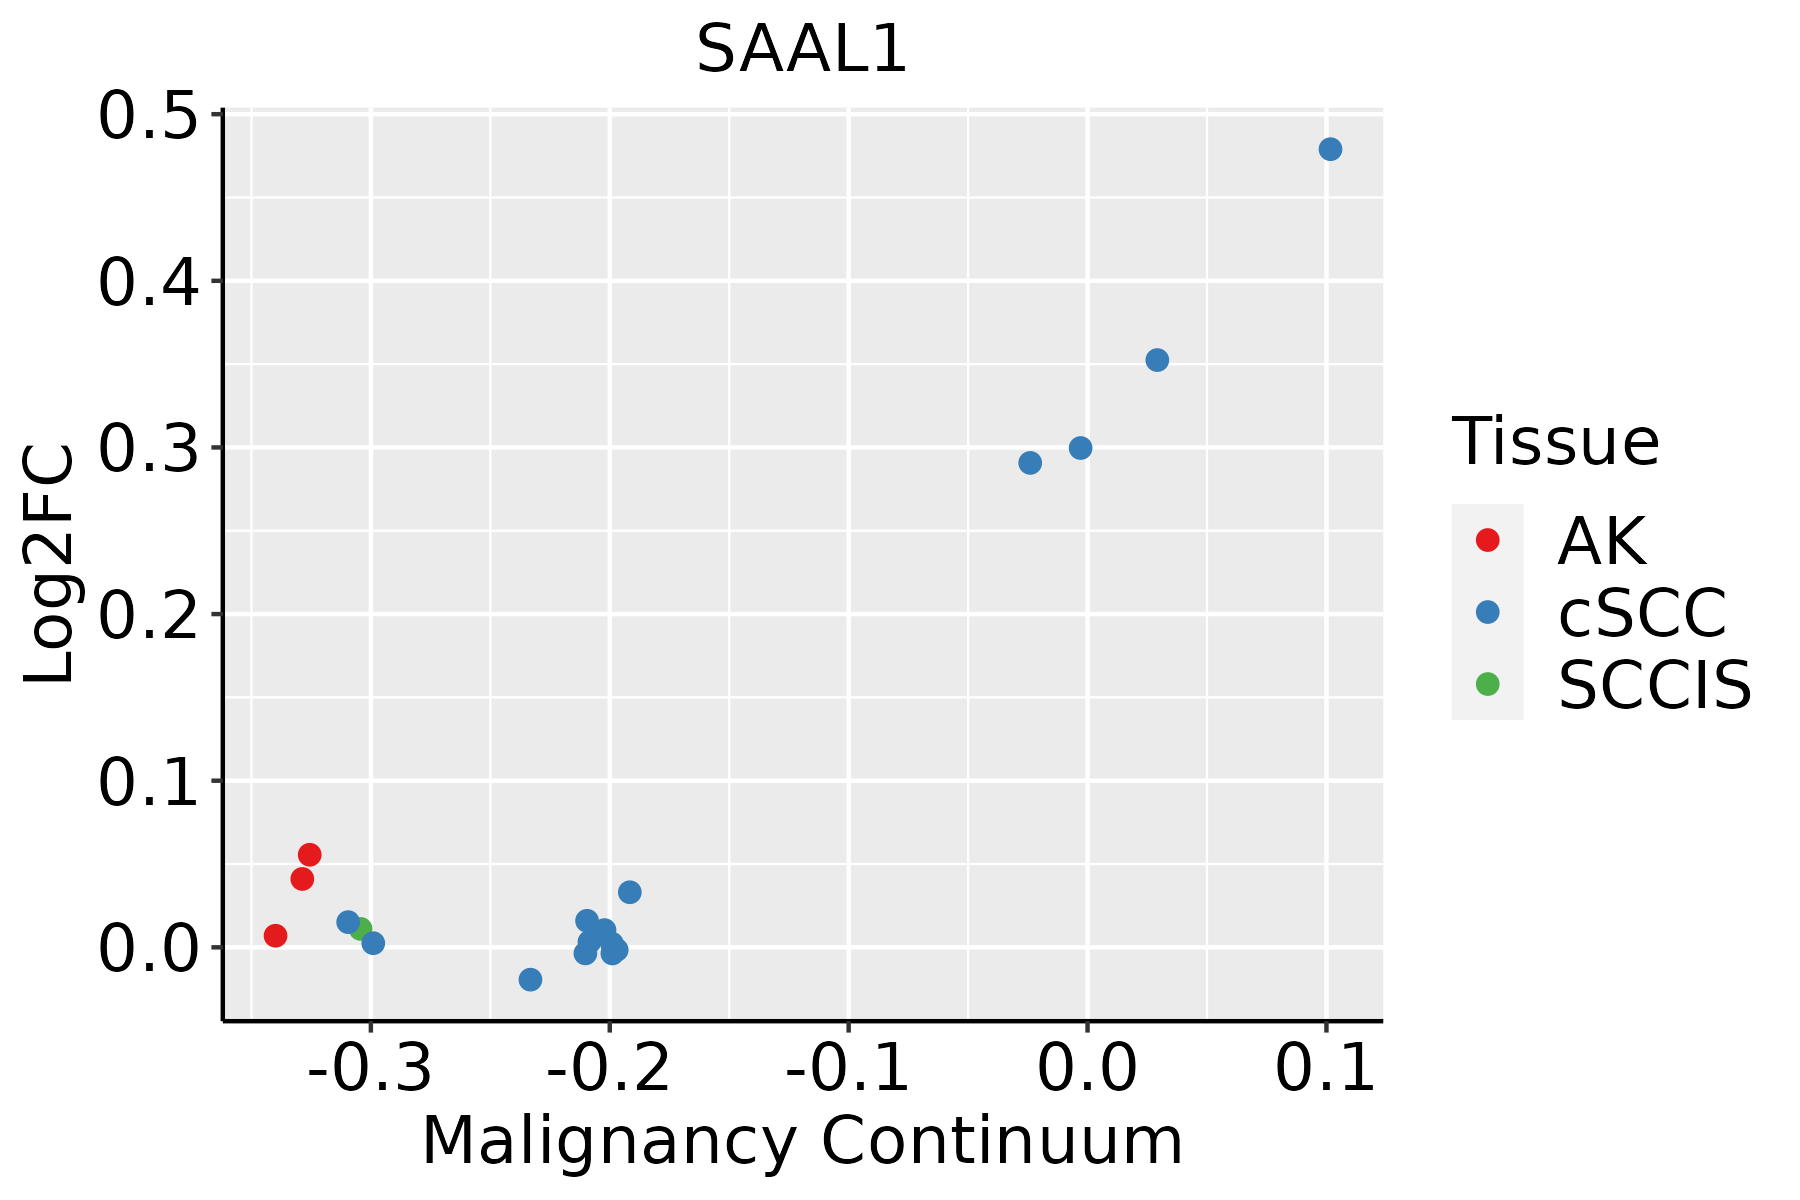 | AK: Actinic keratosis |
| cSCC: Cutaneous squamous cell carcinoma | ||
| SCCIS:squamous cell carcinoma in situ |
| ∗log2FC in expression of this searched gene in stem-like cells from each diseased tissue sample relative to stem-like cells in normal samples in each tissue plotted against the malignancy continuum. Samples are colored based on if they are from different disease stage. |
Top |
Malignant transformation related pathway analysis |
| Find out the enriched GO biological processes and KEGG pathways involved in transition from healthy to precancer to cancer |
| Tissue | Disease Stage | Enriched GO biological Processes |
| Colorectum | AD |  |
| Colorectum | SER |  |
| Colorectum | MSS |  |
| Colorectum | MSI-H |  |
| Colorectum | FAP |  |
| ∗Top 15 enriched GO BP terms are showed in the bar plot of each disease state in each tissue. Each row represents a significant GO biological process which is colored according to the -log10(p.adjust). |
| Page: 1 2 3 4 5 6 7 8 9 |
| GO ID | Tissue | Disease Stage | Description | Gene Ratio | Bg Ratio | pvalue | p.adjust | Count |
| Page: 1 |
| Pathway ID | Tissue | Disease Stage | Description | Gene Ratio | Bg Ratio | pvalue | p.adjust | qvalue | Count |
| Page: 1 |
Top |
Cell-cell communication analysis |
| Identification of potential cell-cell interactions between two cell types and their ligand-receptor pairs for different disease states |
| Ligand | Receptor | LRpair | Pathway | Tissue | Disease Stage |
| Page: 1 |
Top |
Single-cell gene regulatory network inference analysis |
| Find out the significant the regulons (TFs) and the target genes of each regulon across cell types for different disease states |
| TF | Cell Type | Tissue | Disease Stage | Target Gene | RSS | Regulon Activity |
| ∗The dot plots of a searched regulon are shown for all cell subpopulations in each disease state of each tissue based on the regulon specific score inferred using pySCENIC and by calculating the average expression. |
| Page: 1 |
Top |
Somatic mutation of malignant transformation related genes |
| Annotation of somatic variants for genes involved in malignant transformation |
| Hugo Symbol | Variant Class | Variant Classification | dbSNP RS | HGVSc | HGVSp | HGVSp Short | SWISSPROT | BIOTYPE | SIFT | PolyPhen | Tumor Sample Barcode | Tissue | Histology | Sex | Age | Stage | Therapy Types | Drugs | Outcome |
| SAAL1 | SNV | Missense_Mutation | novel | c.457N>G | p.Leu153Val | p.L153V | Q96ER3 | protein_coding | tolerated(0.06) | probably_damaging(0.945) | TCGA-EW-A1IX-01 | Breast | breast invasive carcinoma | Female | <65 | I/II | Hormone Therapy | femara | SD |
| SAAL1 | SNV | Missense_Mutation | c.1244N>T | p.Thr415Met | p.T415M | Q96ER3 | protein_coding | tolerated(0.07) | benign(0.293) | TCGA-2W-A8YY-01 | Cervix | cervical & endocervical cancer | Female | <65 | I/II | Chemotherapy | cisplatin | CR | |
| SAAL1 | SNV | Missense_Mutation | c.631N>A | p.Phe211Ile | p.F211I | Q96ER3 | protein_coding | deleterious(0.01) | probably_damaging(0.929) | TCGA-A6-2675-01 | Colorectum | colon adenocarcinoma | Male | >=65 | I/II | Unknown | Unknown | SD | |
| SAAL1 | SNV | Missense_Mutation | rs773896131 | c.185T>C | p.Leu62Pro | p.L62P | Q96ER3 | protein_coding | tolerated(0.33) | benign(0) | TCGA-AA-3811-01 | Colorectum | colon adenocarcinoma | Female | >=65 | III/IV | Unknown | Unknown | PD |
| SAAL1 | SNV | Missense_Mutation | c.1210N>A | p.Leu404Ile | p.L404I | Q96ER3 | protein_coding | deleterious(0.01) | probably_damaging(0.991) | TCGA-AA-A010-01 | Colorectum | colon adenocarcinoma | Female | <65 | I/II | Chemotherapy | folinic | CR | |
| SAAL1 | SNV | Missense_Mutation | c.626N>C | p.Lys209Thr | p.K209T | Q96ER3 | protein_coding | tolerated(0.11) | possibly_damaging(0.844) | TCGA-AA-A010-01 | Colorectum | colon adenocarcinoma | Female | <65 | I/II | Chemotherapy | folinic | CR | |
| SAAL1 | SNV | Missense_Mutation | c.663G>T | p.Trp221Cys | p.W221C | Q96ER3 | protein_coding | deleterious(0) | probably_damaging(0.964) | TCGA-DM-A1D8-01 | Colorectum | colon adenocarcinoma | Female | <65 | III/IV | Unknown | Unknown | SD | |
| SAAL1 | SNV | Missense_Mutation | novel | c.1083N>C | p.Gln361His | p.Q361H | Q96ER3 | protein_coding | deleterious(0.03) | benign(0.003) | TCGA-AG-A002-01 | Colorectum | rectum adenocarcinoma | Male | <65 | I/II | Unknown | Unknown | SD |
| SAAL1 | SNV | Missense_Mutation | rs770283861 | c.326G>A | p.Arg109Gln | p.R109Q | Q96ER3 | protein_coding | deleterious(0) | probably_damaging(0.997) | TCGA-EI-6917-01 | Colorectum | rectum adenocarcinoma | Male | <65 | III/IV | Chemotherapy | 5fluorouracil+oxaciplatina+l-folinian | SD |
| SAAL1 | insertion | Frame_Shift_Ins | rs768235249 | c.982_983insT | p.Ser328PhefsTer12 | p.S328Ffs*12 | Q96ER3 | protein_coding | TCGA-D5-6923-01 | Colorectum | colon adenocarcinoma | Male | <65 | I/II | Unknown | Unknown | SD |
| Page: 1 2 3 4 5 |
Top |
Related drugs of malignant transformation related genes |
| Identification of chemicals and drugs interact with genes involved in malignant transfromation |
| (DGIdb 4.0) |
| Entrez ID | Symbol | Category | Interaction Types | Drug Claim Name | Drug Name | PMIDs |
| Page: 1 |

Copyright 2023-Present -The University of Texas Health Science Center at Houston |