
|
|||||
|
 | |
| |
| |
| |
| |
| |
|
Gene: SAA2 |
Gene summary for SAA2 |
| Gene information | Species | Human | Gene symbol | SAA2 | Gene ID | 6289 |
| Gene name | serum amyloid A2 | |
| Gene Alias | SAA | |
| Cytomap | 11p15.1 | |
| Gene Type | protein-coding | GO ID | GO:0002526 | UniProtAcc | P0DJI9 |
Top |
Malignant transformation analysis |
| Identification of the aberrant gene expression in precancerous and cancerous lesions by comparing the gene expression of stem-like cells in diseased tissues with normal stem cells |
| Entrez ID | Symbol | Replicates | Species | Organ | Tissue | Adj P-value | Log2FC | Malignancy |
| 6289 | SAA2 | GSM4909281 | Human | Breast | IDC | 8.69e-21 | -6.74e-01 | 0.21 |
| 6289 | SAA2 | GSM4909285 | Human | Breast | IDC | 9.45e-22 | -6.88e-01 | 0.21 |
| 6289 | SAA2 | GSM4909286 | Human | Breast | IDC | 1.19e-30 | -7.25e-01 | 0.1081 |
| 6289 | SAA2 | GSM4909287 | Human | Breast | IDC | 5.72e-08 | -5.17e-01 | 0.2057 |
| 6289 | SAA2 | GSM4909290 | Human | Breast | IDC | 1.36e-17 | -7.08e-01 | 0.2096 |
| 6289 | SAA2 | GSM4909291 | Human | Breast | IDC | 6.75e-18 | -7.25e-01 | 0.1753 |
| 6289 | SAA2 | GSM4909292 | Human | Breast | IDC | 7.22e-03 | -7.25e-01 | 0.1236 |
| 6289 | SAA2 | GSM4909293 | Human | Breast | IDC | 5.54e-11 | -5.55e-01 | 0.1581 |
| 6289 | SAA2 | GSM4909294 | Human | Breast | IDC | 1.10e-20 | -6.62e-01 | 0.2022 |
| 6289 | SAA2 | GSM4909296 | Human | Breast | IDC | 4.31e-15 | -6.15e-01 | 0.1524 |
| 6289 | SAA2 | GSM4909297 | Human | Breast | IDC | 9.50e-20 | -6.51e-01 | 0.1517 |
| 6289 | SAA2 | GSM4909298 | Human | Breast | IDC | 1.13e-19 | -6.81e-01 | 0.1551 |
| 6289 | SAA2 | GSM4909300 | Human | Breast | IDC | 2.03e-10 | 8.39e-01 | 0.0334 |
| 6289 | SAA2 | GSM4909301 | Human | Breast | IDC | 1.12e-26 | -7.02e-01 | 0.1577 |
| 6289 | SAA2 | GSM4909302 | Human | Breast | IDC | 2.45e-22 | -6.90e-01 | 0.1545 |
| 6289 | SAA2 | GSM4909303 | Human | Breast | IDC | 2.58e-06 | -6.72e-01 | 0.0438 |
| 6289 | SAA2 | GSM4909304 | Human | Breast | IDC | 1.91e-31 | -7.22e-01 | 0.1636 |
| 6289 | SAA2 | GSM4909305 | Human | Breast | IDC | 2.41e-03 | -4.73e-01 | 0.0436 |
| 6289 | SAA2 | GSM4909306 | Human | Breast | IDC | 3.12e-18 | -6.68e-01 | 0.1564 |
| 6289 | SAA2 | GSM4909307 | Human | Breast | IDC | 1.35e-10 | -5.45e-01 | 0.1569 |
| Page: 1 2 3 4 5 |
| Tissue | Expression Dynamics | Abbreviation |
| Breast | 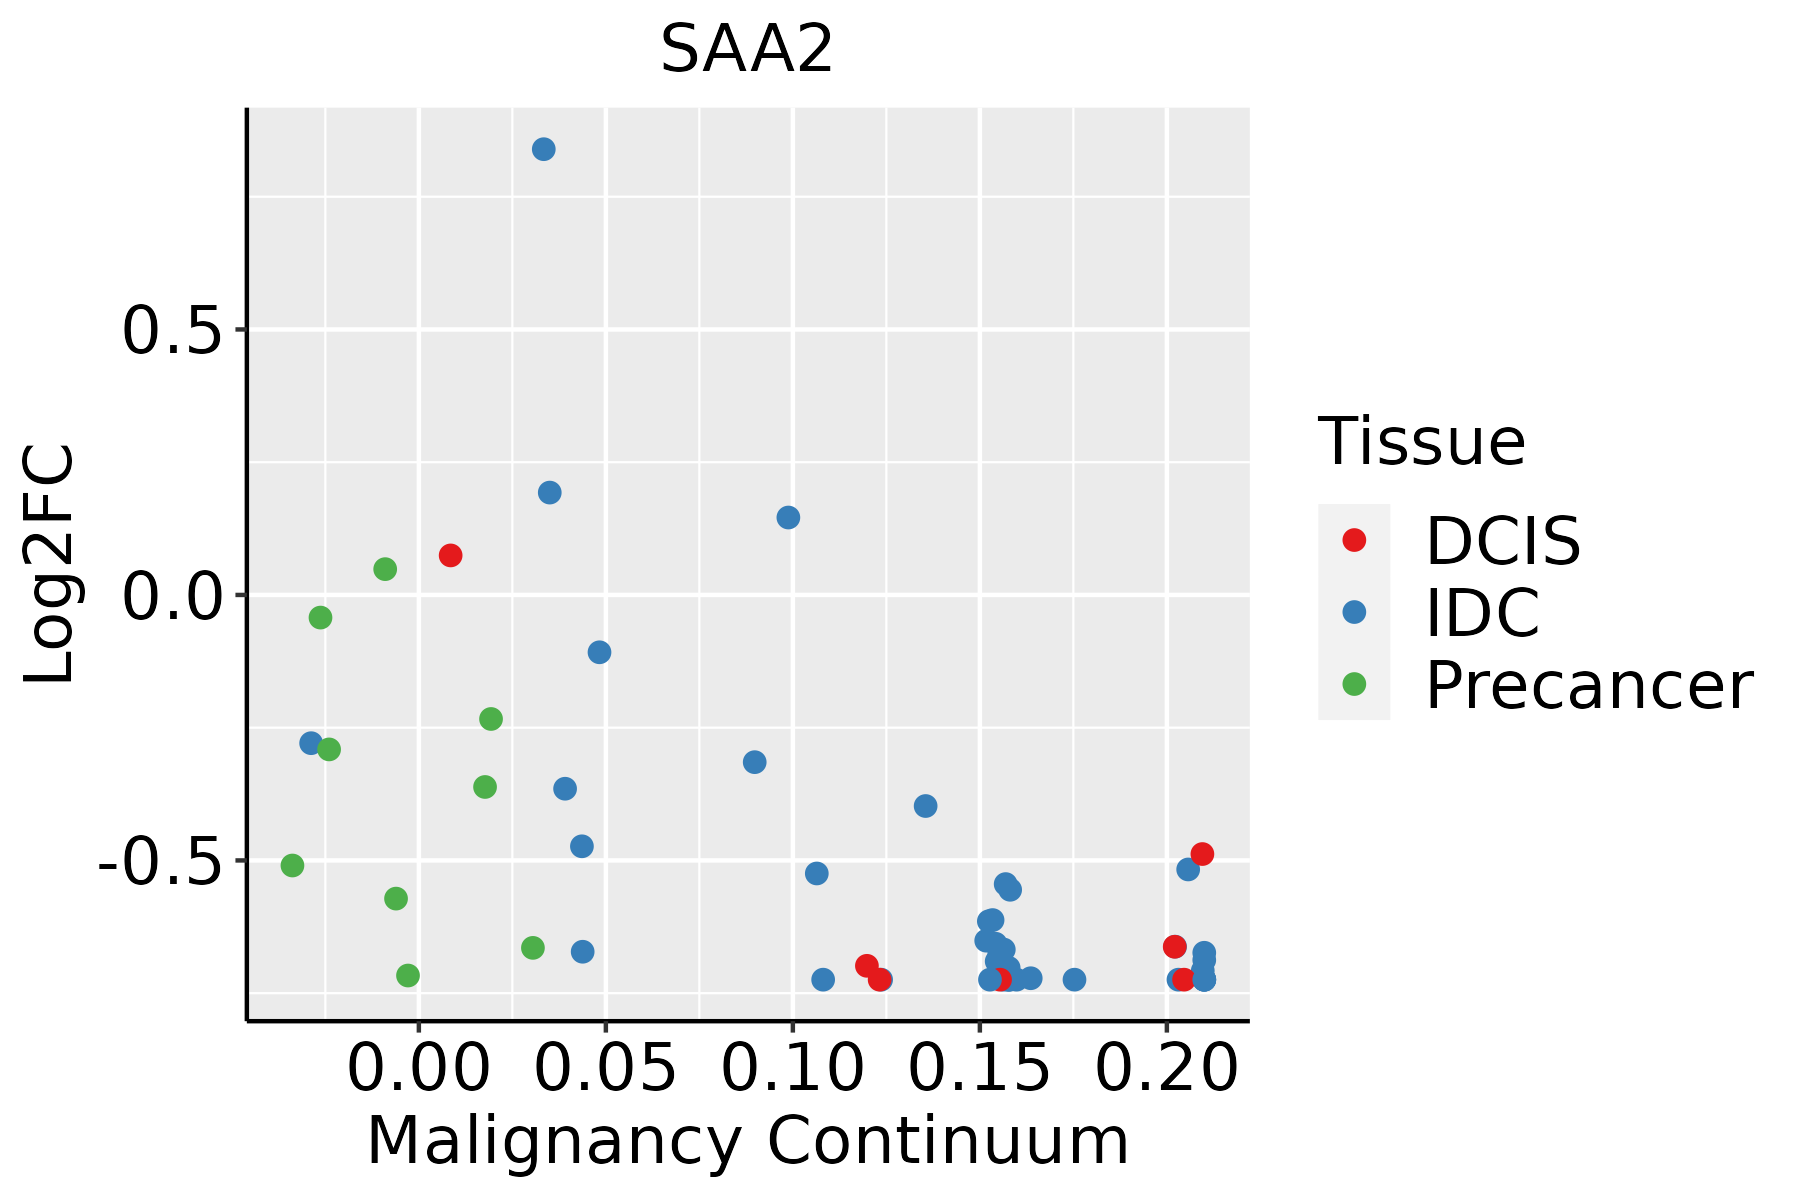 | IDC: Invasive ductal carcinoma |
| DCIS: Ductal carcinoma in situ | ||
| Precancer(BRCA1-mut): Precancerous lesion from BRCA1 mutation carriers | ||
| Cervix | 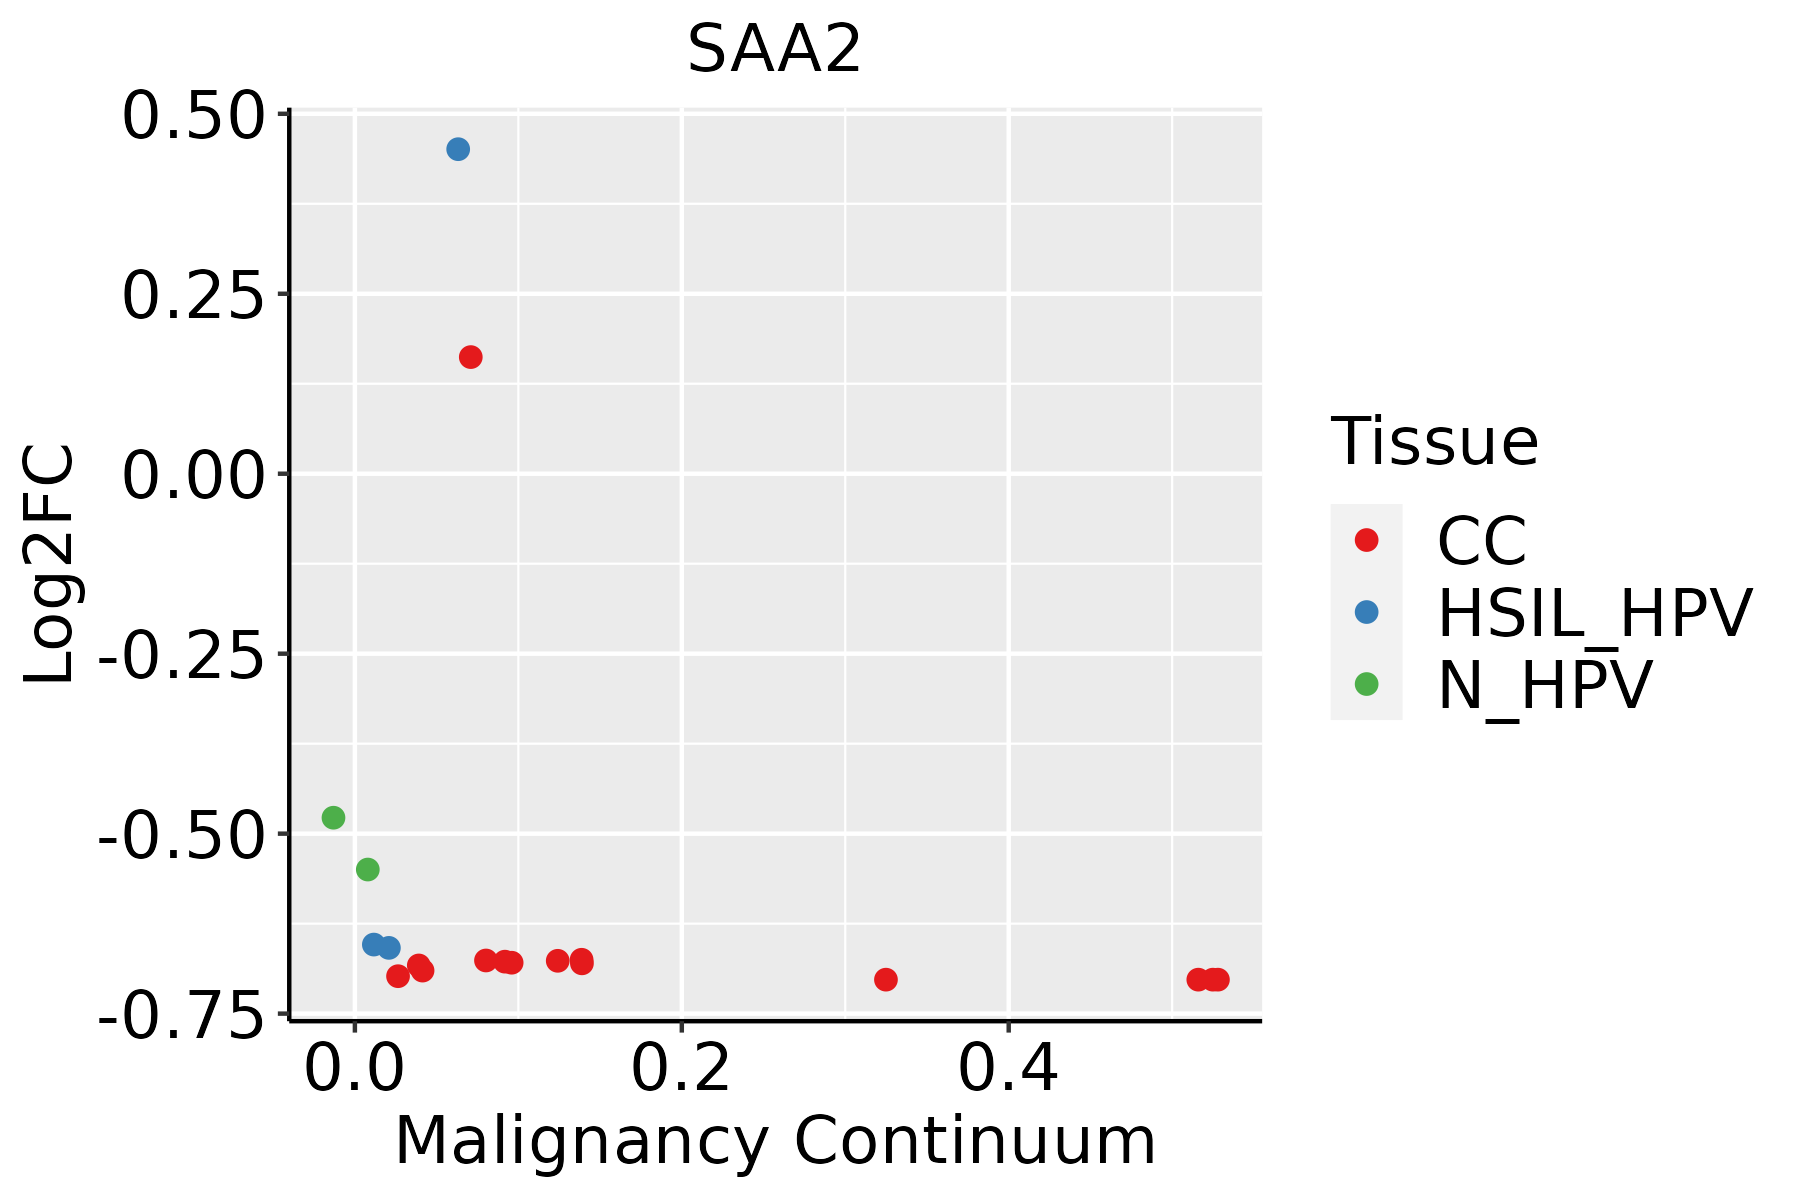 | CC: Cervix cancer |
| HSIL_HPV: HPV-infected high-grade squamous intraepithelial lesions | ||
| N_HPV: HPV-infected normal cervix | ||
| Endometrium | 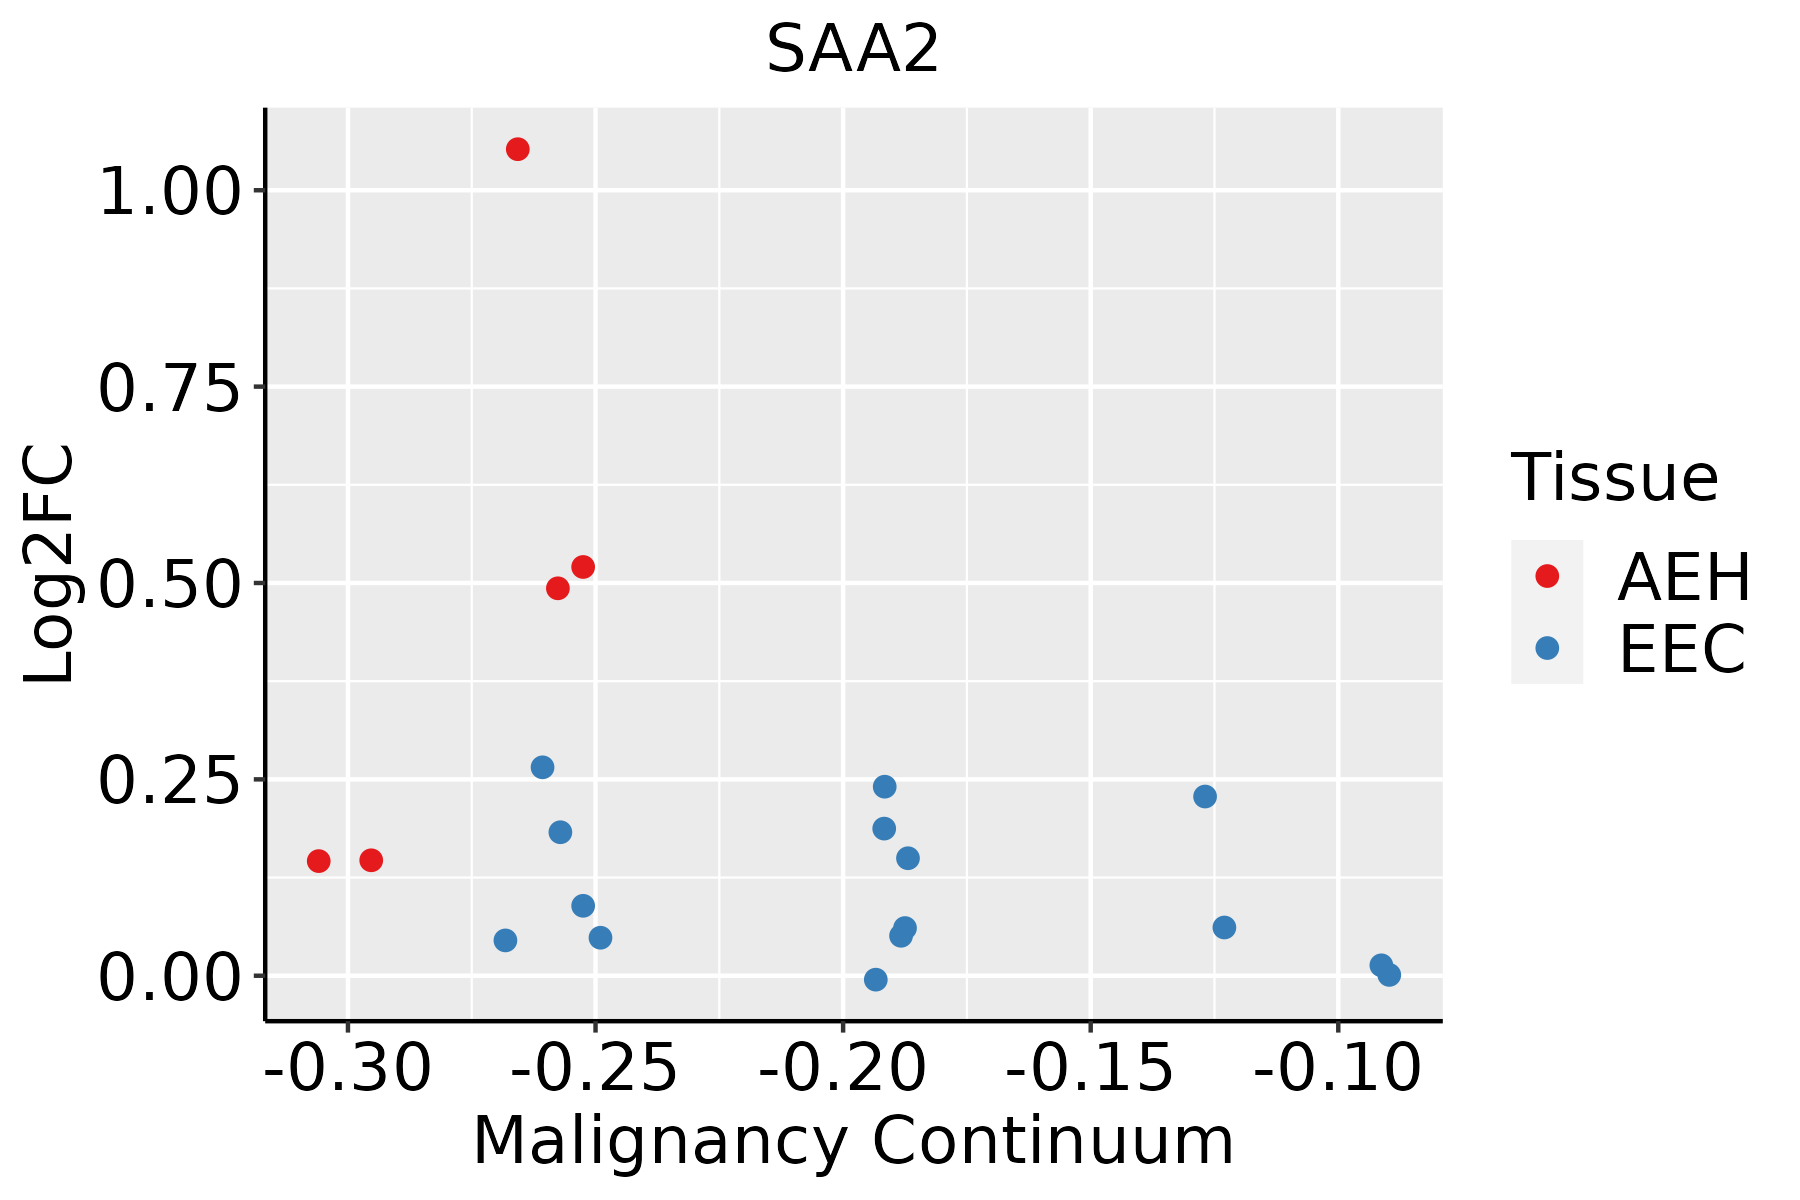 | AEH: Atypical endometrial hyperplasia |
| EEC: Endometrioid Cancer | ||
| Esophagus |  | ESCC: Esophageal squamous cell carcinoma |
| HGIN: High-grade intraepithelial neoplasias | ||
| LGIN: Low-grade intraepithelial neoplasias | ||
| Lung | 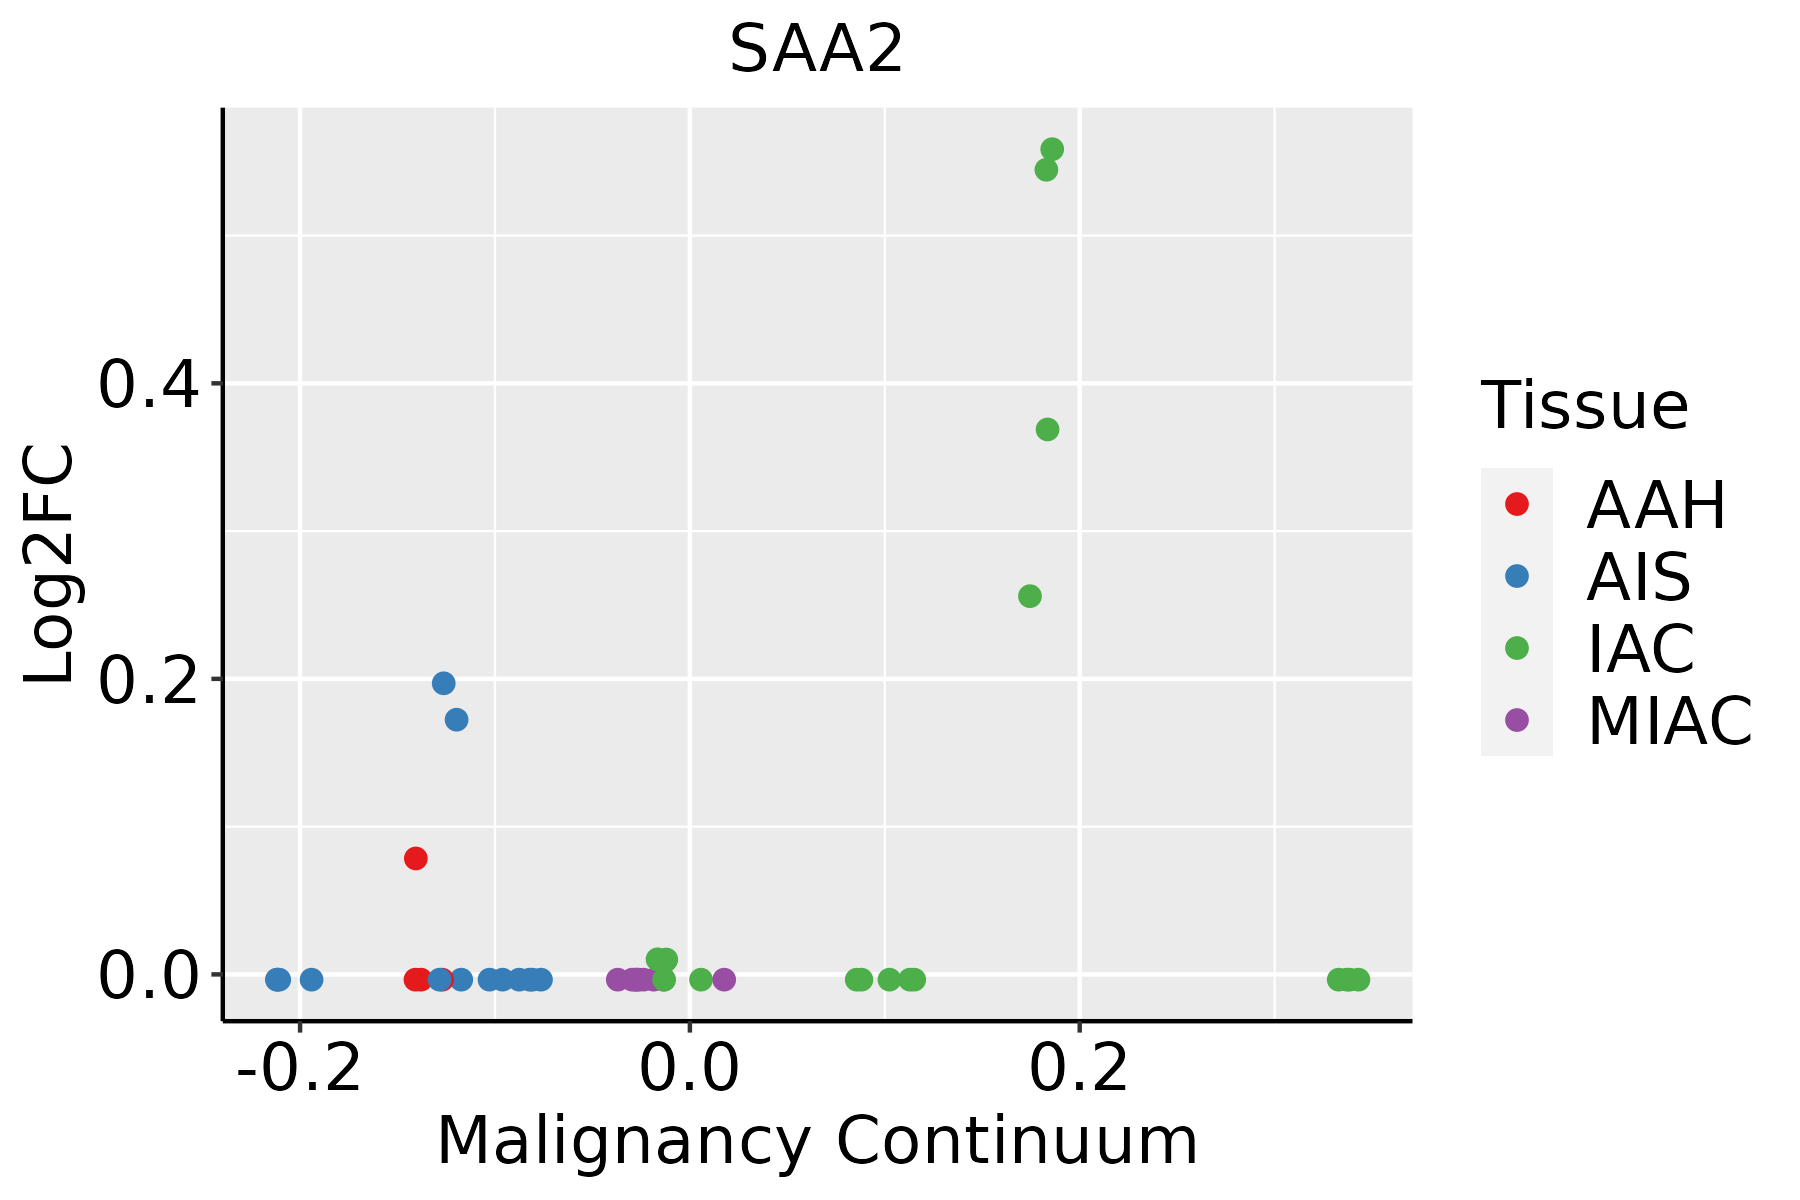 | AAH: Atypical adenomatous hyperplasia |
| AIS: Adenocarcinoma in situ | ||
| IAC: Invasive lung adenocarcinoma | ||
| MIA: Minimally invasive adenocarcinoma | ||
| Oral Cavity |  | EOLP: Erosive Oral lichen planus |
| LP: leukoplakia | ||
| NEOLP: Non-erosive oral lichen planus | ||
| OSCC: Oral squamous cell carcinoma | ||
| Thyroid | 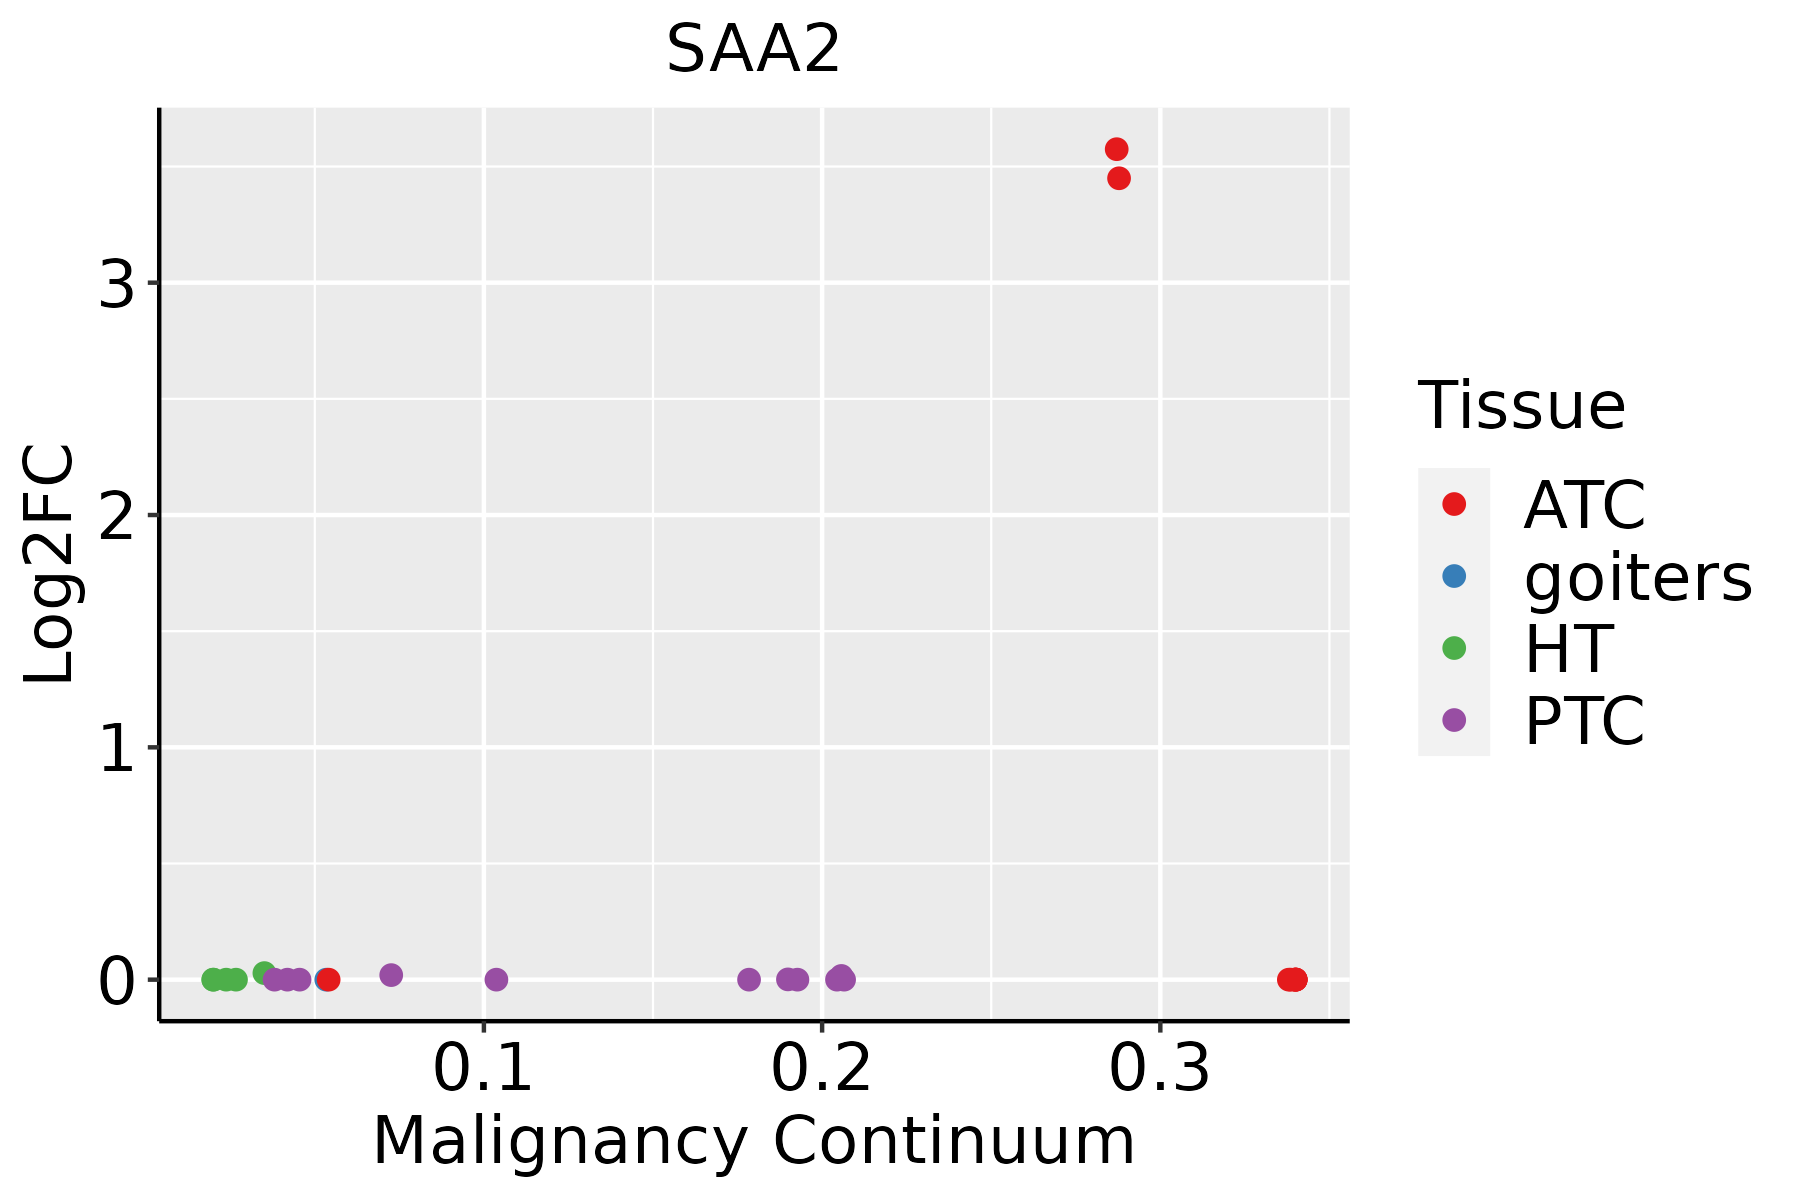 | ATC: Anaplastic thyroid cancer |
| HT: Hashimoto's thyroiditis | ||
| PTC: Papillary thyroid cancer |
| ∗log2FC in expression of this searched gene in stem-like cells from each diseased tissue sample relative to stem-like cells in normal samples in each tissue plotted against the malignancy continuum. Samples are colored based on if they are from different disease stage. |
Top |
Malignant transformation related pathway analysis |
| Find out the enriched GO biological processes and KEGG pathways involved in transition from healthy to precancer to cancer |
| Tissue | Disease Stage | Enriched GO biological Processes |
| Colorectum | AD |  |
| Colorectum | SER |  |
| Colorectum | MSS |  |
| Colorectum | MSI-H |  |
| Colorectum | FAP |  |
| ∗Top 15 enriched GO BP terms are showed in the bar plot of each disease state in each tissue. Each row represents a significant GO biological process which is colored according to the -log10(p.adjust). |
| Page: 1 2 3 4 5 6 7 8 9 |
| GO ID | Tissue | Disease Stage | Description | Gene Ratio | Bg Ratio | pvalue | p.adjust | Count |
| GO:00025263 | Breast | Precancer | acute inflammatory response | 16/1080 | 112/18723 | 6.87e-04 | 8.36e-03 | 16 |
| GO:000252611 | Breast | IDC | acute inflammatory response | 17/1434 | 112/18723 | 5.00e-03 | 3.77e-02 | 17 |
| GO:00025264 | Cervix | HSIL_HPV | acute inflammatory response | 12/737 | 112/18723 | 1.53e-03 | 1.68e-02 | 12 |
| GO:000252612 | Cervix | N_HPV | acute inflammatory response | 12/534 | 112/18723 | 8.49e-05 | 1.82e-03 | 12 |
| Page: 1 |
| Pathway ID | Tissue | Disease Stage | Description | Gene Ratio | Bg Ratio | pvalue | p.adjust | qvalue | Count |
| Page: 1 |
Top |
Cell-cell communication analysis |
| Identification of potential cell-cell interactions between two cell types and their ligand-receptor pairs for different disease states |
| Ligand | Receptor | LRpair | Pathway | Tissue | Disease Stage |
| Page: 1 |
Top |
Single-cell gene regulatory network inference analysis |
| Find out the significant the regulons (TFs) and the target genes of each regulon across cell types for different disease states |
| TF | Cell Type | Tissue | Disease Stage | Target Gene | RSS | Regulon Activity |
| ∗The dot plots of a searched regulon are shown for all cell subpopulations in each disease state of each tissue based on the regulon specific score inferred using pySCENIC and by calculating the average expression. |
| Page: 1 |
Top |
Somatic mutation of malignant transformation related genes |
| Annotation of somatic variants for genes involved in malignant transformation |
| Hugo Symbol | Variant Class | Variant Classification | dbSNP RS | HGVSc | HGVSp | HGVSp Short | SWISSPROT | BIOTYPE | SIFT | PolyPhen | Tumor Sample Barcode | Tissue | Histology | Sex | Age | Stage | Therapy Types | Drugs | Outcome |
| SAA2 | SNV | Missense_Mutation | rs140000828 | c.79N>A | p.Glu27Lys | p.E27K | P0DJI9 | protein_coding | deleterious(0) | possibly_damaging(0.903) | TCGA-C8-A12X-01 | Breast | breast invasive carcinoma | Female | <65 | I/II | Unknown | Unknown | SD |
| SAA2 | SNV | Missense_Mutation | rs766267295 | c.169N>T | p.Arg57Trp | p.R57W | P0DJI9 | protein_coding | tolerated(0.07) | benign(0.171) | TCGA-JX-A3Q8-01 | Cervix | cervical & endocervical cancer | Female | <65 | I/II | Unknown | Unknown | SD |
| SAA2 | SNV | Missense_Mutation | c.86T>G | p.Phe29Cys | p.F29C | P0DJI9 | protein_coding | tolerated(0.18) | benign(0.007) | TCGA-AG-A01Y-01 | Colorectum | rectum adenocarcinoma | Female | <65 | I/II | Chemotherapy | 5-fluorouracil | CR | |
| SAA2 | SNV | Missense_Mutation | c.137N>C | p.Asn46Thr | p.N46T | P0DJI9 | protein_coding | deleterious(0.03) | probably_damaging(0.915) | TCGA-EI-6508-01 | Colorectum | rectum adenocarcinoma | Female | <65 | III/IV | Chemotherapy | oxaliplatin | SD | |
| SAA2 | SNV | Missense_Mutation | novel | c.220G>A | p.Glu74Lys | p.E74K | P0DJI9 | protein_coding | tolerated(1) | benign(0.005) | TCGA-A5-A0G1-01 | Endometrium | uterine corpus endometrioid carcinoma | Female | >=65 | I/II | Unknown | Unknown | SD |
| SAA2 | SNV | Missense_Mutation | novel | c.160N>G | p.Phe54Val | p.F54V | P0DJI9 | protein_coding | deleterious(0) | probably_damaging(0.99) | TCGA-A5-A0G2-01 | Endometrium | uterine corpus endometrioid carcinoma | Female | <65 | III/IV | Unknown | Unknown | SD |
| SAA2 | SNV | Missense_Mutation | rs146160224 | c.214G>A | p.Ala72Thr | p.A72T | P0DJI9 | protein_coding | deleterious(0.02) | benign(0.351) | TCGA-AJ-A3EL-01 | Endometrium | uterine corpus endometrioid carcinoma | Female | <65 | I/II | Unknown | Unknown | SD |
| SAA2 | SNV | Missense_Mutation | novel | c.63N>A | p.Phe21Leu | p.F21L | P0DJI9 | protein_coding | tolerated(0.09) | benign(0) | TCGA-AP-A1DV-01 | Endometrium | uterine corpus endometrioid carcinoma | Female | <65 | I/II | Unknown | Unknown | SD |
| SAA2 | SNV | Missense_Mutation | rs765674488 | c.56G>A | p.Arg19Gln | p.R19Q | P0DJI9 | protein_coding | tolerated(1) | benign(0) | TCGA-QF-A5YS-01 | Endometrium | uterine corpus endometrioid carcinoma | Female | <65 | I/II | Chemotherapy | carboplatin | CR |
| SAA2 | SNV | Missense_Mutation | c.190A>G | p.Lys64Glu | p.K64E | P0DJI9 | protein_coding | tolerated(0.06) | benign(0.003) | TCGA-UB-A7MB-01 | Liver | liver hepatocellular carcinoma | Male | <65 | I/II | Targeted Molecular therapy | sorafenib | PD |
| Page: 1 2 |
Top |
Related drugs of malignant transformation related genes |
| Identification of chemicals and drugs interact with genes involved in malignant transfromation |
| (DGIdb 4.0) |
| Entrez ID | Symbol | Category | Interaction Types | Drug Claim Name | Drug Name | PMIDs |
| Page: 1 |

Copyright 2023-Present -The University of Texas Health Science Center at Houston |