
|
|||||
|
 | |
| |
| |
| |
| |
| |
|
Gene: SAA1 |
Gene summary for SAA1 |
| Gene information | Species | Human | Gene symbol | SAA1 | Gene ID | 6288 |
| Gene name | serum amyloid A1 | |
| Gene Alias | PIG4 | |
| Cytomap | 11p15.1 | |
| Gene Type | protein-coding | GO ID | GO:0001775 | UniProtAcc | P0DJI8 |
Top |
Malignant transformation analysis |
| Identification of the aberrant gene expression in precancerous and cancerous lesions by comparing the gene expression of stem-like cells in diseased tissues with normal stem cells |
| Entrez ID | Symbol | Replicates | Species | Organ | Tissue | Adj P-value | Log2FC | Malignancy |
| 6288 | SAA1 | GSM4909281 | Human | Breast | IDC | 6.54e-16 | -8.21e-01 | 0.21 |
| 6288 | SAA1 | GSM4909282 | Human | Breast | IDC | 9.61e-16 | 1.93e-01 | -0.0288 |
| 6288 | SAA1 | GSM4909285 | Human | Breast | IDC | 1.20e-35 | -1.13e+00 | 0.21 |
| 6288 | SAA1 | GSM4909286 | Human | Breast | IDC | 1.75e-49 | -1.23e+00 | 0.1081 |
| 6288 | SAA1 | GSM4909287 | Human | Breast | IDC | 3.75e-03 | -4.08e-01 | 0.2057 |
| 6288 | SAA1 | GSM4909289 | Human | Breast | IDC | 7.30e-03 | -8.25e-01 | 0.1064 |
| 6288 | SAA1 | GSM4909290 | Human | Breast | IDC | 1.04e-33 | -1.19e+00 | 0.2096 |
| 6288 | SAA1 | GSM4909291 | Human | Breast | IDC | 2.53e-34 | -1.23e+00 | 0.1753 |
| 6288 | SAA1 | GSM4909292 | Human | Breast | IDC | 5.11e-08 | -1.23e+00 | 0.1236 |
| 6288 | SAA1 | GSM4909293 | Human | Breast | IDC | 1.32e-24 | -9.02e-01 | 0.1581 |
| 6288 | SAA1 | GSM4909294 | Human | Breast | IDC | 8.00e-36 | -1.04e+00 | 0.2022 |
| 6288 | SAA1 | GSM4909296 | Human | Breast | IDC | 3.97e-24 | -9.89e-01 | 0.1524 |
| 6288 | SAA1 | GSM4909297 | Human | Breast | IDC | 1.28e-36 | -1.06e+00 | 0.1517 |
| 6288 | SAA1 | GSM4909298 | Human | Breast | IDC | 9.72e-32 | -1.08e+00 | 0.1551 |
| 6288 | SAA1 | GSM4909300 | Human | Breast | IDC | 1.29e-07 | 7.13e-01 | 0.0334 |
| 6288 | SAA1 | GSM4909301 | Human | Breast | IDC | 5.62e-49 | -1.21e+00 | 0.1577 |
| 6288 | SAA1 | GSM4909302 | Human | Breast | IDC | 3.69e-42 | -1.16e+00 | 0.1545 |
| 6288 | SAA1 | GSM4909303 | Human | Breast | IDC | 4.38e-07 | -9.10e-01 | 0.0438 |
| 6288 | SAA1 | GSM4909304 | Human | Breast | IDC | 7.54e-50 | -1.22e+00 | 0.1636 |
| 6288 | SAA1 | GSM4909305 | Human | Breast | IDC | 3.17e-04 | -5.14e-01 | 0.0436 |
| Page: 1 2 3 4 5 6 7 8 9 |
| Tissue | Expression Dynamics | Abbreviation |
| Breast | 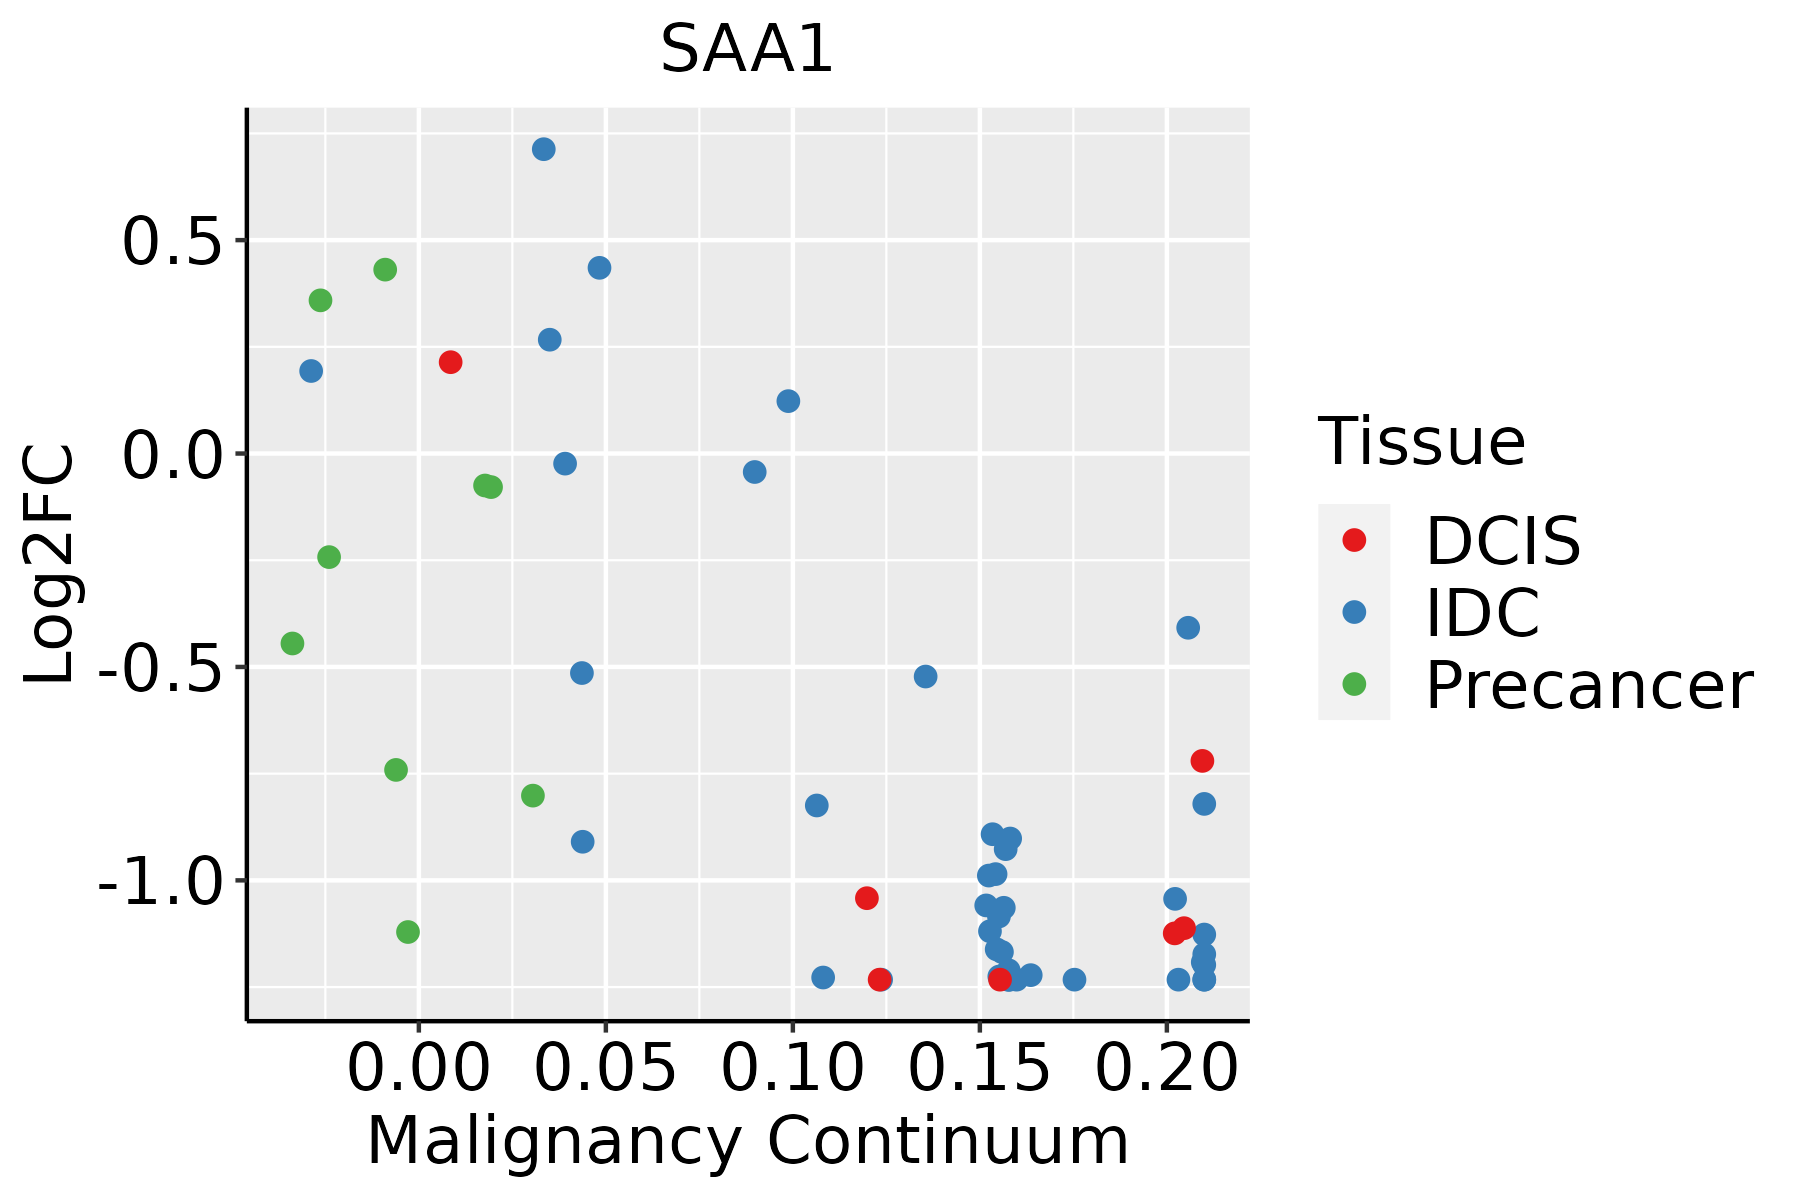 | IDC: Invasive ductal carcinoma |
| DCIS: Ductal carcinoma in situ | ||
| Precancer(BRCA1-mut): Precancerous lesion from BRCA1 mutation carriers | ||
| Cervix | 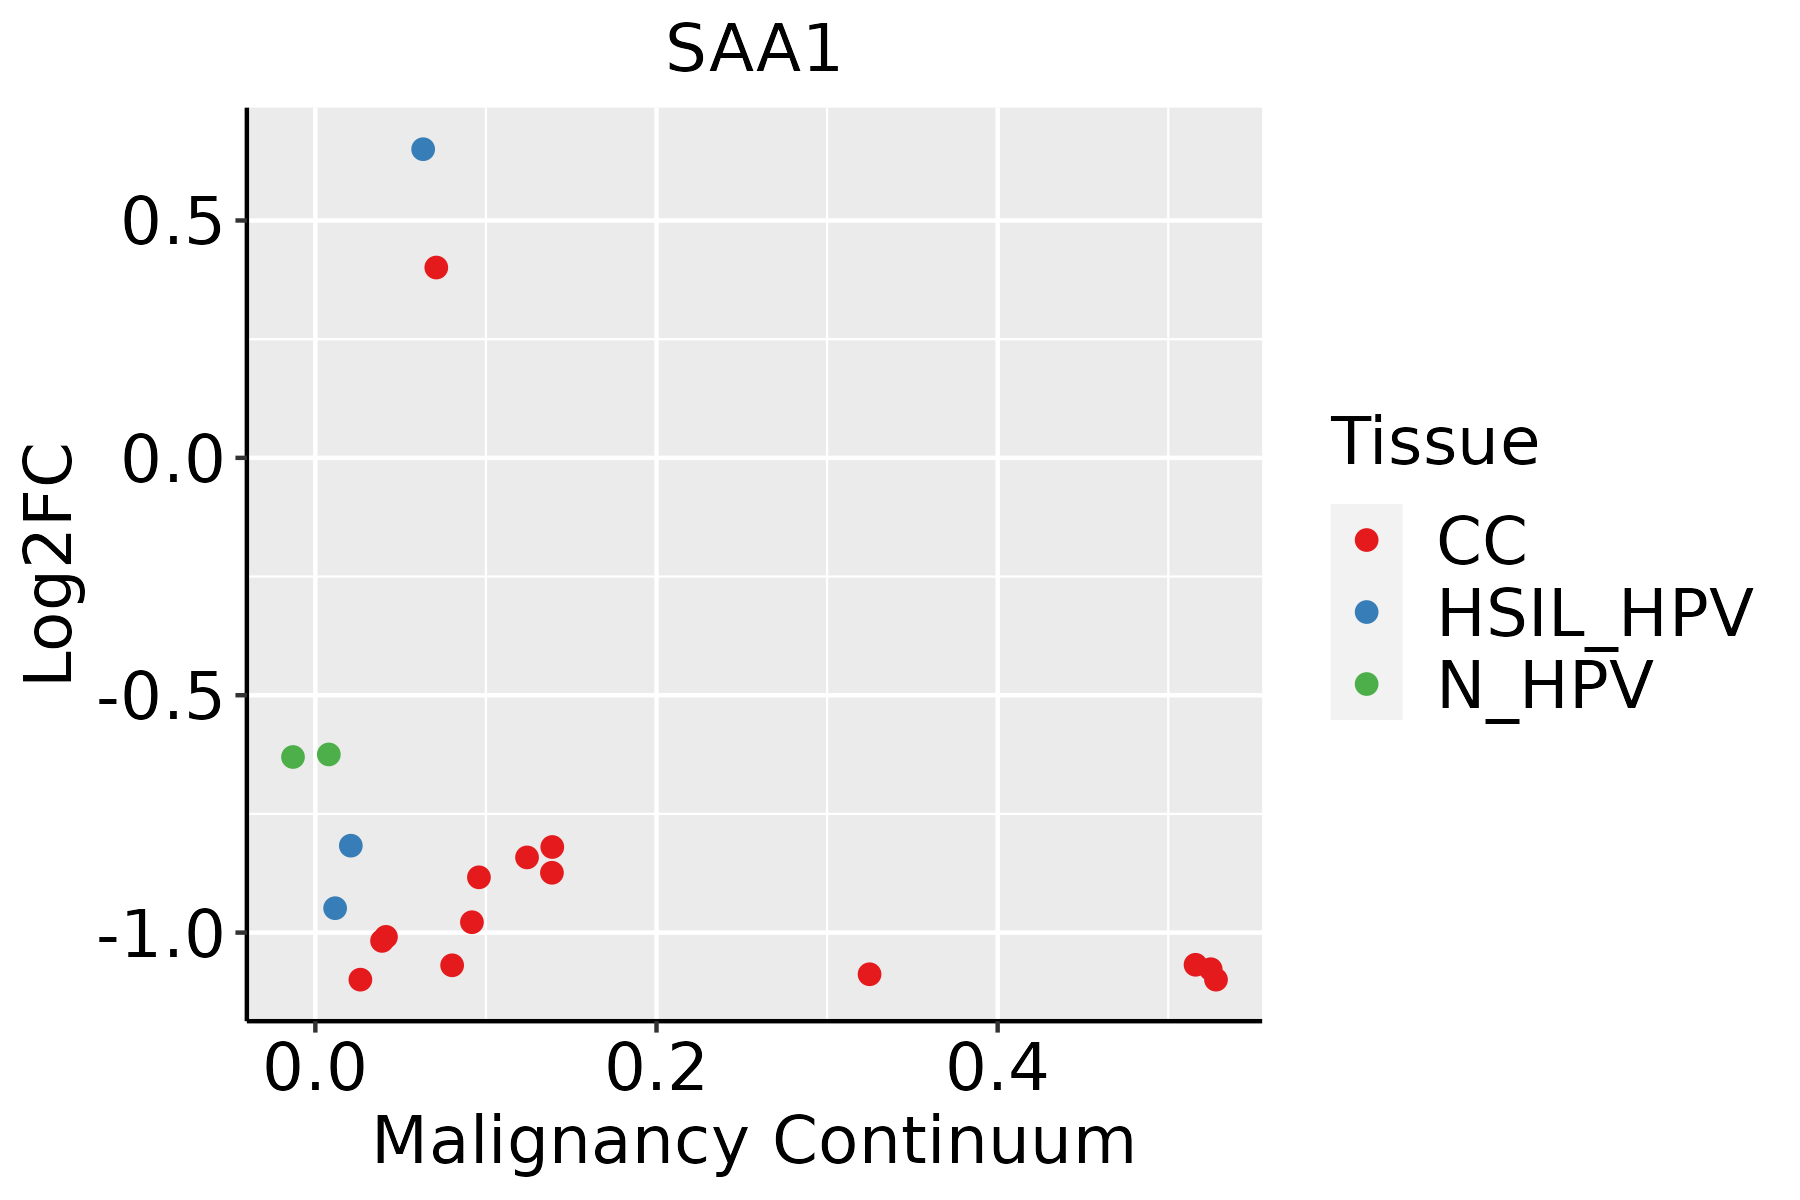 | CC: Cervix cancer |
| HSIL_HPV: HPV-infected high-grade squamous intraepithelial lesions | ||
| N_HPV: HPV-infected normal cervix | ||
| Endometrium | 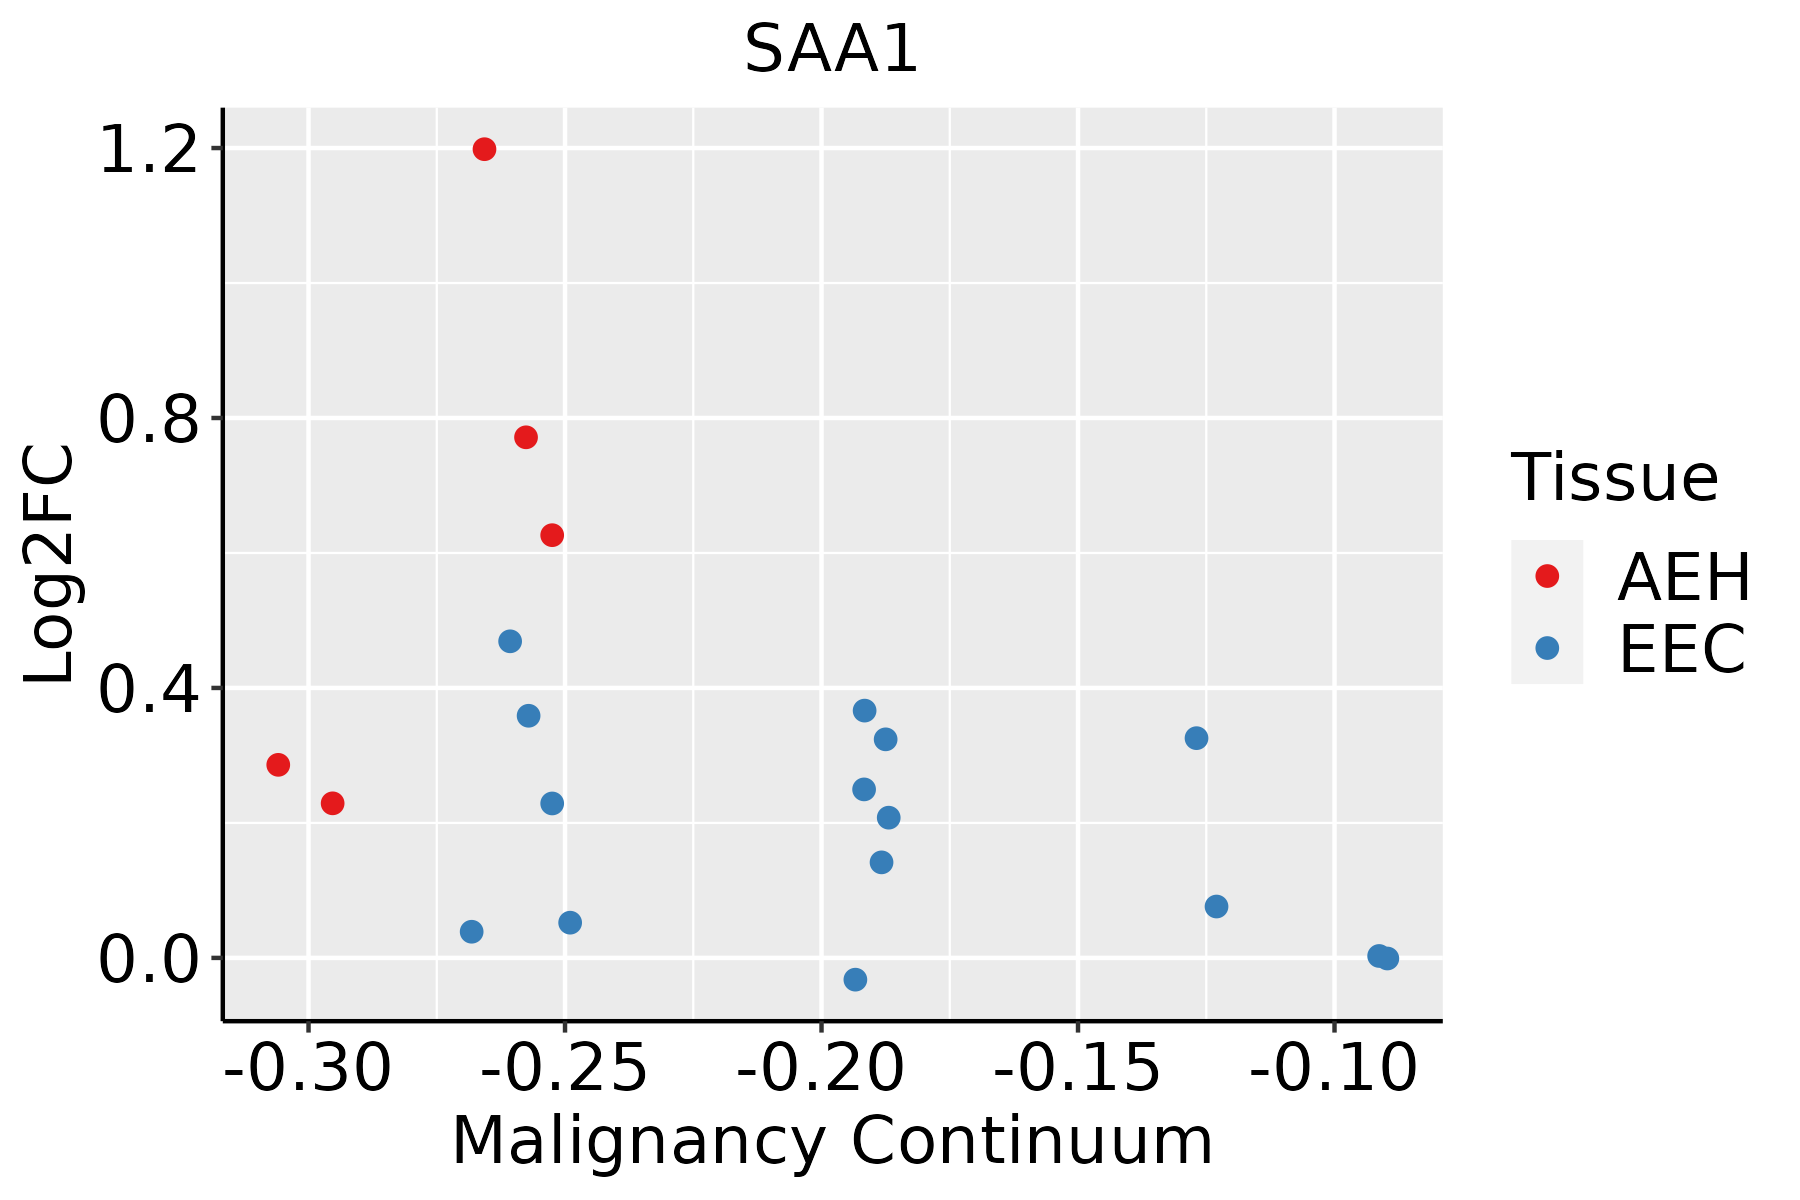 | AEH: Atypical endometrial hyperplasia |
| EEC: Endometrioid Cancer | ||
| Esophagus | 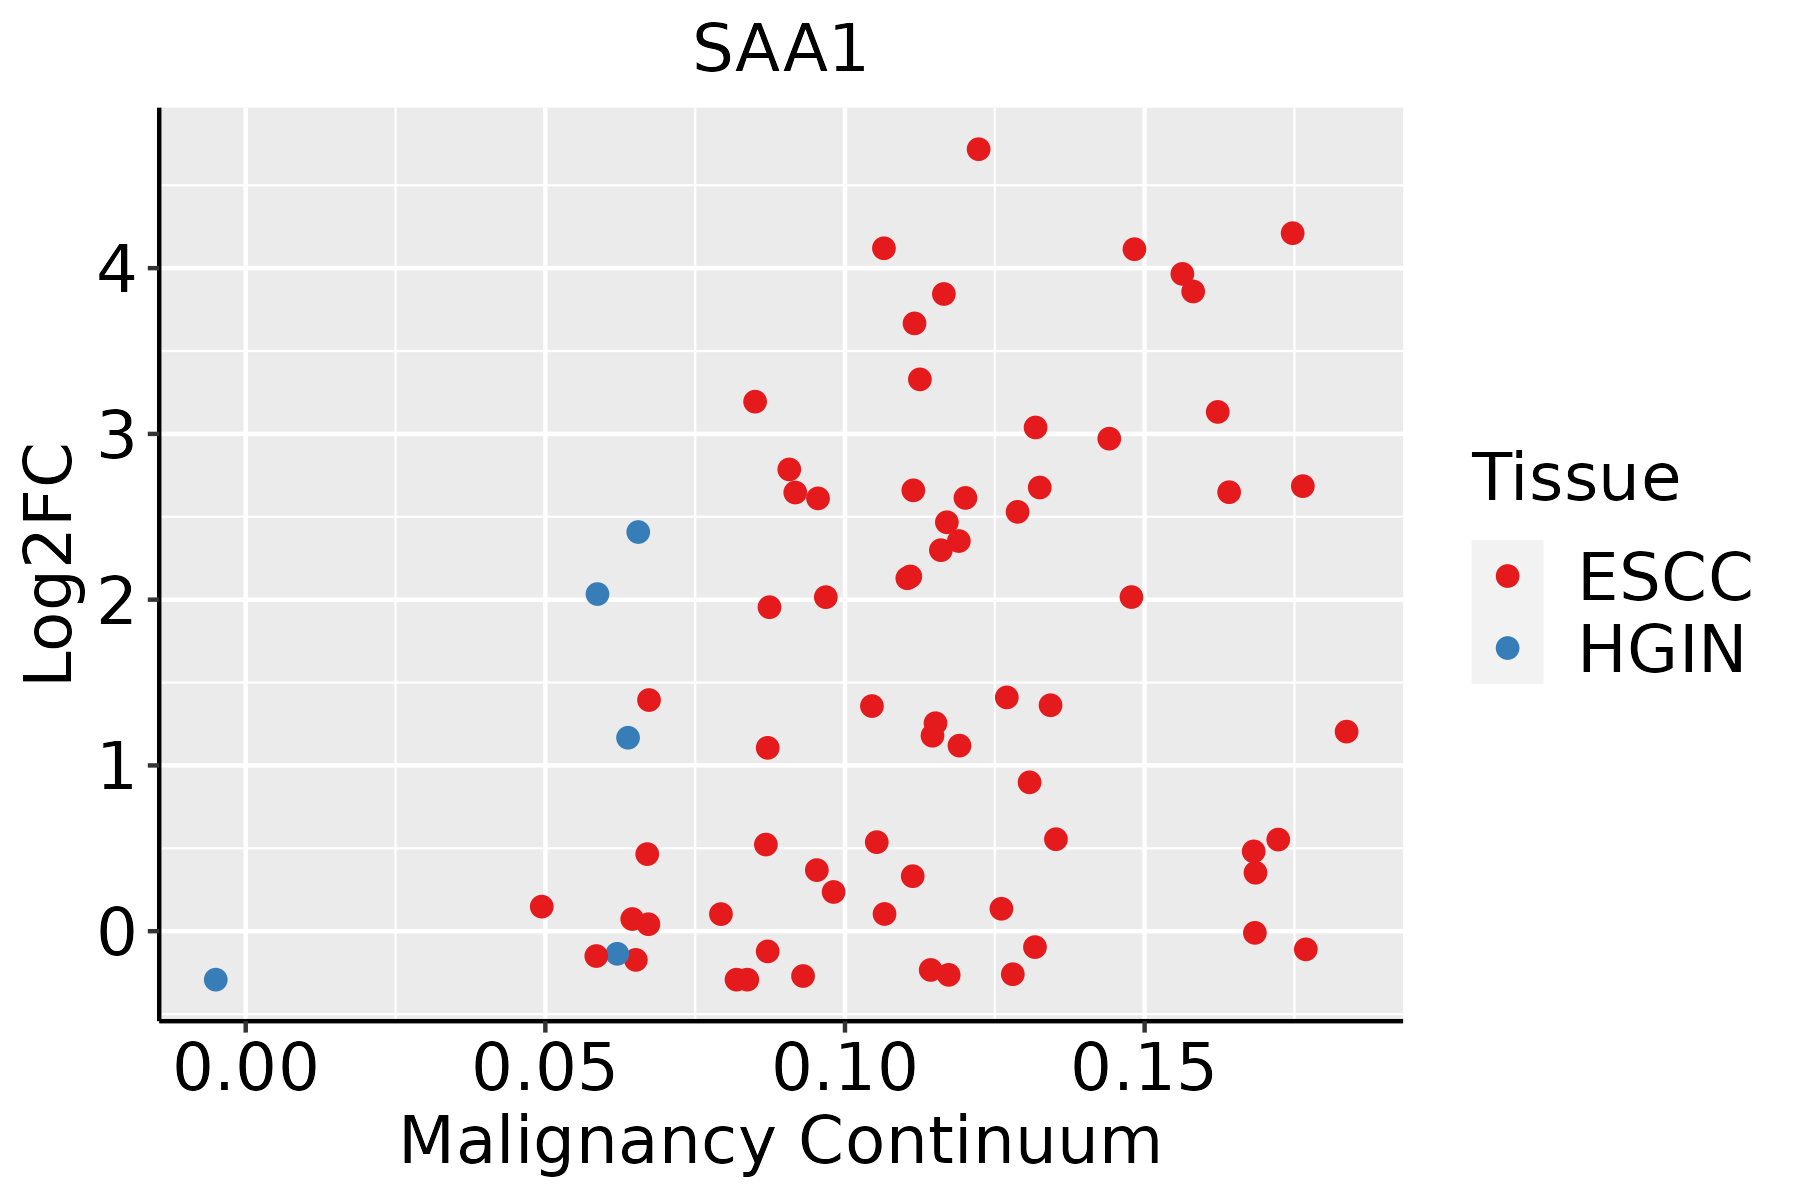 | ESCC: Esophageal squamous cell carcinoma |
| HGIN: High-grade intraepithelial neoplasias | ||
| LGIN: Low-grade intraepithelial neoplasias | ||
| Liver | 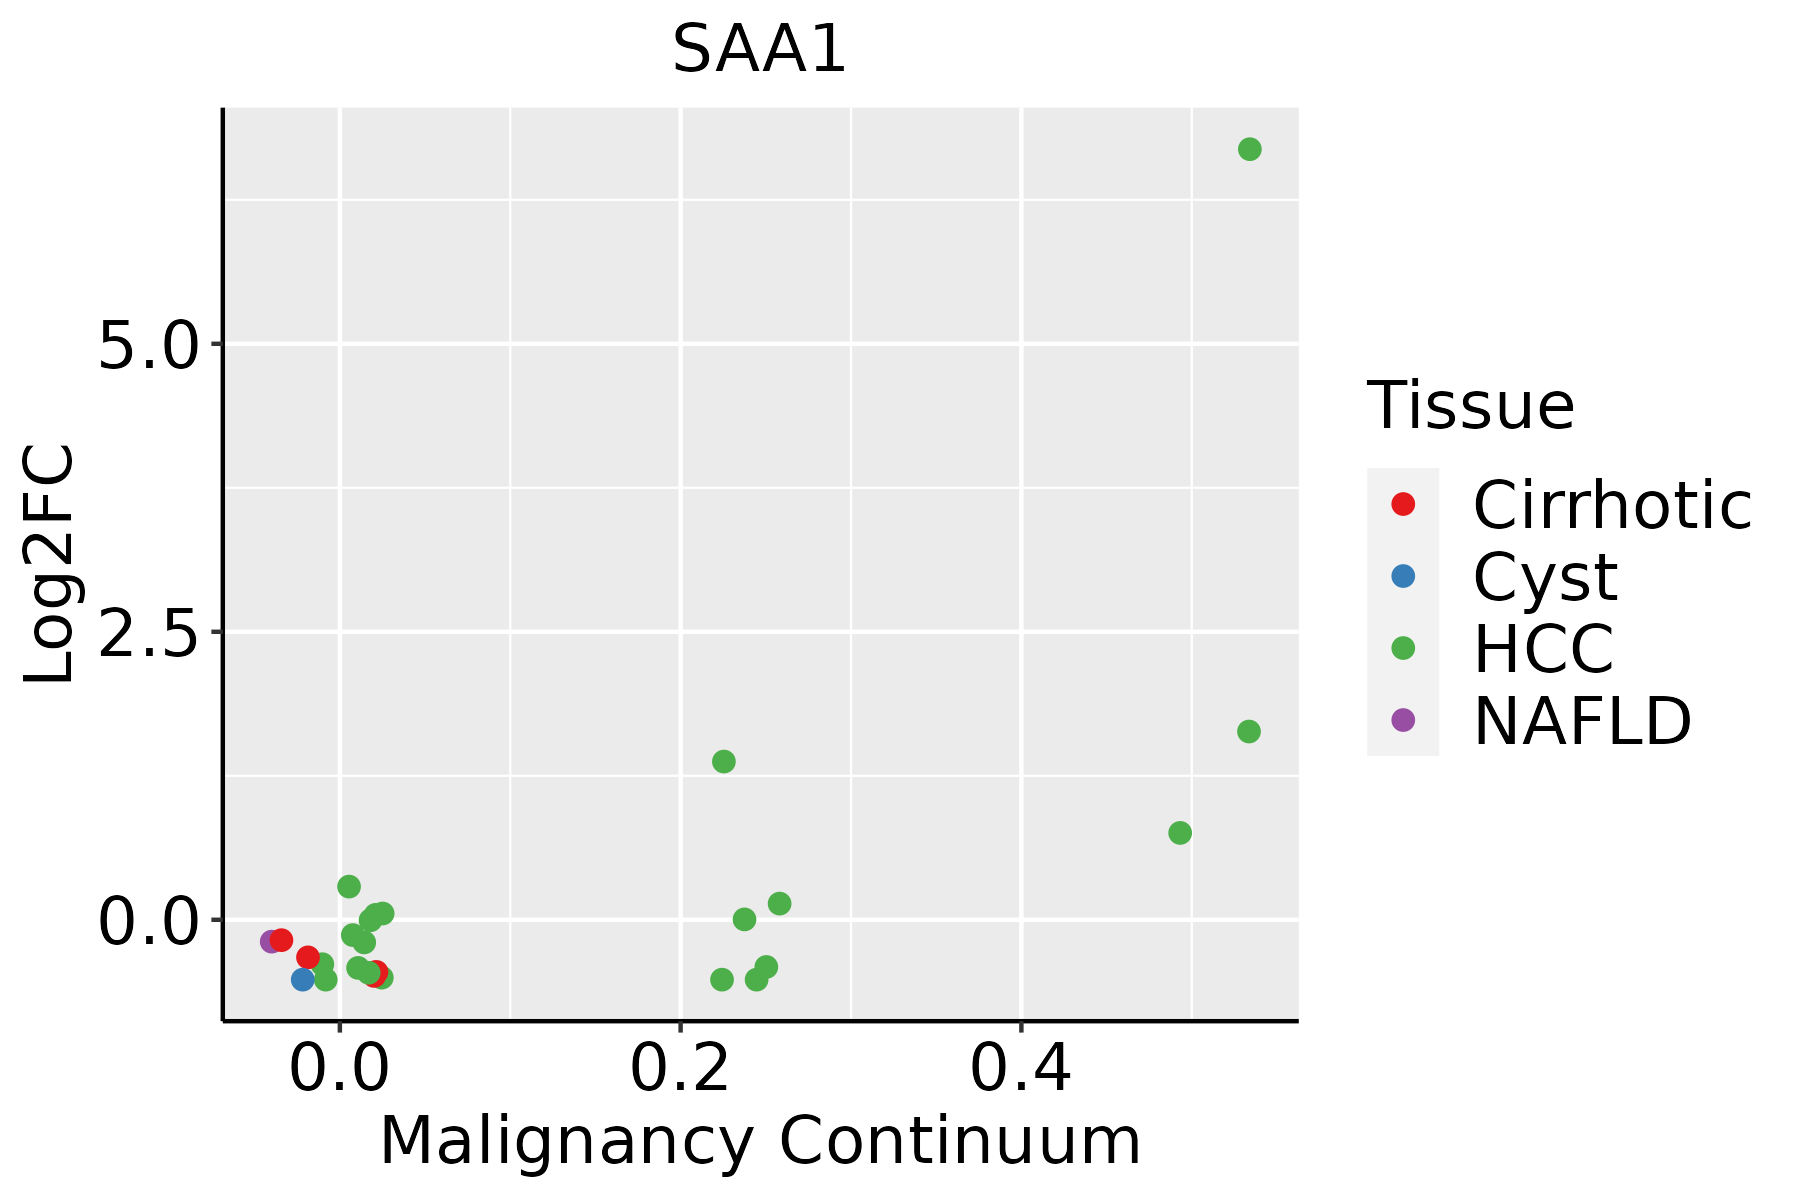 | HCC: Hepatocellular carcinoma |
| NAFLD: Non-alcoholic fatty liver disease | ||
| Lung |  | AAH: Atypical adenomatous hyperplasia |
| AIS: Adenocarcinoma in situ | ||
| IAC: Invasive lung adenocarcinoma | ||
| MIA: Minimally invasive adenocarcinoma | ||
| Oral Cavity | 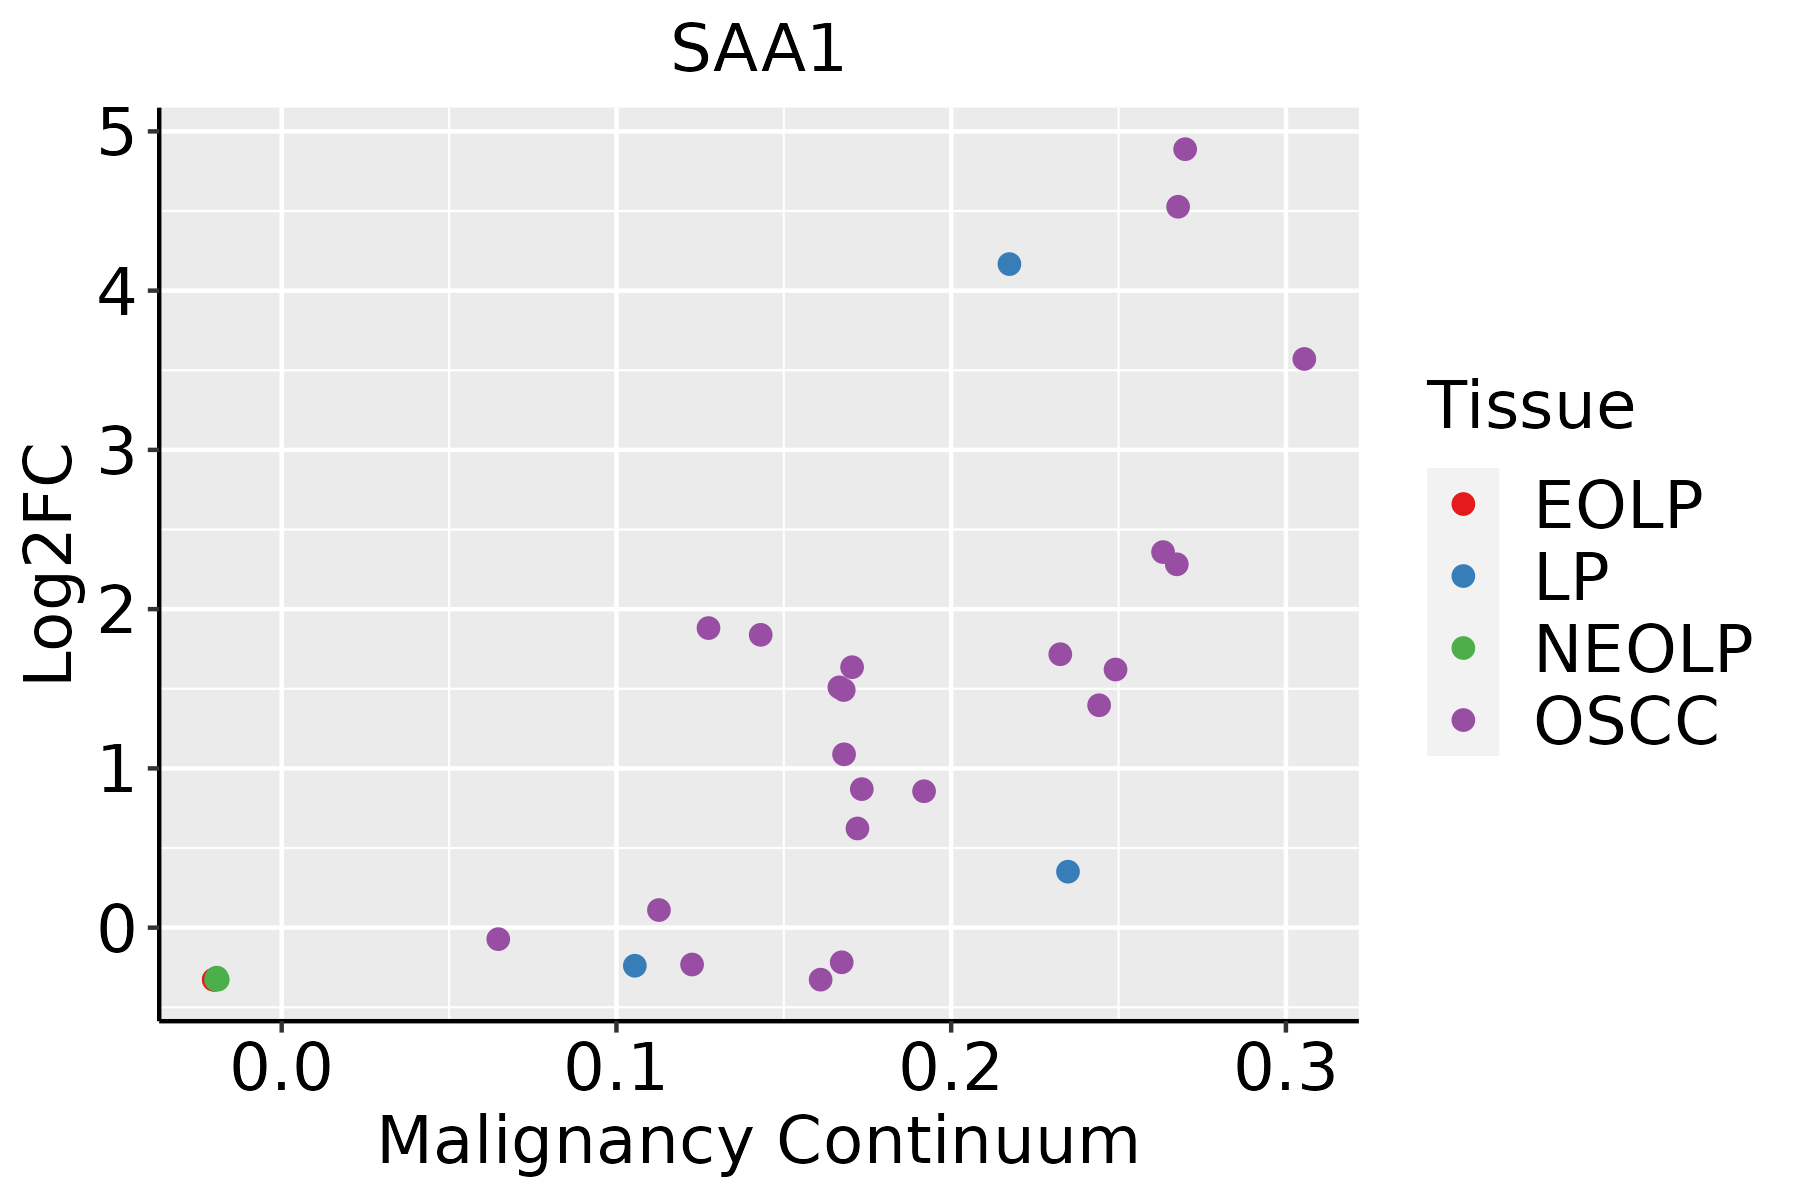 | EOLP: Erosive Oral lichen planus |
| LP: leukoplakia | ||
| NEOLP: Non-erosive oral lichen planus | ||
| OSCC: Oral squamous cell carcinoma | ||
| Prostate | 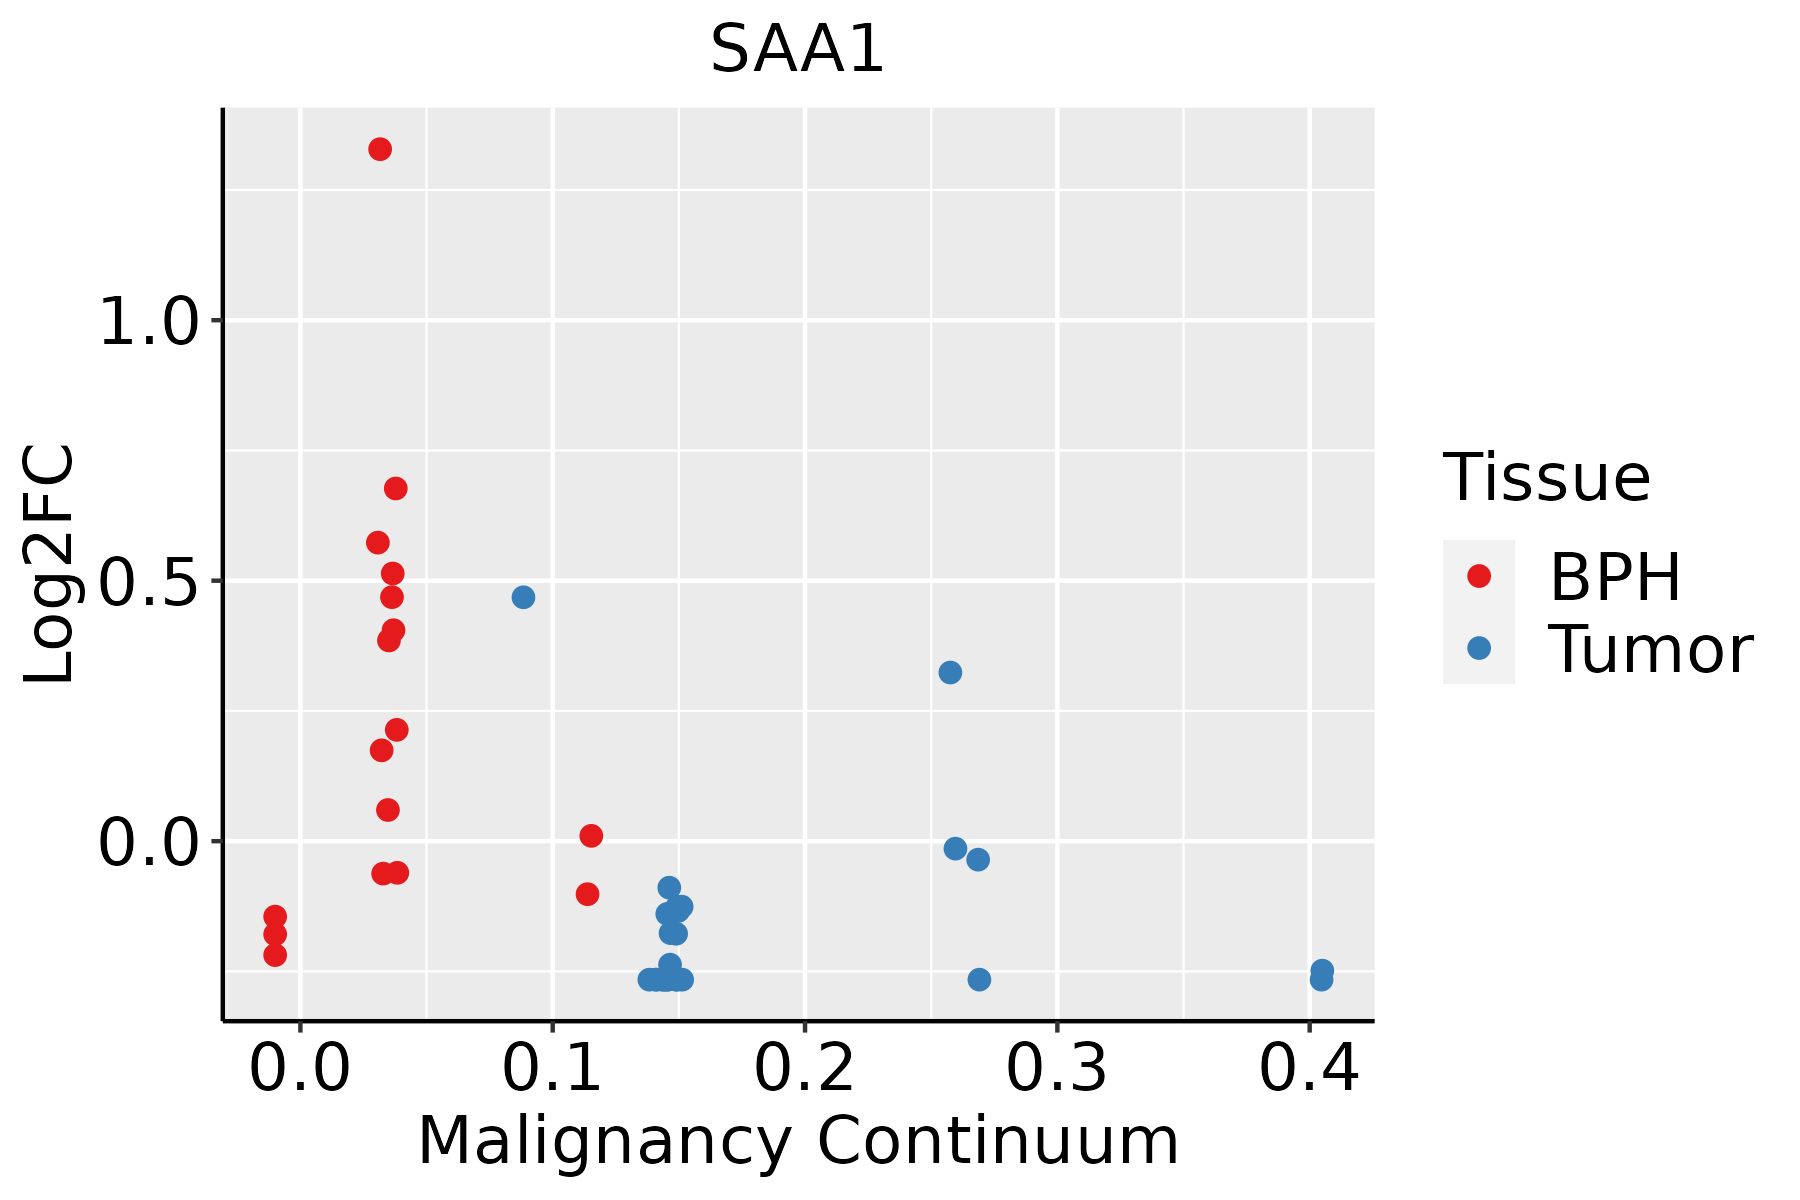 | BPH: Benign Prostatic Hyperplasia |
| Skin | 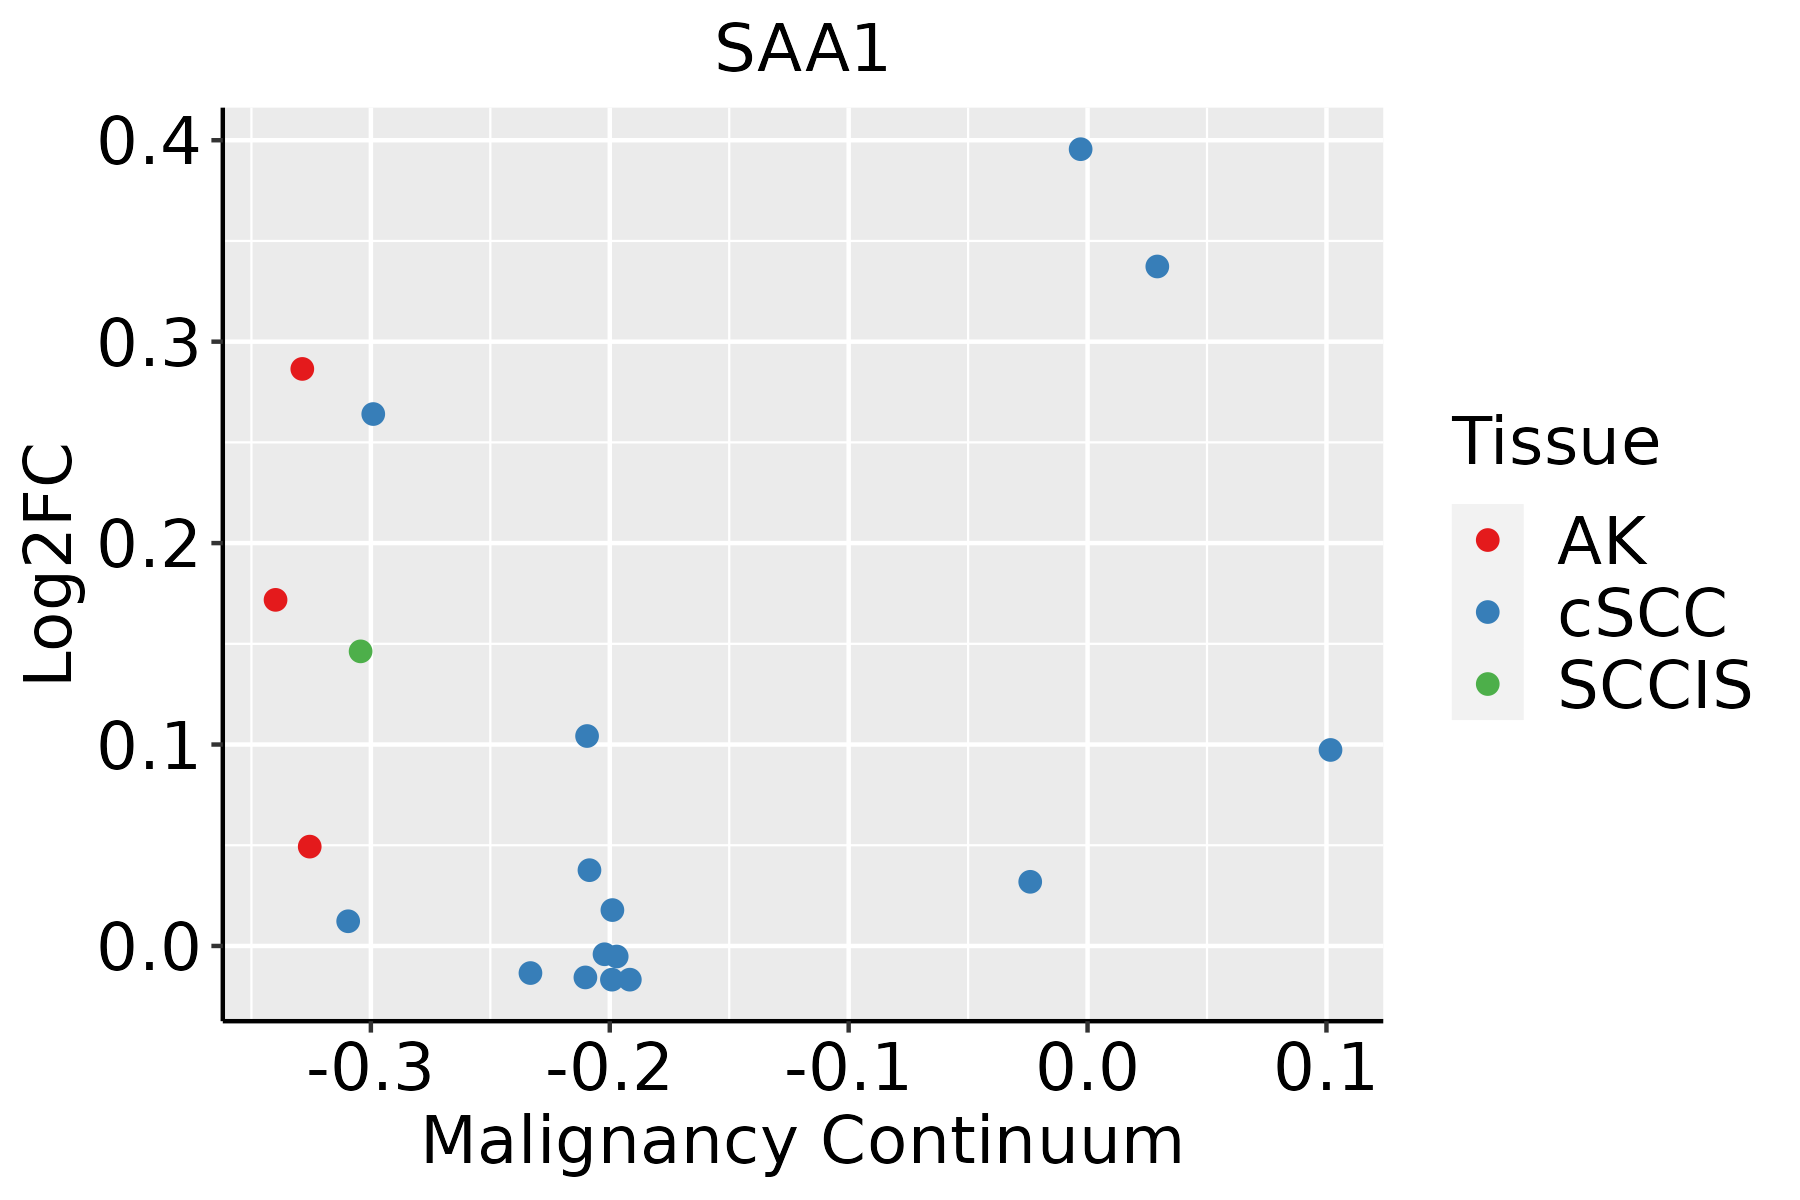 | AK: Actinic keratosis |
| cSCC: Cutaneous squamous cell carcinoma | ||
| SCCIS:squamous cell carcinoma in situ | ||
| Thyroid | 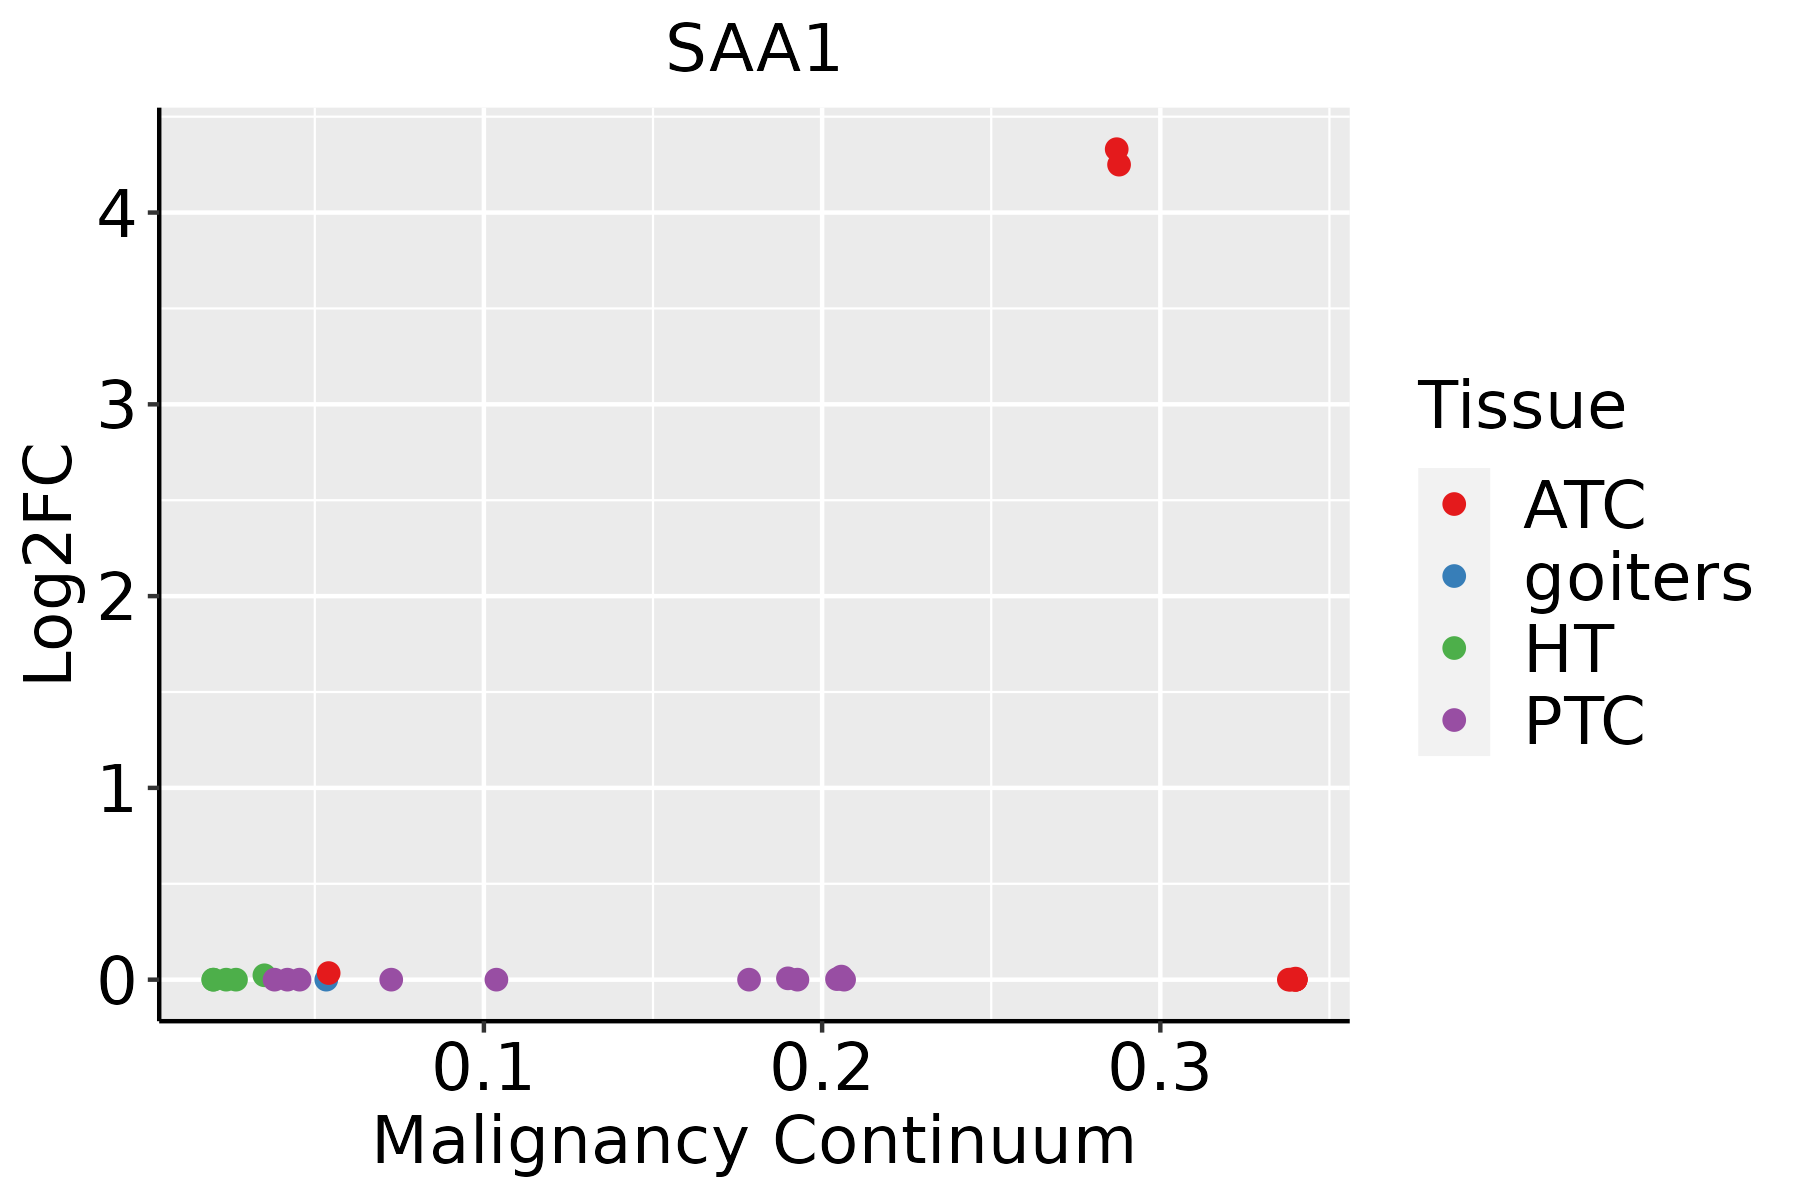 | ATC: Anaplastic thyroid cancer |
| HT: Hashimoto's thyroiditis | ||
| PTC: Papillary thyroid cancer |
| ∗log2FC in expression of this searched gene in stem-like cells from each diseased tissue sample relative to stem-like cells in normal samples in each tissue plotted against the malignancy continuum. Samples are colored based on if they are from different disease stage. |
Top |
Malignant transformation related pathway analysis |
| Find out the enriched GO biological processes and KEGG pathways involved in transition from healthy to precancer to cancer |
| Tissue | Disease Stage | Enriched GO biological Processes |
| Colorectum | AD |  |
| Colorectum | SER |  |
| Colorectum | MSS |  |
| Colorectum | MSI-H |  |
| Colorectum | FAP |  |
| ∗Top 15 enriched GO BP terms are showed in the bar plot of each disease state in each tissue. Each row represents a significant GO biological process which is colored according to the -log10(p.adjust). |
| Page: 1 2 3 4 5 6 7 8 9 |
| GO ID | Tissue | Disease Stage | Description | Gene Ratio | Bg Ratio | pvalue | p.adjust | Count |
| GO:00975297 | Breast | Precancer | myeloid leukocyte migration | 34/1080 | 220/18723 | 1.42e-07 | 7.82e-06 | 34 |
| GO:00509006 | Breast | Precancer | leukocyte migration | 47/1080 | 369/18723 | 2.82e-07 | 1.39e-05 | 47 |
| GO:00305956 | Breast | Precancer | leukocyte chemotaxis | 34/1080 | 230/18723 | 4.16e-07 | 1.89e-05 | 34 |
| GO:00457859 | Breast | Precancer | positive regulation of cell adhesion | 52/1080 | 437/18723 | 5.74e-07 | 2.49e-05 | 52 |
| GO:00603266 | Breast | Precancer | cell chemotaxis | 41/1080 | 310/18723 | 5.99e-07 | 2.55e-05 | 41 |
| GO:00716217 | Breast | Precancer | granulocyte chemotaxis | 23/1080 | 125/18723 | 6.73e-07 | 2.77e-05 | 23 |
| GO:00975307 | Breast | Precancer | granulocyte migration | 24/1080 | 148/18723 | 4.04e-06 | 1.26e-04 | 24 |
| GO:00018196 | Breast | Precancer | positive regulation of cytokine production | 52/1080 | 467/18723 | 4.18e-06 | 1.29e-04 | 52 |
| GO:00420609 | Breast | Precancer | wound healing | 48/1080 | 422/18723 | 5.48e-06 | 1.63e-04 | 48 |
| GO:00305937 | Breast | Precancer | neutrophil chemotaxis | 19/1080 | 103/18723 | 5.94e-06 | 1.71e-04 | 19 |
| GO:0050727 | Breast | Precancer | regulation of inflammatory response | 44/1080 | 386/18723 | 1.26e-05 | 3.22e-04 | 44 |
| GO:19902665 | Breast | Precancer | neutrophil migration | 20/1080 | 122/18723 | 2.13e-05 | 4.99e-04 | 20 |
| GO:00508789 | Breast | Precancer | regulation of body fluid levels | 40/1080 | 379/18723 | 1.68e-04 | 2.77e-03 | 40 |
| GO:00482463 | Breast | Precancer | macrophage chemotaxis | 9/1080 | 38/18723 | 2.44e-04 | 3.66e-03 | 9 |
| GO:19055173 | Breast | Precancer | macrophage migration | 11/1080 | 55/18723 | 2.57e-04 | 3.83e-03 | 11 |
| GO:00716744 | Breast | Precancer | mononuclear cell migration | 24/1080 | 196/18723 | 4.03e-04 | 5.44e-03 | 24 |
| GO:00025263 | Breast | Precancer | acute inflammatory response | 16/1080 | 112/18723 | 6.87e-04 | 8.36e-03 | 16 |
| GO:00507086 | Breast | Precancer | regulation of protein secretion | 28/1080 | 268/18723 | 1.76e-03 | 1.74e-02 | 28 |
| GO:00075995 | Breast | Precancer | hemostasis | 24/1080 | 222/18723 | 2.31e-03 | 2.15e-02 | 24 |
| GO:0032732 | Breast | Precancer | positive regulation of interleukin-1 production | 11/1080 | 73/18723 | 2.96e-03 | 2.55e-02 | 11 |
| Page: 1 2 3 4 5 6 7 8 9 10 11 12 13 14 15 16 17 18 |
| Pathway ID | Tissue | Disease Stage | Description | Gene Ratio | Bg Ratio | pvalue | p.adjust | qvalue | Count |
| Page: 1 |
Top |
Cell-cell communication analysis |
| Identification of potential cell-cell interactions between two cell types and their ligand-receptor pairs for different disease states |
| Ligand | Receptor | LRpair | Pathway | Tissue | Disease Stage |
| SAA1 | FPR2 | SAA1_FPR2 | SAA | Cervix | ADJ |
| SAA1 | FPR2 | SAA1_FPR2 | SAA | Cervix | CC |
| SAA1 | FPR2 | SAA1_FPR2 | SAA | Cervix | Healthy |
| SAA1 | FPR2 | SAA1_FPR2 | SAA | Cervix | Precancer |
| SAA1 | FPR2 | SAA1_FPR2 | SAA | HNSCC | ADJ |
| Page: 1 |
Top |
Single-cell gene regulatory network inference analysis |
| Find out the significant the regulons (TFs) and the target genes of each regulon across cell types for different disease states |
| TF | Cell Type | Tissue | Disease Stage | Target Gene | RSS | Regulon Activity |
| ∗The dot plots of a searched regulon are shown for all cell subpopulations in each disease state of each tissue based on the regulon specific score inferred using pySCENIC and by calculating the average expression. |
| Page: 1 |
Top |
Somatic mutation of malignant transformation related genes |
| Annotation of somatic variants for genes involved in malignant transformation |
| Hugo Symbol | Variant Class | Variant Classification | dbSNP RS | HGVSc | HGVSp | HGVSp Short | SWISSPROT | BIOTYPE | SIFT | PolyPhen | Tumor Sample Barcode | Tissue | Histology | Sex | Age | Stage | Therapy Types | Drugs | Outcome |
| SAA1 | SNV | Missense_Mutation | rs139332456 | c.79N>A | p.Glu27Lys | p.E27K | P0DJI8 | protein_coding | deleterious(0) | possibly_damaging(0.746) | TCGA-C8-A12X-01 | Breast | breast invasive carcinoma | Female | <65 | I/II | Unknown | Unknown | SD |
| SAA1 | SNV | Missense_Mutation | c.239G>C | p.Arg80Thr | p.R80T | P0DJI8 | protein_coding | deleterious(0.01) | probably_damaging(0.976) | TCGA-IR-A3LA-01 | Cervix | cervical & endocervical cancer | Female | <65 | I/II | Chemotherapy | cisplatin | CR | |
| SAA1 | SNV | Missense_Mutation | c.169N>T | p.Arg57Trp | p.R57W | P0DJI8 | protein_coding | tolerated(0.06) | possibly_damaging(0.458) | TCGA-JX-A3Q8-01 | Cervix | cervical & endocervical cancer | Female | <65 | I/II | Unknown | Unknown | SD | |
| SAA1 | SNV | Missense_Mutation | c.258N>A | p.Phe86Leu | p.F86L | P0DJI8 | protein_coding | tolerated(0.85) | benign(0) | TCGA-AA-A010-01 | Colorectum | colon adenocarcinoma | Female | <65 | I/II | Chemotherapy | folinic | CR | |
| SAA1 | SNV | Missense_Mutation | c.258N>A | p.Phe86Leu | p.F86L | P0DJI8 | protein_coding | tolerated(0.85) | benign(0) | TCGA-CA-6717-01 | Colorectum | colon adenocarcinoma | Male | <65 | I/II | Chemotherapy | oxaliplatin | CR | |
| SAA1 | SNV | Missense_Mutation | c.38N>C | p.Val13Ala | p.V13A | P0DJI8 | protein_coding | tolerated(0.06) | benign(0.043) | TCGA-AG-A002-01 | Colorectum | rectum adenocarcinoma | Male | <65 | I/II | Unknown | Unknown | SD | |
| SAA1 | SNV | Missense_Mutation | novel | c.160N>G | p.Phe54Val | p.F54V | P0DJI8 | protein_coding | deleterious(0) | probably_damaging(0.985) | TCGA-A5-A0G2-01 | Endometrium | uterine corpus endometrioid carcinoma | Female | <65 | III/IV | Unknown | Unknown | SD |
| SAA1 | SNV | Missense_Mutation | rs559587106 | c.272N>T | p.Ala91Val | p.A91V | P0DJI8 | protein_coding | tolerated(0.51) | benign(0.006) | TCGA-A5-A0G2-01 | Endometrium | uterine corpus endometrioid carcinoma | Female | <65 | III/IV | Unknown | Unknown | SD |
| SAA1 | SNV | Missense_Mutation | c.63N>A | p.Phe21Leu | p.F21L | P0DJI8 | protein_coding | tolerated(0.09) | benign(0) | TCGA-AP-A1DV-01 | Endometrium | uterine corpus endometrioid carcinoma | Female | <65 | I/II | Unknown | Unknown | SD | |
| SAA1 | SNV | Missense_Mutation | c.360G>T | p.Glu120Asp | p.E120D | P0DJI8 | protein_coding | tolerated(1) | benign(0) | TCGA-AX-A0J0-01 | Endometrium | uterine corpus endometrioid carcinoma | Female | <65 | I/II | Unknown | Unknown | SD |
| Page: 1 2 |
Top |
Related drugs of malignant transformation related genes |
| Identification of chemicals and drugs interact with genes involved in malignant transfromation |
| (DGIdb 4.0) |
| Entrez ID | Symbol | Category | Interaction Types | Drug Claim Name | Drug Name | PMIDs |
| 6288 | SAA1 | DRUGGABLE GENOME | IL-1RA | ANAKINRA | 1717568 | |
| 6288 | SAA1 | DRUGGABLE GENOME | NAPROXEN | NAPROXEN | 1729367 |
| Page: 1 |

Copyright 2023-Present -The University of Texas Health Science Center at Houston |