
|
|||||
|
 | |
| |
| |
| |
| |
| |
|
Gene: S1PR5 |
Gene summary for S1PR5 |
| Gene information | Species | Human | Gene symbol | S1PR5 | Gene ID | 53637 |
| Gene name | sphingosine-1-phosphate receptor 5 | |
| Gene Alias | EDG8 | |
| Cytomap | 19p13.2 | |
| Gene Type | protein-coding | GO ID | GO:0003376 | UniProtAcc | Q9H228 |
Top |
Malignant transformation analysis |
| Identification of the aberrant gene expression in precancerous and cancerous lesions by comparing the gene expression of stem-like cells in diseased tissues with normal stem cells |
| Entrez ID | Symbol | Replicates | Species | Organ | Tissue | Adj P-value | Log2FC | Malignancy |
| 53637 | S1PR5 | LZE4T | Human | Esophagus | ESCC | 3.86e-11 | 2.87e-01 | 0.0811 |
| 53637 | S1PR5 | P2T-E | Human | Esophagus | ESCC | 1.66e-02 | 9.52e-02 | 0.1177 |
| 53637 | S1PR5 | P4T-E | Human | Esophagus | ESCC | 3.18e-14 | 2.92e-01 | 0.1323 |
| 53637 | S1PR5 | P5T-E | Human | Esophagus | ESCC | 3.60e-13 | 2.16e-01 | 0.1327 |
| 53637 | S1PR5 | P10T-E | Human | Esophagus | ESCC | 8.84e-05 | 1.42e-01 | 0.116 |
| 53637 | S1PR5 | P12T-E | Human | Esophagus | ESCC | 9.53e-09 | 1.94e-01 | 0.1122 |
| 53637 | S1PR5 | P15T-E | Human | Esophagus | ESCC | 9.35e-25 | 4.46e-01 | 0.1149 |
| 53637 | S1PR5 | P16T-E | Human | Esophagus | ESCC | 3.97e-04 | 6.96e-02 | 0.1153 |
| 53637 | S1PR5 | P20T-E | Human | Esophagus | ESCC | 4.38e-08 | 1.84e-01 | 0.1124 |
| 53637 | S1PR5 | P21T-E | Human | Esophagus | ESCC | 2.06e-08 | 1.54e-01 | 0.1617 |
| 53637 | S1PR5 | P22T-E | Human | Esophagus | ESCC | 5.79e-16 | 2.75e-01 | 0.1236 |
| 53637 | S1PR5 | P23T-E | Human | Esophagus | ESCC | 1.99e-08 | 2.71e-01 | 0.108 |
| 53637 | S1PR5 | P24T-E | Human | Esophagus | ESCC | 1.88e-04 | 1.11e-01 | 0.1287 |
| 53637 | S1PR5 | P26T-E | Human | Esophagus | ESCC | 1.97e-10 | 2.00e-01 | 0.1276 |
| 53637 | S1PR5 | P27T-E | Human | Esophagus | ESCC | 1.76e-12 | 2.37e-01 | 0.1055 |
| 53637 | S1PR5 | P28T-E | Human | Esophagus | ESCC | 7.31e-14 | 2.26e-01 | 0.1149 |
| 53637 | S1PR5 | P30T-E | Human | Esophagus | ESCC | 4.37e-20 | 4.60e-01 | 0.137 |
| 53637 | S1PR5 | P31T-E | Human | Esophagus | ESCC | 9.35e-10 | 1.91e-01 | 0.1251 |
| 53637 | S1PR5 | P32T-E | Human | Esophagus | ESCC | 4.31e-06 | 1.50e-01 | 0.1666 |
| 53637 | S1PR5 | P36T-E | Human | Esophagus | ESCC | 1.14e-17 | 5.91e-01 | 0.1187 |
| Page: 1 2 |
| Tissue | Expression Dynamics | Abbreviation |
| Esophagus | 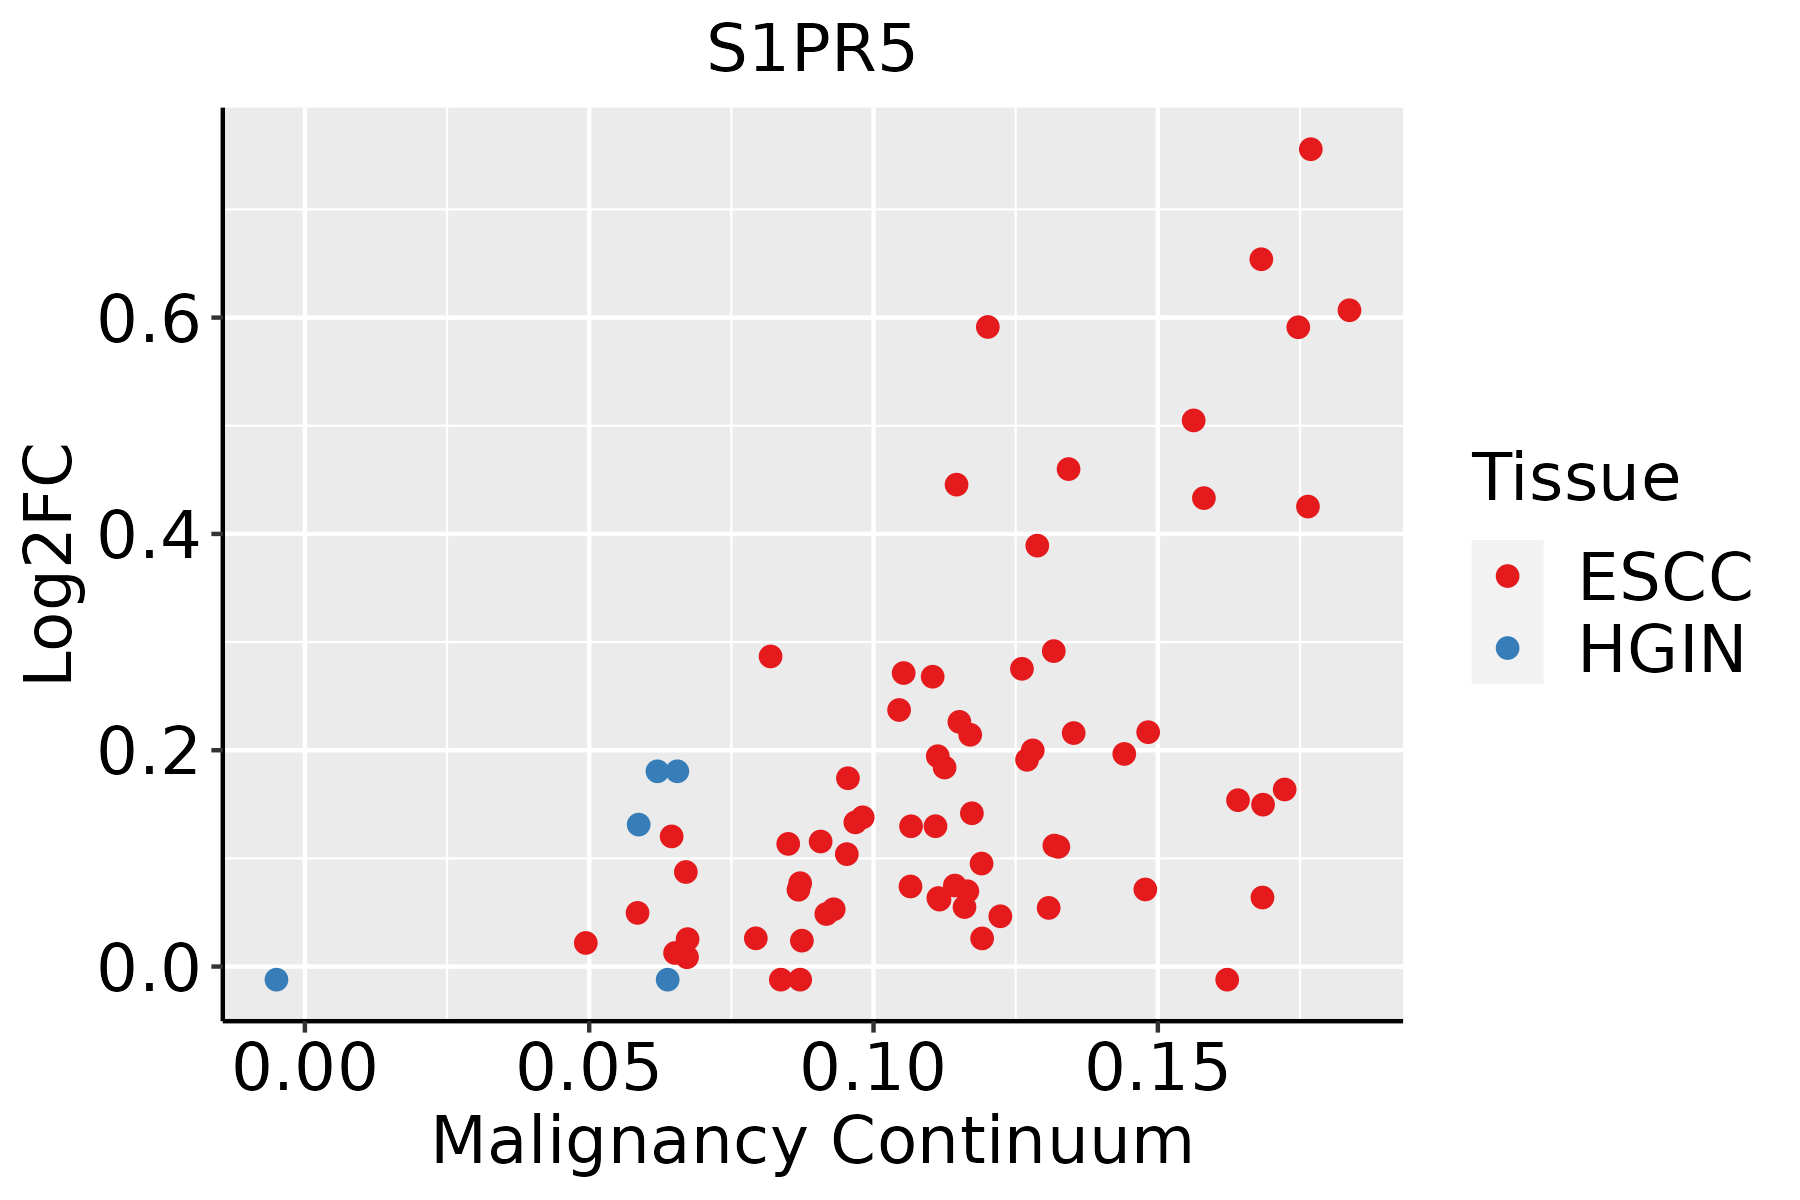 | ESCC: Esophageal squamous cell carcinoma |
| HGIN: High-grade intraepithelial neoplasias | ||
| LGIN: Low-grade intraepithelial neoplasias |
| ∗log2FC in expression of this searched gene in stem-like cells from each diseased tissue sample relative to stem-like cells in normal samples in each tissue plotted against the malignancy continuum. Samples are colored based on if they are from different disease stage. |
Top |
Malignant transformation related pathway analysis |
| Find out the enriched GO biological processes and KEGG pathways involved in transition from healthy to precancer to cancer |
| Tissue | Disease Stage | Enriched GO biological Processes |
| Colorectum | AD |  |
| Colorectum | SER |  |
| Colorectum | MSS |  |
| Colorectum | MSI-H |  |
| Colorectum | FAP |  |
| ∗Top 15 enriched GO BP terms are showed in the bar plot of each disease state in each tissue. Each row represents a significant GO biological process which is colored according to the -log10(p.adjust). |
| Page: 1 2 3 4 5 6 7 8 9 |
| GO ID | Tissue | Disease Stage | Description | Gene Ratio | Bg Ratio | pvalue | p.adjust | Count |
| Page: 1 |
| Pathway ID | Tissue | Disease Stage | Description | Gene Ratio | Bg Ratio | pvalue | p.adjust | qvalue | Count |
| hsa0407116 | Esophagus | ESCC | Sphingolipid signaling pathway | 85/4205 | 121/8465 | 3.04e-06 | 1.73e-05 | 8.84e-06 | 85 |
| hsa0407117 | Esophagus | ESCC | Sphingolipid signaling pathway | 85/4205 | 121/8465 | 3.04e-06 | 1.73e-05 | 8.84e-06 | 85 |
| Page: 1 |
Top |
Cell-cell communication analysis |
| Identification of potential cell-cell interactions between two cell types and their ligand-receptor pairs for different disease states |
| Ligand | Receptor | LRpair | Pathway | Tissue | Disease Stage |
| Page: 1 |
Top |
Single-cell gene regulatory network inference analysis |
| Find out the significant the regulons (TFs) and the target genes of each regulon across cell types for different disease states |
| TF | Cell Type | Tissue | Disease Stage | Target Gene | RSS | Regulon Activity |
| ∗The dot plots of a searched regulon are shown for all cell subpopulations in each disease state of each tissue based on the regulon specific score inferred using pySCENIC and by calculating the average expression. |
| Page: 1 |
Top |
Somatic mutation of malignant transformation related genes |
| Annotation of somatic variants for genes involved in malignant transformation |
| Hugo Symbol | Variant Class | Variant Classification | dbSNP RS | HGVSc | HGVSp | HGVSp Short | SWISSPROT | BIOTYPE | SIFT | PolyPhen | Tumor Sample Barcode | Tissue | Histology | Sex | Age | Stage | Therapy Types | Drugs | Outcome |
| S1PR5 | SNV | Missense_Mutation | c.592N>A | p.Val198Met | p.V198M | Q9H228 | protein_coding | deleterious(0) | probably_damaging(0.989) | TCGA-A2-A0CS-01 | Breast | breast invasive carcinoma | Female | >=65 | III/IV | Hormone Therapy | anastrozole | SD | |
| S1PR5 | SNV | Missense_Mutation | novel | c.227N>C | p.Gly76Ala | p.G76A | Q9H228 | protein_coding | deleterious(0.04) | probably_damaging(0.978) | TCGA-VS-A957-01 | Cervix | cervical & endocervical cancer | Female | <65 | I/II | Chemotherapy | cisplatin | CR |
| S1PR5 | SNV | Missense_Mutation | c.1162N>A | p.Ala388Thr | p.A388T | Q9H228 | protein_coding | tolerated(0.06) | benign(0) | TCGA-AA-3544-01 | Colorectum | colon adenocarcinoma | Male | >=65 | I/II | Unknown | Unknown | SD | |
| S1PR5 | SNV | Missense_Mutation | c.670C>T | p.Arg224Trp | p.R224W | Q9H228 | protein_coding | deleterious(0.01) | possibly_damaging(0.664) | TCGA-AD-6895-01 | Colorectum | colon adenocarcinoma | Male | >=65 | III/IV | Unknown | Unknown | SD | |
| S1PR5 | SNV | Missense_Mutation | c.280N>A | p.Leu94Ile | p.L94I | Q9H228 | protein_coding | tolerated(0.07) | benign(0.137) | TCGA-AZ-6598-01 | Colorectum | colon adenocarcinoma | Female | >=65 | I/II | Unknown | Unknown | SD | |
| S1PR5 | SNV | Missense_Mutation | rs562669008 | c.169N>A | p.Val57Met | p.V57M | Q9H228 | protein_coding | deleterious(0) | possibly_damaging(0.878) | TCGA-AZ-6598-01 | Colorectum | colon adenocarcinoma | Female | >=65 | I/II | Unknown | Unknown | SD |
| S1PR5 | SNV | Missense_Mutation | c.343N>A | p.Val115Ile | p.V115I | Q9H228 | protein_coding | deleterious(0.05) | possibly_damaging(0.463) | TCGA-CM-4743-01 | Colorectum | colon adenocarcinoma | Male | >=65 | I/II | Chemotherapy | capecitabine | SD | |
| S1PR5 | SNV | Missense_Mutation | c.448N>T | p.Arg150Cys | p.R150C | Q9H228 | protein_coding | deleterious(0) | probably_damaging(0.999) | TCGA-CM-5861-01 | Colorectum | colon adenocarcinoma | Female | <65 | I/II | Unknown | Unknown | PD | |
| S1PR5 | SNV | Missense_Mutation | c.592N>A | p.Val198Met | p.V198M | Q9H228 | protein_coding | deleterious(0) | probably_damaging(0.989) | TCGA-D5-6928-01 | Colorectum | colon adenocarcinoma | Male | >=65 | I/II | Unknown | Unknown | SD | |
| S1PR5 | SNV | Missense_Mutation | c.205G>A | p.Ala69Thr | p.A69T | Q9H228 | protein_coding | tolerated(0.64) | benign(0.074) | TCGA-D5-6930-01 | Colorectum | colon adenocarcinoma | Male | >=65 | I/II | Unknown | Unknown | SD |
| Page: 1 2 3 4 |
Top |
Related drugs of malignant transformation related genes |
| Identification of chemicals and drugs interact with genes involved in malignant transfromation |
| (DGIdb 4.0) |
| Entrez ID | Symbol | Category | Interaction Types | Drug Claim Name | Drug Name | PMIDs |
| 53637 | S1PR5 | DRUGGABLE GENOME, G PROTEIN COUPLED RECEPTOR | agonist | 318164808 | SIPONIMOD | |
| 53637 | S1PR5 | DRUGGABLE GENOME, G PROTEIN COUPLED RECEPTOR | agonist | 318164850 | ETRASIMOD | |
| 53637 | S1PR5 | DRUGGABLE GENOME, G PROTEIN COUPLED RECEPTOR | agonist | 329968432 | ||
| 53637 | S1PR5 | DRUGGABLE GENOME, G PROTEIN COUPLED RECEPTOR | agonist | CHEMBL2336071 | SIPONIMOD | |
| 53637 | S1PR5 | DRUGGABLE GENOME, G PROTEIN COUPLED RECEPTOR | agonist | CHEMBL544665 | FINGOLIMOD HYDROCHLORIDE | |
| 53637 | S1PR5 | DRUGGABLE GENOME, G PROTEIN COUPLED RECEPTOR | agonist | 252827367 | OZANIMOD | |
| 53637 | S1PR5 | DRUGGABLE GENOME, G PROTEIN COUPLED RECEPTOR | ASP-4058 | ASP-4058 | ||
| 53637 | S1PR5 | DRUGGABLE GENOME, G PROTEIN COUPLED RECEPTOR | agonist | 135649899 | ||
| 53637 | S1PR5 | DRUGGABLE GENOME, G PROTEIN COUPLED RECEPTOR | agonist | 135649942 | ||
| 53637 | S1PR5 | DRUGGABLE GENOME, G PROTEIN COUPLED RECEPTOR | agonist | 135651310 |
| Page: 1 2 |

Copyright 2023-Present -The University of Texas Health Science Center at Houston |