
|
|||||
|
 | |
| |
| |
| |
| |
| |
|
Gene: S1PR2 |
Gene summary for S1PR2 |
| Gene information | Species | Human | Gene symbol | S1PR2 | Gene ID | 9294 |
| Gene name | sphingosine-1-phosphate receptor 2 | |
| Gene Alias | AGR16 | |
| Cytomap | 19p13.2 | |
| Gene Type | protein-coding | GO ID | GO:0001885 | UniProtAcc | A0A024R7B2 |
Top |
Malignant transformation analysis |
| Identification of the aberrant gene expression in precancerous and cancerous lesions by comparing the gene expression of stem-like cells in diseased tissues with normal stem cells |
| Entrez ID | Symbol | Replicates | Species | Organ | Tissue | Adj P-value | Log2FC | Malignancy |
| 9294 | S1PR2 | PTC06 | Human | Thyroid | PTC | 4.17e-03 | 1.16e-01 | 0.2057 |
| 9294 | S1PR2 | ATC12 | Human | Thyroid | ATC | 1.21e-04 | 1.46e-01 | 0.34 |
| 9294 | S1PR2 | ATC13 | Human | Thyroid | ATC | 3.11e-50 | 8.98e-01 | 0.34 |
| 9294 | S1PR2 | ATC2 | Human | Thyroid | ATC | 5.35e-04 | 3.31e-01 | 0.34 |
| 9294 | S1PR2 | ATC4 | Human | Thyroid | ATC | 1.95e-09 | 2.26e-01 | 0.34 |
| 9294 | S1PR2 | ATC5 | Human | Thyroid | ATC | 5.98e-58 | 9.79e-01 | 0.34 |
| Page: 1 |
| Tissue | Expression Dynamics | Abbreviation |
| Thyroid | 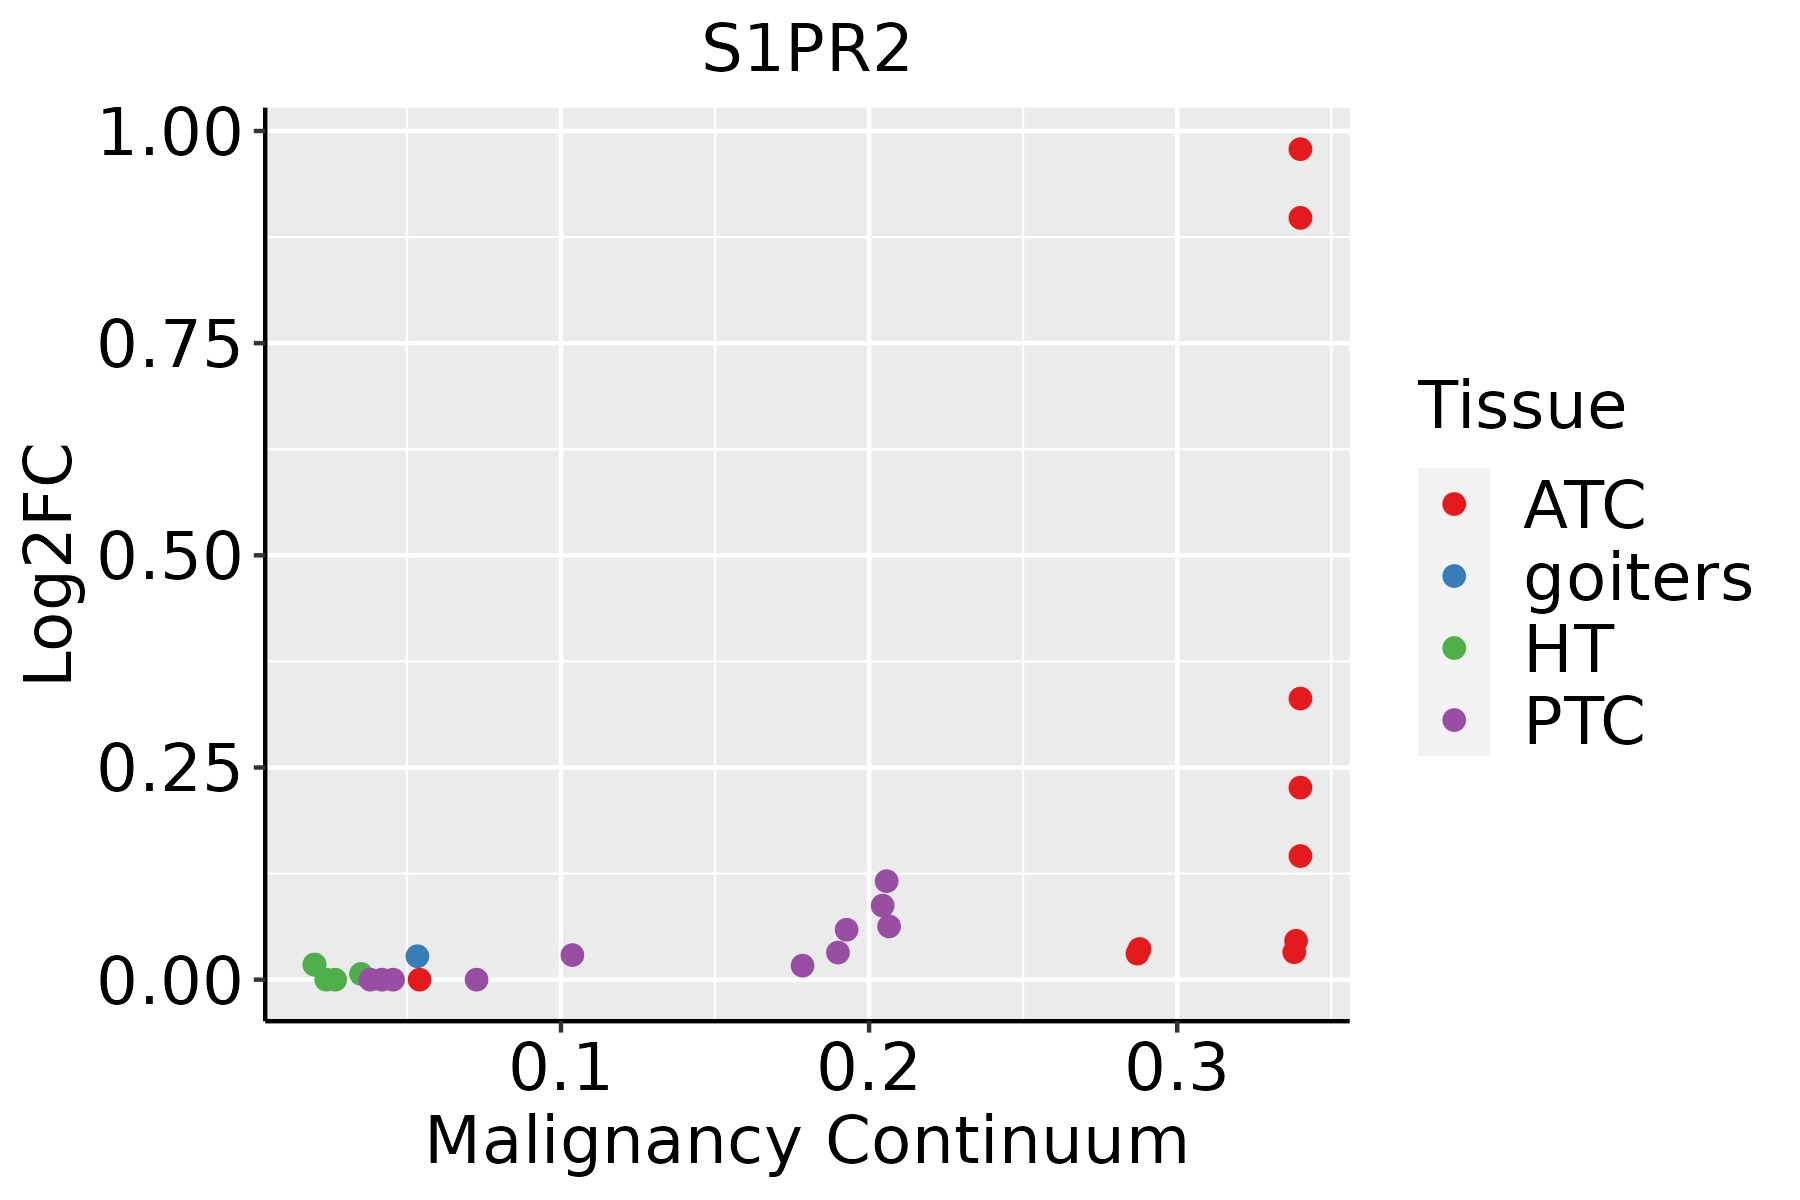 | ATC: Anaplastic thyroid cancer |
| HT: Hashimoto's thyroiditis | ||
| PTC: Papillary thyroid cancer |
| ∗log2FC in expression of this searched gene in stem-like cells from each diseased tissue sample relative to stem-like cells in normal samples in each tissue plotted against the malignancy continuum. Samples are colored based on if they are from different disease stage. |
Top |
Malignant transformation related pathway analysis |
| Find out the enriched GO biological processes and KEGG pathways involved in transition from healthy to precancer to cancer |
| Tissue | Disease Stage | Enriched GO biological Processes |
| Colorectum | AD |  |
| Colorectum | SER |  |
| Colorectum | MSS |  |
| Colorectum | MSI-H |  |
| Colorectum | FAP |  |
| ∗Top 15 enriched GO BP terms are showed in the bar plot of each disease state in each tissue. Each row represents a significant GO biological process which is colored according to the -log10(p.adjust). |
| Page: 1 2 3 4 5 6 7 8 9 |
| GO ID | Tissue | Disease Stage | Description | Gene Ratio | Bg Ratio | pvalue | p.adjust | Count |
| GO:001072018 | Thyroid | PTC | positive regulation of cell development | 138/5968 | 298/18723 | 1.13e-07 | 2.22e-06 | 138 |
| GO:003153220 | Thyroid | PTC | actin cytoskeleton reorganization | 60/5968 | 107/18723 | 1.91e-07 | 3.51e-06 | 60 |
| GO:001821017 | Thyroid | PTC | peptidyl-threonine modification | 66/5968 | 125/18723 | 9.50e-07 | 1.43e-05 | 66 |
| GO:001810717 | Thyroid | PTC | peptidyl-threonine phosphorylation | 62/5968 | 116/18723 | 1.16e-06 | 1.69e-05 | 62 |
| GO:0002064112 | Thyroid | PTC | epithelial cell development | 101/5968 | 220/18723 | 8.53e-06 | 9.74e-05 | 101 |
| GO:000188519 | Thyroid | PTC | endothelial cell development | 37/5968 | 64/18723 | 1.62e-05 | 1.70e-04 | 37 |
| GO:0061028111 | Thyroid | PTC | establishment of endothelial barrier | 27/5968 | 46/18723 | 1.57e-04 | 1.21e-03 | 27 |
| GO:0003158111 | Thyroid | PTC | endothelium development | 62/5968 | 136/18723 | 5.45e-04 | 3.48e-03 | 62 |
| GO:004544619 | Thyroid | PTC | endothelial cell differentiation | 55/5968 | 118/18723 | 5.64e-04 | 3.59e-03 | 55 |
| GO:001481212 | Thyroid | PTC | muscle cell migration | 50/5968 | 110/18723 | 1.93e-03 | 1.04e-02 | 50 |
| GO:004684711 | Thyroid | PTC | filopodium assembly | 31/5968 | 62/18723 | 2.23e-03 | 1.18e-02 | 31 |
| GO:00149095 | Thyroid | PTC | smooth muscle cell migration | 44/5968 | 97/18723 | 3.65e-03 | 1.76e-02 | 44 |
| GO:0010800 | Thyroid | PTC | positive regulation of peptidyl-threonine phosphorylation | 17/5968 | 30/18723 | 4.31e-03 | 2.04e-02 | 17 |
| GO:19015505 | Thyroid | PTC | regulation of endothelial cell development | 11/5968 | 17/18723 | 5.46e-03 | 2.49e-02 | 11 |
| GO:19031405 | Thyroid | PTC | regulation of establishment of endothelial barrier | 11/5968 | 17/18723 | 5.46e-03 | 2.49e-02 | 11 |
| GO:00107991 | Thyroid | PTC | regulation of peptidyl-threonine phosphorylation | 23/5968 | 47/18723 | 1.09e-02 | 4.35e-02 | 23 |
| GO:001072022 | Thyroid | ATC | positive regulation of cell development | 146/6293 | 298/18723 | 2.36e-08 | 4.56e-07 | 146 |
| GO:0031532111 | Thyroid | ATC | actin cytoskeleton reorganization | 62/6293 | 107/18723 | 2.01e-07 | 3.17e-06 | 62 |
| GO:001810718 | Thyroid | ATC | peptidyl-threonine phosphorylation | 63/6293 | 116/18723 | 3.47e-06 | 3.89e-05 | 63 |
| GO:001821018 | Thyroid | ATC | peptidyl-threonine modification | 66/6293 | 125/18723 | 7.36e-06 | 7.56e-05 | 66 |
| Page: 1 2 |
| Pathway ID | Tissue | Disease Stage | Description | Gene Ratio | Bg Ratio | pvalue | p.adjust | qvalue | Count |
| Page: 1 |
Top |
Cell-cell communication analysis |
| Identification of potential cell-cell interactions between two cell types and their ligand-receptor pairs for different disease states |
| Ligand | Receptor | LRpair | Pathway | Tissue | Disease Stage |
| Page: 1 |
Top |
Single-cell gene regulatory network inference analysis |
| Find out the significant the regulons (TFs) and the target genes of each regulon across cell types for different disease states |
| TF | Cell Type | Tissue | Disease Stage | Target Gene | RSS | Regulon Activity |
| ∗The dot plots of a searched regulon are shown for all cell subpopulations in each disease state of each tissue based on the regulon specific score inferred using pySCENIC and by calculating the average expression. |
| Page: 1 |
Top |
Somatic mutation of malignant transformation related genes |
| Annotation of somatic variants for genes involved in malignant transformation |
| Hugo Symbol | Variant Class | Variant Classification | dbSNP RS | HGVSc | HGVSp | HGVSp Short | SWISSPROT | BIOTYPE | SIFT | PolyPhen | Tumor Sample Barcode | Tissue | Histology | Sex | Age | Stage | Therapy Types | Drugs | Outcome |
| S1PR2 | SNV | Missense_Mutation | c.580N>A | p.Val194Met | p.V194M | O95136 | protein_coding | deleterious(0) | probably_damaging(0.993) | TCGA-2W-A8YY-01 | Cervix | cervical & endocervical cancer | Female | <65 | I/II | Chemotherapy | cisplatin | CR | |
| S1PR2 | SNV | Missense_Mutation | novel | c.346N>G | p.Leu116Val | p.L116V | O95136 | protein_coding | deleterious(0) | possibly_damaging(0.817) | TCGA-VS-A9UY-01 | Cervix | cervical & endocervical cancer | Female | <65 | I/II | Chemotherapy | cisplatin | PD |
| S1PR2 | SNV | Missense_Mutation | c.422G>A | p.Gly141Asp | p.G141D | O95136 | protein_coding | tolerated(1) | probably_damaging(0.947) | TCGA-CA-6717-01 | Colorectum | colon adenocarcinoma | Male | <65 | I/II | Chemotherapy | oxaliplatin | CR | |
| S1PR2 | SNV | Missense_Mutation | c.98G>A | p.Arg33His | p.R33H | O95136 | protein_coding | tolerated(0.12) | possibly_damaging(0.803) | TCGA-G4-6309-01 | Colorectum | colon adenocarcinoma | Female | <65 | III/IV | Chemotherapy | xeloda | PD | |
| S1PR2 | SNV | Missense_Mutation | rs759886451 | c.259G>A | p.Val87Ile | p.V87I | O95136 | protein_coding | tolerated(1) | benign(0.001) | TCGA-AF-3911-01 | Colorectum | rectum adenocarcinoma | Male | <65 | III/IV | Chemotherapy | 5-fu | PD |
| S1PR2 | SNV | Missense_Mutation | c.322N>T | p.Arg108Trp | p.R108W | O95136 | protein_coding | deleterious(0) | probably_damaging(1) | TCGA-A5-A0VO-01 | Endometrium | uterine corpus endometrioid carcinoma | Female | <65 | I/II | Unknown | Unknown | SD | |
| S1PR2 | SNV | Missense_Mutation | rs752820109 | c.379G>A | p.Ala127Thr | p.A127T | O95136 | protein_coding | deleterious(0) | probably_damaging(0.999) | TCGA-AX-A06F-01 | Endometrium | uterine corpus endometrioid carcinoma | Female | <65 | III/IV | Chemotherapy | carboplatin | SD |
| S1PR2 | SNV | Missense_Mutation | novel | c.204G>A | p.Met68Ile | p.M68I | O95136 | protein_coding | deleterious(0) | possibly_damaging(0.87) | TCGA-AX-A1CE-01 | Endometrium | uterine corpus endometrioid carcinoma | Female | <65 | I/II | Unspecific | Paclitaxel | SD |
| S1PR2 | SNV | Missense_Mutation | novel | c.192N>A | p.Phe64Leu | p.F64L | O95136 | protein_coding | tolerated(0.13) | benign(0.017) | TCGA-AX-A2HC-01 | Endometrium | uterine corpus endometrioid carcinoma | Female | <65 | III/IV | Chemotherapy | paclitaxel | PD |
| S1PR2 | SNV | Missense_Mutation | rs141230424 | c.632N>A | p.Arg211His | p.R211H | O95136 | protein_coding | deleterious(0.03) | benign(0.024) | TCGA-AX-A2HD-01 | Endometrium | uterine corpus endometrioid carcinoma | Female | >=65 | III/IV | Unknown | Unknown | SD |
| Page: 1 2 3 |
Top |
Related drugs of malignant transformation related genes |
| Identification of chemicals and drugs interact with genes involved in malignant transfromation |
| (DGIdb 4.0) |
| Entrez ID | Symbol | Category | Interaction Types | Drug Claim Name | Drug Name | PMIDs |
| 9294 | S1PR2 | CLINICALLY ACTIONABLE, G PROTEIN COUPLED RECEPTOR, DRUGGABLE GENOME | agonist | 329968432 | ||
| 9294 | S1PR2 | CLINICALLY ACTIONABLE, G PROTEIN COUPLED RECEPTOR, DRUGGABLE GENOME | US8975409, Example 9(3) | |||
| 9294 | S1PR2 | CLINICALLY ACTIONABLE, G PROTEIN COUPLED RECEPTOR, DRUGGABLE GENOME | GNF-PF-2272 | CHEMBL601757 | ||
| 9294 | S1PR2 | CLINICALLY ACTIONABLE, G PROTEIN COUPLED RECEPTOR, DRUGGABLE GENOME | agonist | 252827367 | OZANIMOD | |
| 9294 | S1PR2 | CLINICALLY ACTIONABLE, G PROTEIN COUPLED RECEPTOR, DRUGGABLE GENOME | GNF-PF-1919 | CHEMBL576409 | ||
| 9294 | S1PR2 | CLINICALLY ACTIONABLE, G PROTEIN COUPLED RECEPTOR, DRUGGABLE GENOME | US8975409, Example 13 | |||
| 9294 | S1PR2 | CLINICALLY ACTIONABLE, G PROTEIN COUPLED RECEPTOR, DRUGGABLE GENOME | agonist | CHEMBL544665 | FINGOLIMOD HYDROCHLORIDE | |
| 9294 | S1PR2 | CLINICALLY ACTIONABLE, G PROTEIN COUPLED RECEPTOR, DRUGGABLE GENOME | Jte 013 | |||
| 9294 | S1PR2 | CLINICALLY ACTIONABLE, G PROTEIN COUPLED RECEPTOR, DRUGGABLE GENOME | antagonist | 315661299 | ||
| 9294 | S1PR2 | CLINICALLY ACTIONABLE, G PROTEIN COUPLED RECEPTOR, DRUGGABLE GENOME | modulator | CHEMBL3707374 | AMISELIMOD HYDROCHLORIDE |
| Page: 1 2 |

Copyright 2023-Present -The University of Texas Health Science Center at Houston |