
|
|||||
|
 | |
| |
| |
| |
| |
| |
|
Gene: S100P |
Gene summary for S100P |
| Gene information | Species | Human | Gene symbol | S100P | Gene ID | 6286 |
| Gene name | S100 calcium binding protein P | |
| Gene Alias | MIG9 | |
| Cytomap | 4p16.1 | |
| Gene Type | protein-coding | GO ID | GO:0001667 | UniProtAcc | P25815 |
Top |
Malignant transformation analysis |
| Identification of the aberrant gene expression in precancerous and cancerous lesions by comparing the gene expression of stem-like cells in diseased tissues with normal stem cells |
| Entrez ID | Symbol | Replicates | Species | Organ | Tissue | Adj P-value | Log2FC | Malignancy |
| 6286 | S100P | GSM4909281 | Human | Breast | IDC | 3.92e-60 | 1.20e+00 | 0.21 |
| 6286 | S100P | GSM4909282 | Human | Breast | IDC | 1.49e-81 | 1.29e+00 | -0.0288 |
| 6286 | S100P | GSM4909285 | Human | Breast | IDC | 2.51e-31 | 6.40e-01 | 0.21 |
| 6286 | S100P | GSM4909286 | Human | Breast | IDC | 1.72e-30 | 5.58e-01 | 0.1081 |
| 6286 | S100P | GSM4909287 | Human | Breast | IDC | 2.73e-05 | 4.60e-01 | 0.2057 |
| 6286 | S100P | GSM4909288 | Human | Breast | IDC | 1.08e-04 | 5.67e-01 | 0.0988 |
| 6286 | S100P | GSM4909290 | Human | Breast | IDC | 3.62e-09 | 5.70e-01 | 0.2096 |
| 6286 | S100P | GSM4909292 | Human | Breast | IDC | 4.57e-06 | 8.61e-01 | 0.1236 |
| 6286 | S100P | GSM4909295 | Human | Breast | IDC | 1.09e-11 | 7.64e-01 | 0.0898 |
| 6286 | S100P | GSM4909296 | Human | Breast | IDC | 2.19e-07 | 4.18e-01 | 0.1524 |
| 6286 | S100P | GSM4909304 | Human | Breast | IDC | 1.38e-124 | 1.79e+00 | 0.1636 |
| 6286 | S100P | GSM4909307 | Human | Breast | IDC | 6.36e-04 | 2.63e-01 | 0.1569 |
| 6286 | S100P | GSM4909313 | Human | Breast | IDC | 6.35e-13 | 7.17e-01 | 0.0391 |
| 6286 | S100P | GSM4909317 | Human | Breast | IDC | 1.14e-33 | 9.83e-01 | 0.1355 |
| 6286 | S100P | NCCBC14 | Human | Breast | DCIS | 2.79e-05 | 4.78e-01 | 0.2021 |
| 6286 | S100P | HSIL_HPV_2 | Human | Cervix | HSIL_HPV | 2.84e-11 | 3.72e-01 | 0.0208 |
| 6286 | S100P | Tumor | Human | Cervix | CC | 6.19e-31 | 6.56e-01 | 0.1241 |
| 6286 | S100P | sample1 | Human | Cervix | CC | 1.64e-02 | 2.34e-01 | 0.0959 |
| 6286 | S100P | sample3 | Human | Cervix | CC | 2.07e-58 | 9.06e-01 | 0.1387 |
| 6286 | S100P | H2 | Human | Cervix | HSIL_HPV | 7.08e-15 | 5.38e-01 | 0.0632 |
| Page: 1 2 3 4 5 6 7 8 |
| Tissue | Expression Dynamics | Abbreviation |
| Breast | 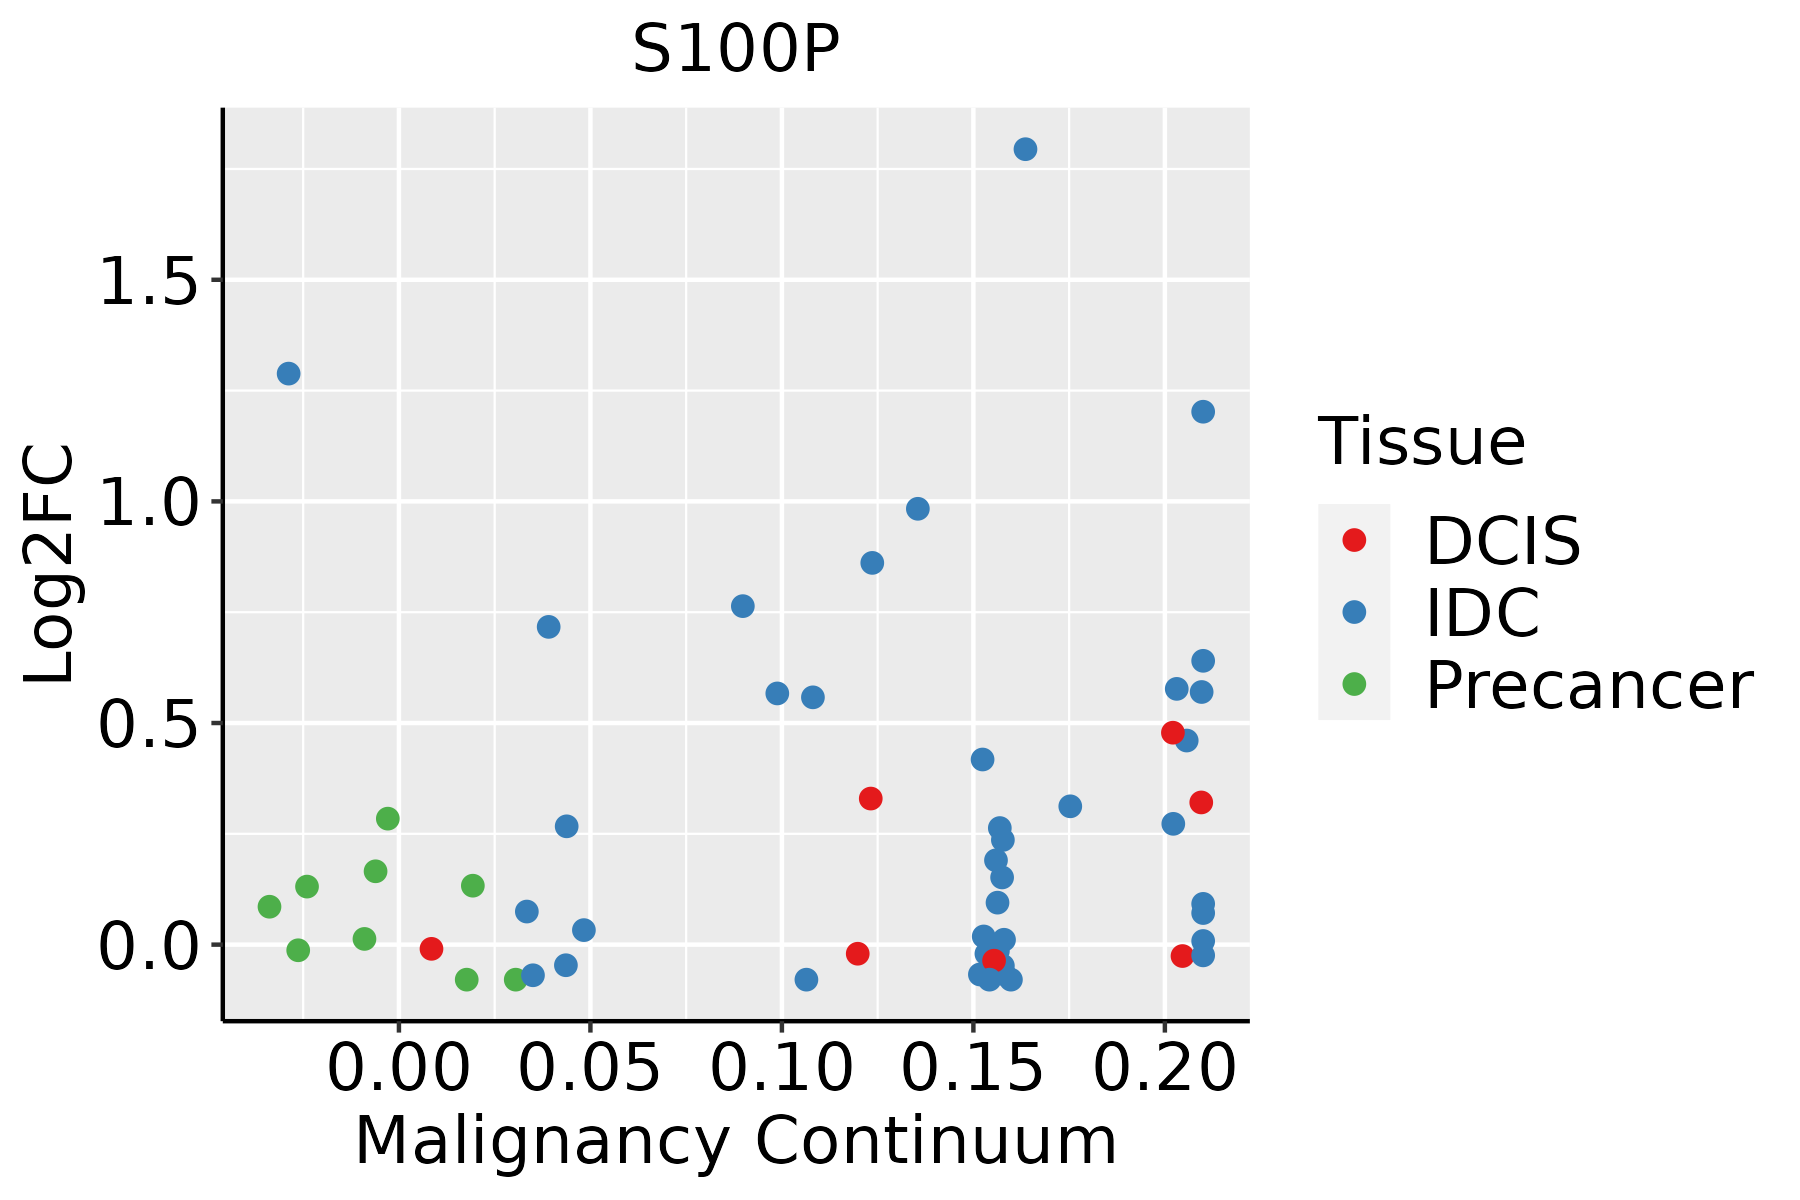 | IDC: Invasive ductal carcinoma |
| DCIS: Ductal carcinoma in situ | ||
| Precancer(BRCA1-mut): Precancerous lesion from BRCA1 mutation carriers | ||
| Cervix | 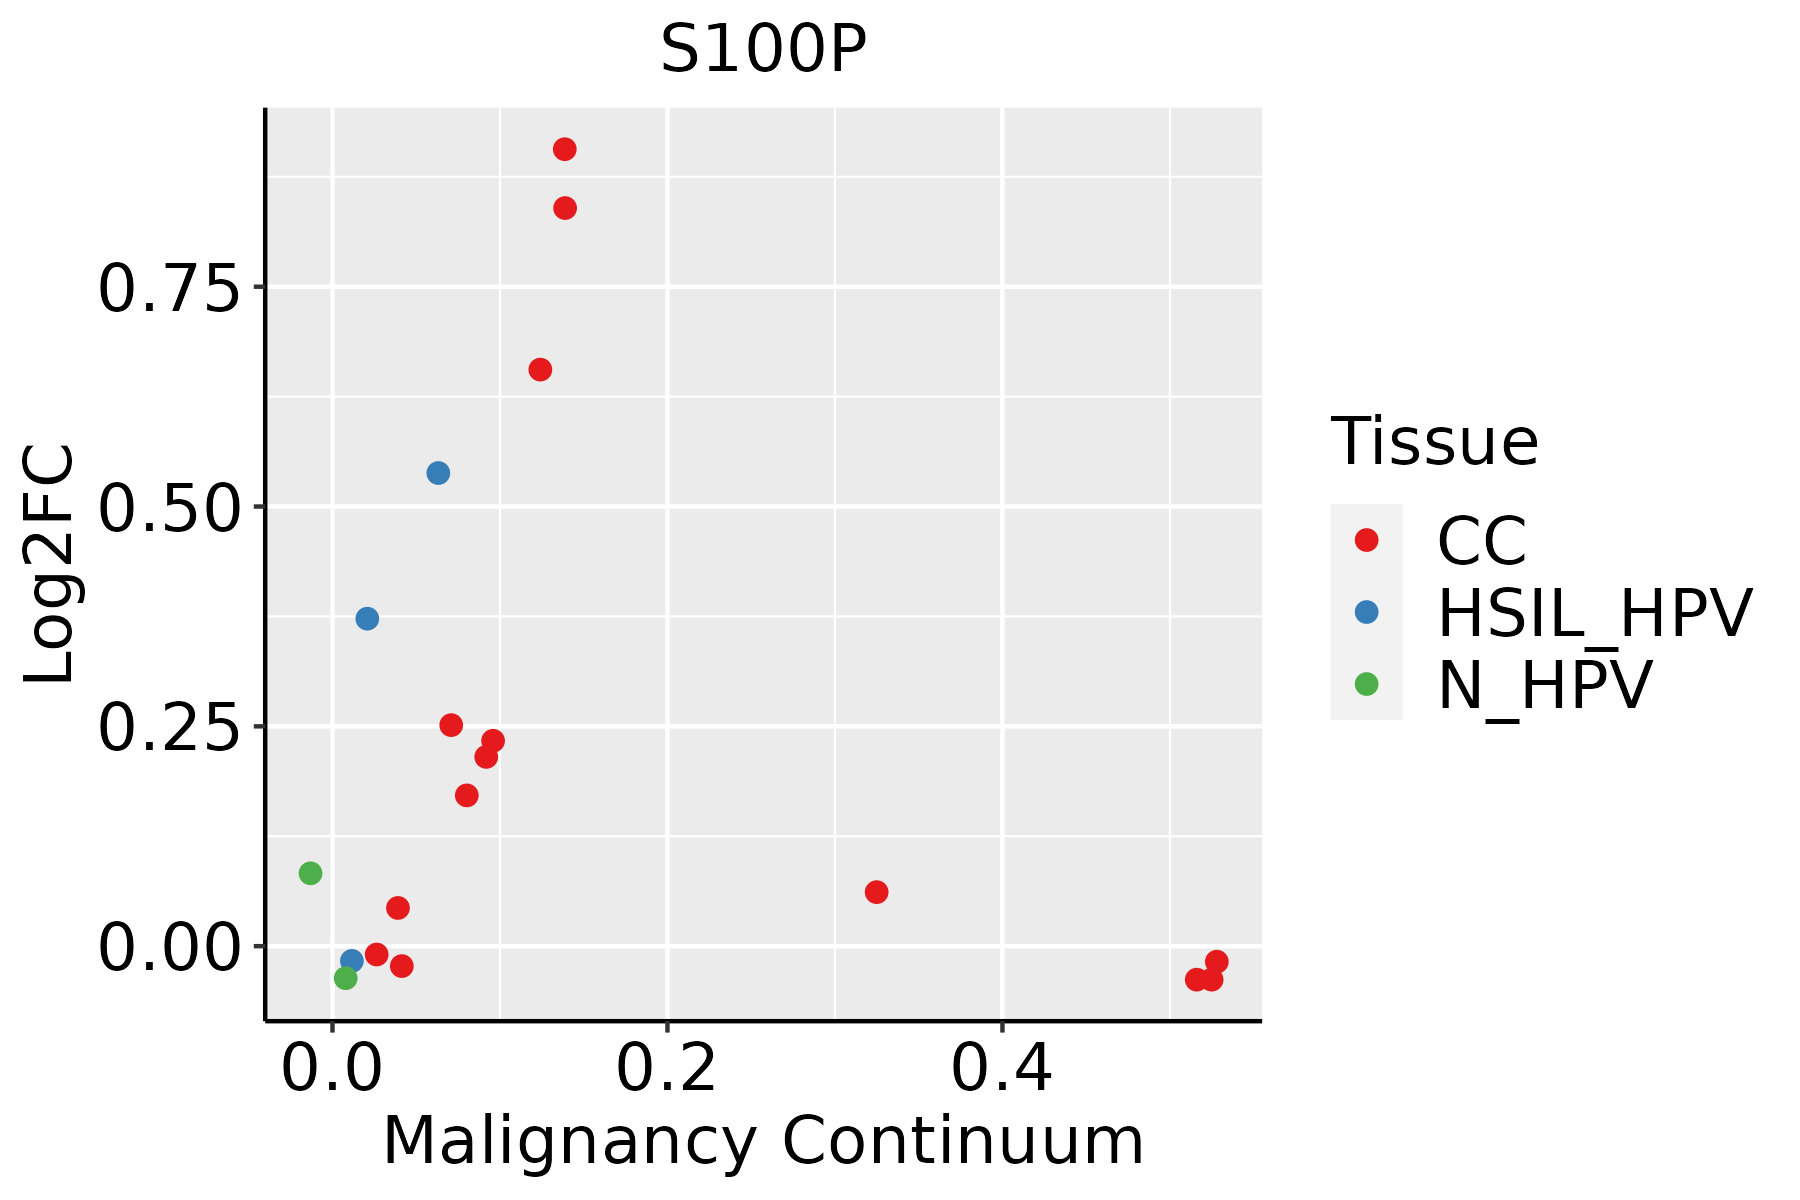 | CC: Cervix cancer |
| HSIL_HPV: HPV-infected high-grade squamous intraepithelial lesions | ||
| N_HPV: HPV-infected normal cervix | ||
| Colorectum (GSE201348) |  | FAP: Familial adenomatous polyposis |
| CRC: Colorectal cancer | ||
| Colorectum (HTA11) |  | AD: Adenomas |
| SER: Sessile serrated lesions | ||
| MSI-H: Microsatellite-high colorectal cancer | ||
| MSS: Microsatellite stable colorectal cancer | ||
| Esophagus | 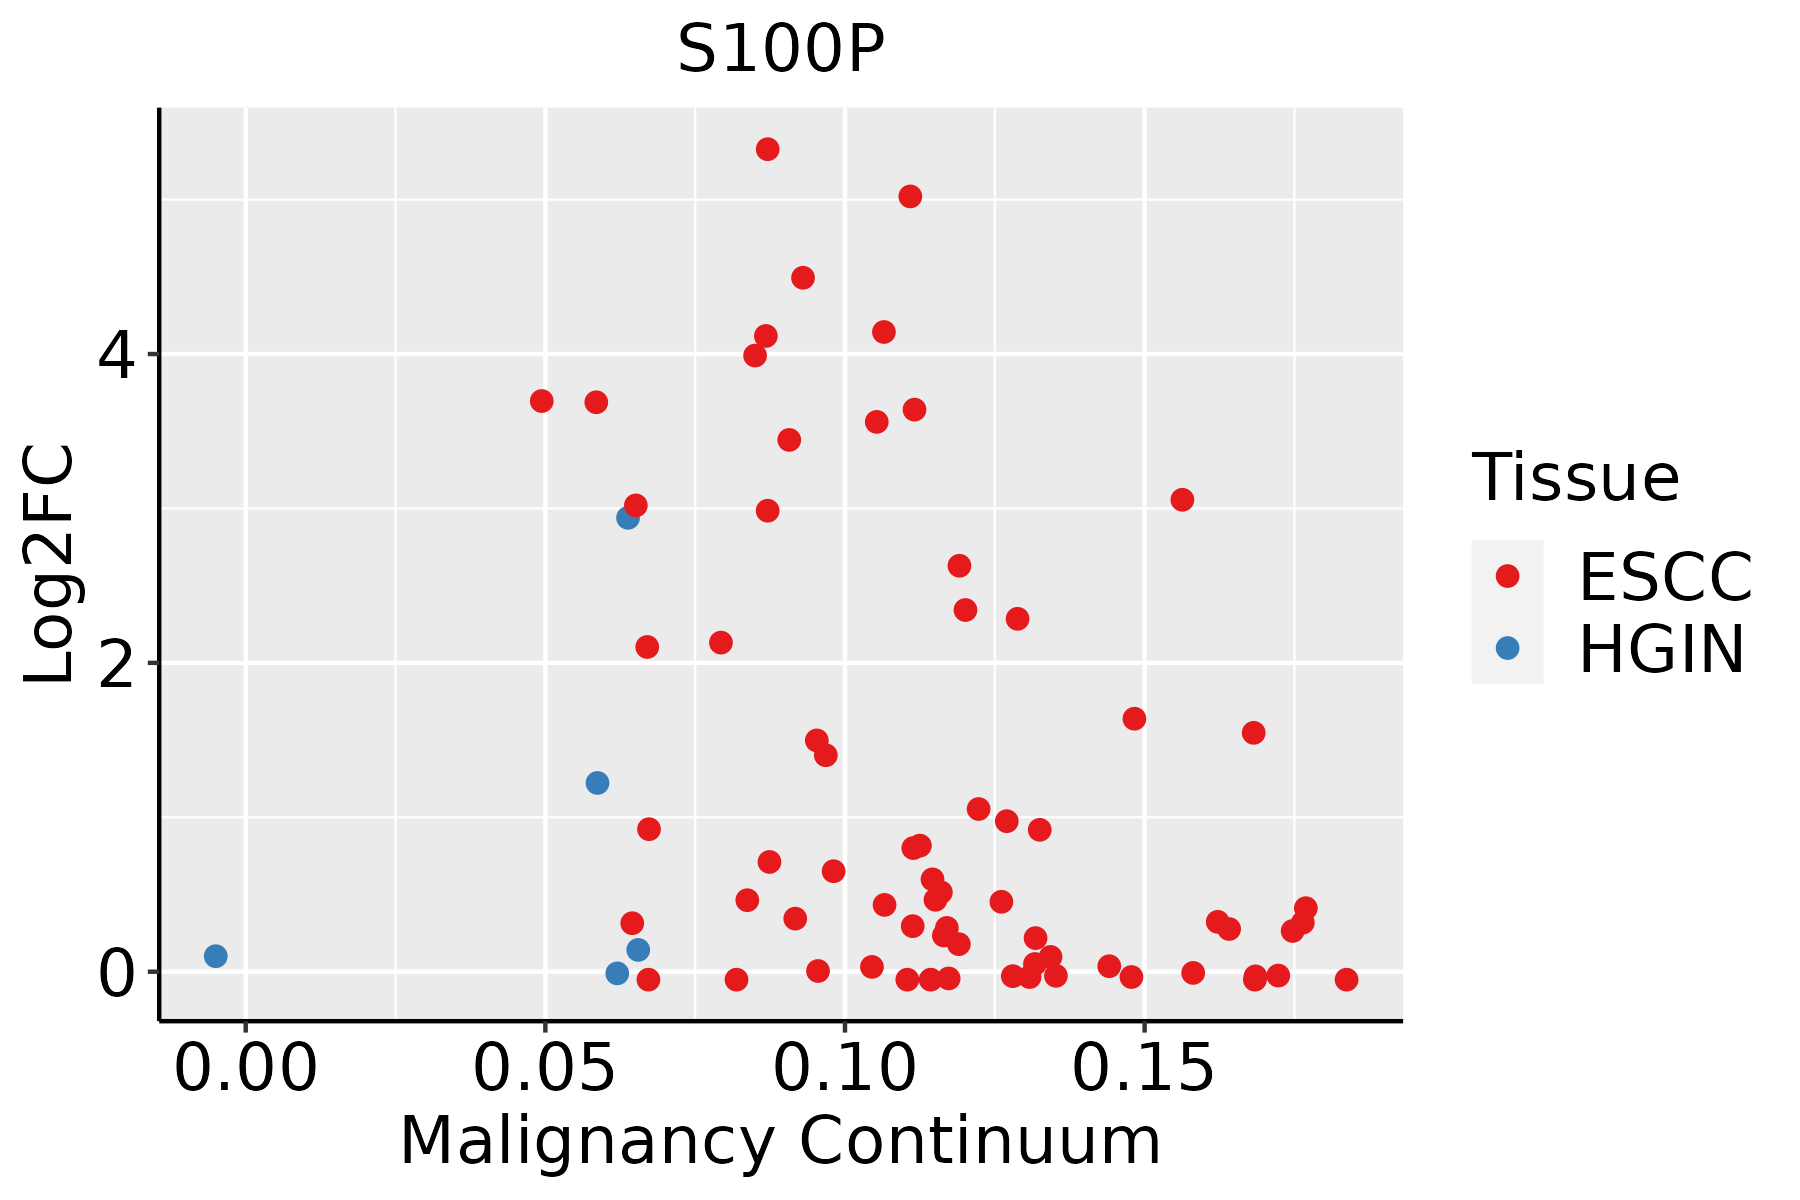 | ESCC: Esophageal squamous cell carcinoma |
| HGIN: High-grade intraepithelial neoplasias | ||
| LGIN: Low-grade intraepithelial neoplasias | ||
| GC | 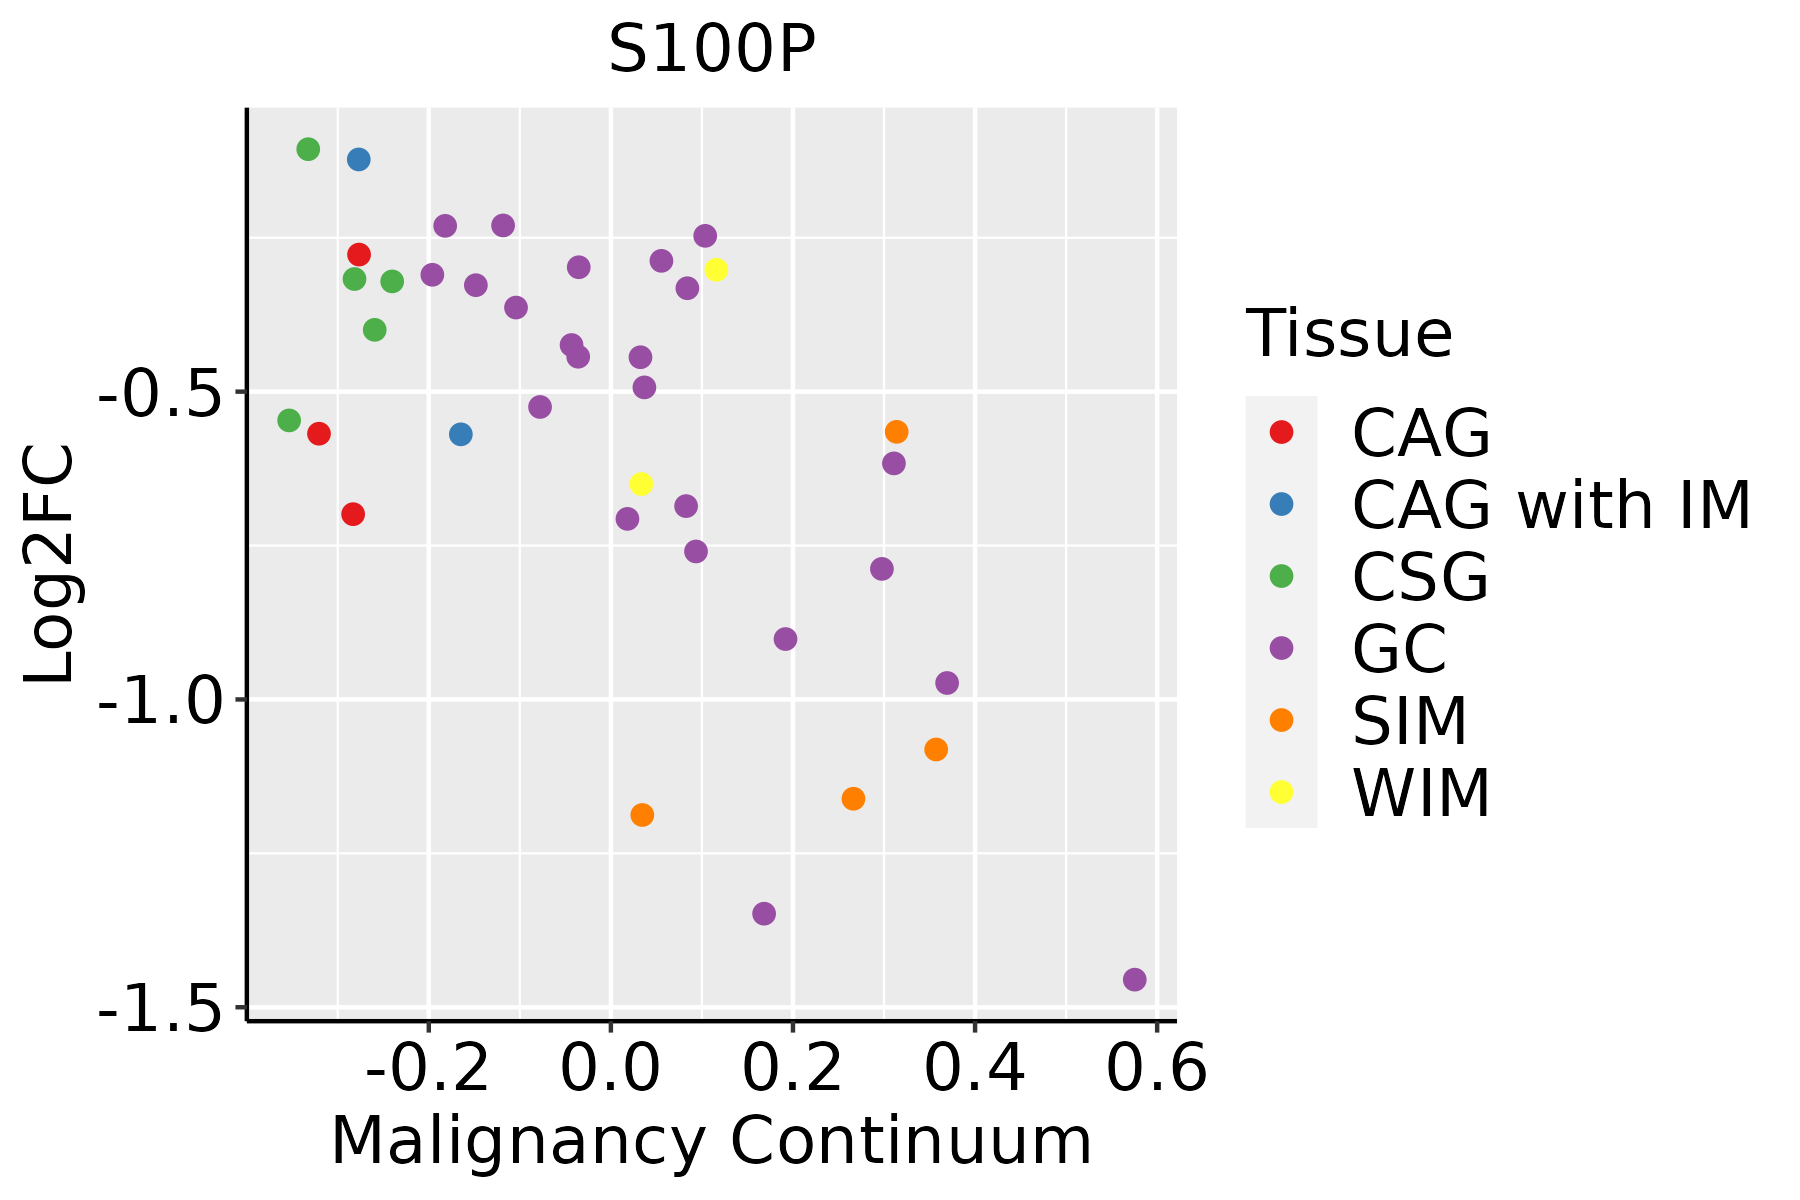 | CAG: Chronic atrophic gastritis |
| CAG with IM: Chronic atrophic gastritis with intestinal metaplasia | ||
| CSG: Chronic superficial gastritis | ||
| GC: Gastric cancer | ||
| SIM: Severe intestinal metaplasia | ||
| WIM: Wild intestinal metaplasia | ||
| Liver | 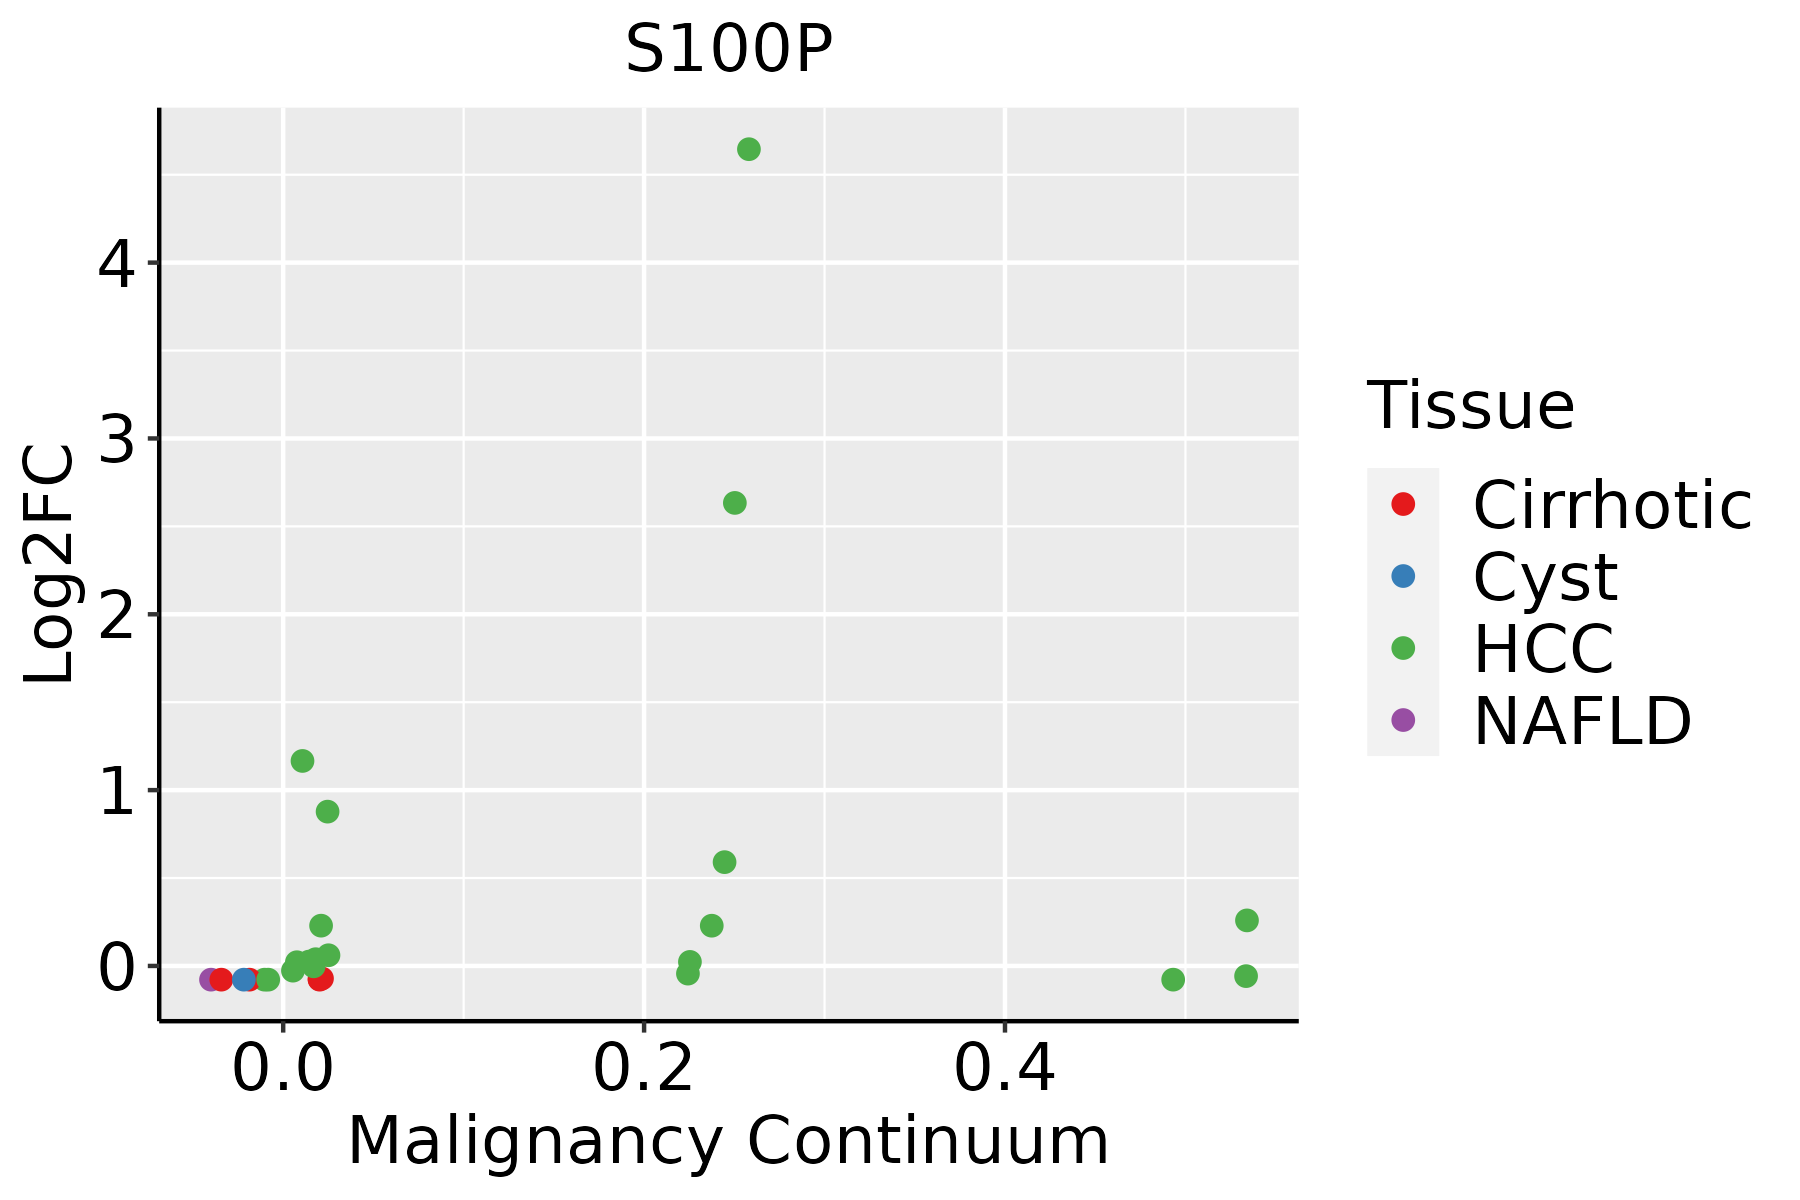 | HCC: Hepatocellular carcinoma |
| NAFLD: Non-alcoholic fatty liver disease | ||
| Lung |  | AAH: Atypical adenomatous hyperplasia |
| AIS: Adenocarcinoma in situ | ||
| IAC: Invasive lung adenocarcinoma | ||
| MIA: Minimally invasive adenocarcinoma | ||
| Oral Cavity | 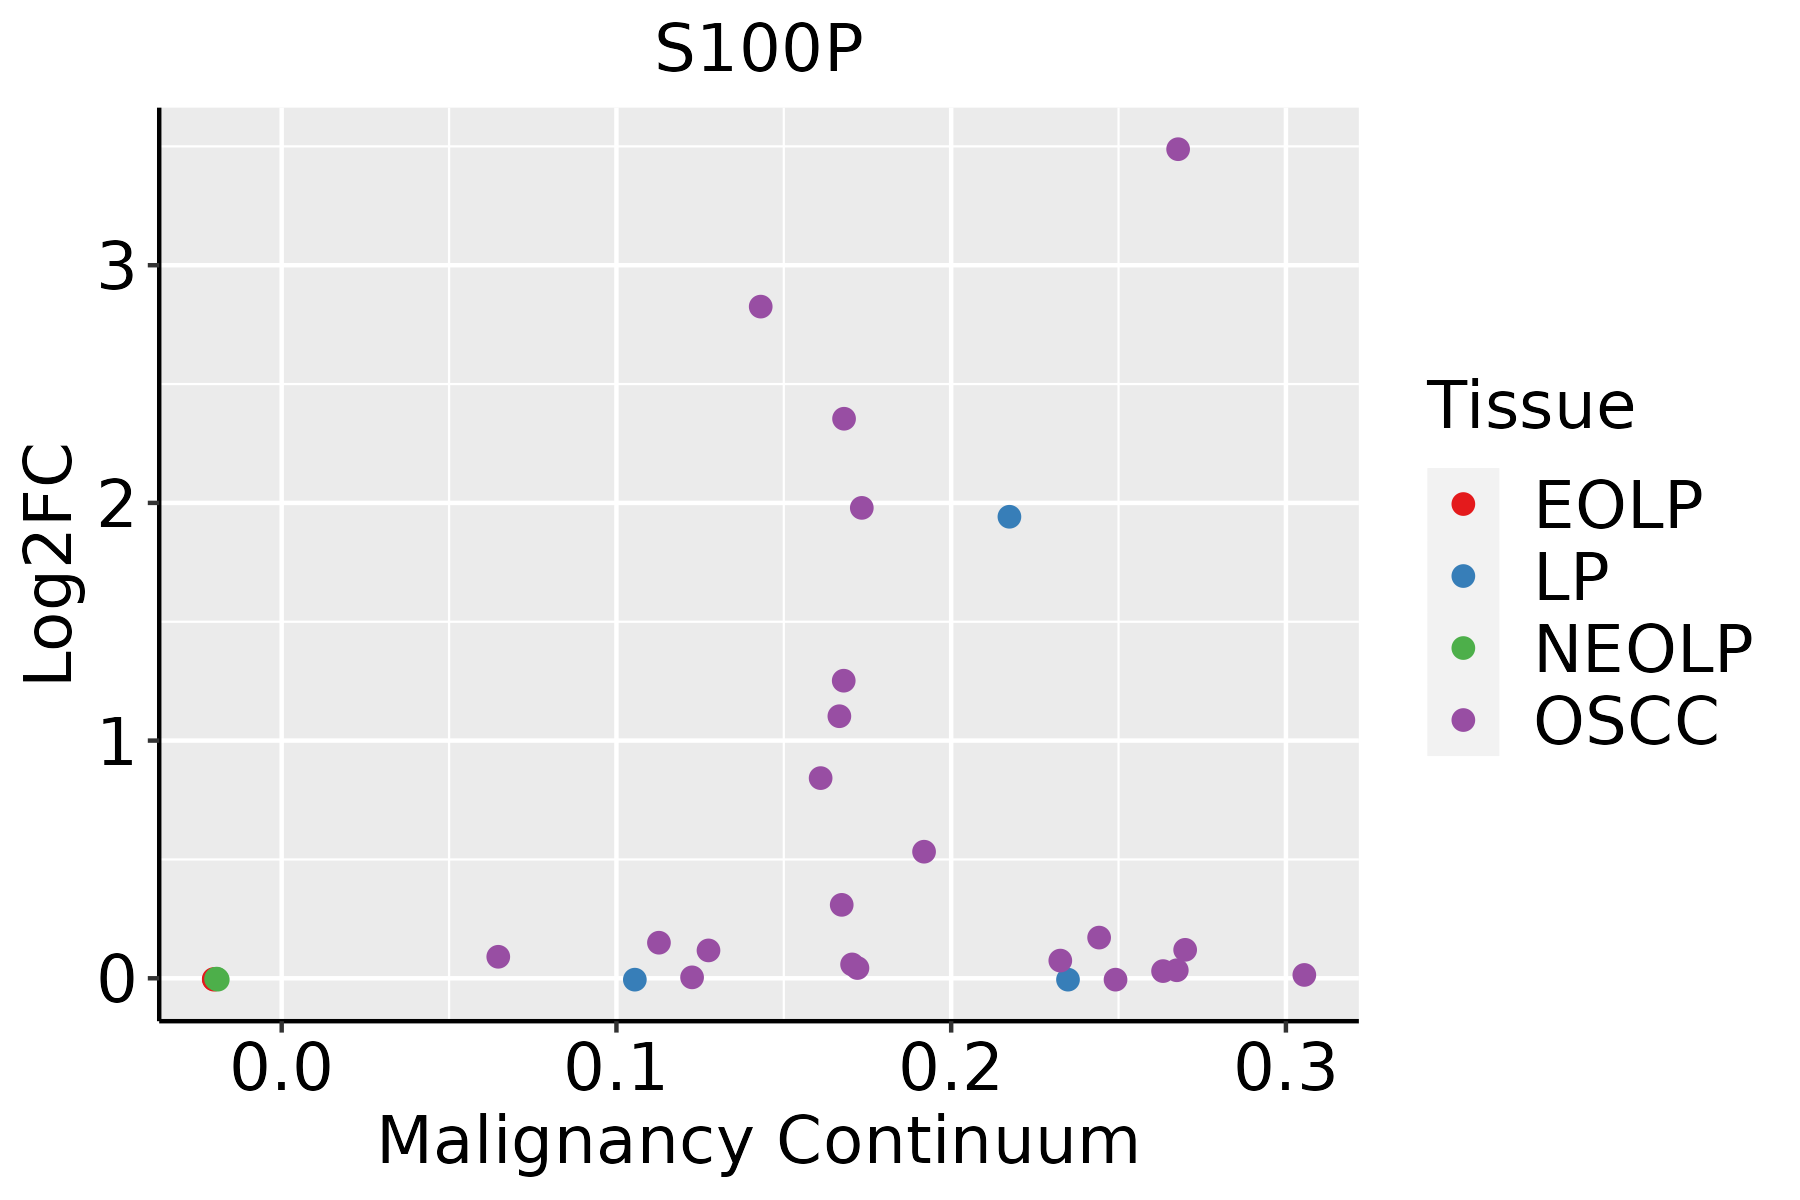 | EOLP: Erosive Oral lichen planus |
| LP: leukoplakia | ||
| NEOLP: Non-erosive oral lichen planus | ||
| OSCC: Oral squamous cell carcinoma |
| ∗log2FC in expression of this searched gene in stem-like cells from each diseased tissue sample relative to stem-like cells in normal samples in each tissue plotted against the malignancy continuum. Samples are colored based on if they are from different disease stage. |
Top |
Malignant transformation related pathway analysis |
| Find out the enriched GO biological processes and KEGG pathways involved in transition from healthy to precancer to cancer |
| Tissue | Disease Stage | Enriched GO biological Processes |
| Colorectum | AD |  |
| Colorectum | SER |  |
| Colorectum | MSS |  |
| Colorectum | MSI-H |  |
| Colorectum | FAP |  |
| ∗Top 15 enriched GO BP terms are showed in the bar plot of each disease state in each tissue. Each row represents a significant GO biological process which is colored according to the -log10(p.adjust). |
| Page: 1 2 3 4 5 6 7 8 9 |
| GO ID | Tissue | Disease Stage | Description | Gene Ratio | Bg Ratio | pvalue | p.adjust | Count |
| GO:000166714 | Breast | IDC | ameboidal-type cell migration | 64/1434 | 475/18723 | 6.65e-06 | 2.05e-04 | 64 |
| GO:001063112 | Breast | IDC | epithelial cell migration | 51/1434 | 357/18723 | 1.14e-05 | 3.08e-04 | 51 |
| GO:009013212 | Breast | IDC | epithelium migration | 51/1434 | 360/18723 | 1.44e-05 | 3.70e-04 | 51 |
| GO:009013012 | Breast | IDC | tissue migration | 51/1434 | 365/18723 | 2.11e-05 | 5.11e-04 | 51 |
| GO:004354211 | Breast | IDC | endothelial cell migration | 40/1434 | 279/18723 | 8.97e-05 | 1.74e-03 | 40 |
| GO:001063121 | Breast | DCIS | epithelial cell migration | 51/1390 | 357/18723 | 4.83e-06 | 1.43e-04 | 51 |
| GO:009013221 | Breast | DCIS | epithelium migration | 51/1390 | 360/18723 | 6.14e-06 | 1.75e-04 | 51 |
| GO:009013021 | Breast | DCIS | tissue migration | 51/1390 | 365/18723 | 9.09e-06 | 2.45e-04 | 51 |
| GO:000166723 | Breast | DCIS | ameboidal-type cell migration | 62/1390 | 475/18723 | 9.60e-06 | 2.56e-04 | 62 |
| GO:004354221 | Breast | DCIS | endothelial cell migration | 40/1390 | 279/18723 | 4.54e-05 | 9.49e-04 | 40 |
| GO:009013210 | Cervix | CC | epithelium migration | 90/2311 | 360/18723 | 2.45e-11 | 6.11e-09 | 90 |
| GO:00016679 | Cervix | CC | ameboidal-type cell migration | 110/2311 | 475/18723 | 2.66e-11 | 6.36e-09 | 110 |
| GO:001063110 | Cervix | CC | epithelial cell migration | 89/2311 | 357/18723 | 3.72e-11 | 8.54e-09 | 89 |
| GO:009013010 | Cervix | CC | tissue migration | 90/2311 | 365/18723 | 5.42e-11 | 1.05e-08 | 90 |
| GO:00435427 | Cervix | CC | endothelial cell migration | 60/2311 | 279/18723 | 1.05e-05 | 2.33e-04 | 60 |
| GO:001063113 | Cervix | HSIL_HPV | epithelial cell migration | 33/737 | 357/18723 | 5.28e-06 | 2.04e-04 | 33 |
| GO:000166715 | Cervix | HSIL_HPV | ameboidal-type cell migration | 40/737 | 475/18723 | 5.48e-06 | 2.07e-04 | 40 |
| GO:009013213 | Cervix | HSIL_HPV | epithelium migration | 33/737 | 360/18723 | 6.31e-06 | 2.29e-04 | 33 |
| GO:009013013 | Cervix | HSIL_HPV | tissue migration | 33/737 | 365/18723 | 8.43e-06 | 2.97e-04 | 33 |
| GO:004354212 | Cervix | HSIL_HPV | endothelial cell migration | 24/737 | 279/18723 | 2.95e-04 | 4.83e-03 | 24 |
| Page: 1 2 3 |
| Pathway ID | Tissue | Disease Stage | Description | Gene Ratio | Bg Ratio | pvalue | p.adjust | qvalue | Count |
| Page: 1 |
Top |
Cell-cell communication analysis |
| Identification of potential cell-cell interactions between two cell types and their ligand-receptor pairs for different disease states |
| Ligand | Receptor | LRpair | Pathway | Tissue | Disease Stage |
| Page: 1 |
Top |
Single-cell gene regulatory network inference analysis |
| Find out the significant the regulons (TFs) and the target genes of each regulon across cell types for different disease states |
| TF | Cell Type | Tissue | Disease Stage | Target Gene | RSS | Regulon Activity |
| ∗The dot plots of a searched regulon are shown for all cell subpopulations in each disease state of each tissue based on the regulon specific score inferred using pySCENIC and by calculating the average expression. |
| Page: 1 |
Top |
Somatic mutation of malignant transformation related genes |
| Annotation of somatic variants for genes involved in malignant transformation |
| Hugo Symbol | Variant Class | Variant Classification | dbSNP RS | HGVSc | HGVSp | HGVSp Short | SWISSPROT | BIOTYPE | SIFT | PolyPhen | Tumor Sample Barcode | Tissue | Histology | Sex | Age | Stage | Therapy Types | Drugs | Outcome |
| S100P | deletion | In_Frame_Del | c.115_117delAAG | p.Lys39del | p.K39del | P25815 | protein_coding | TCGA-A2-A1G4-01 | Breast | breast invasive carcinoma | Female | >=65 | III/IV | Chemotherapy | adriamycin | SD | |||
| S100P | deletion | Frame_Shift_Del | c.265delN | p.Phe89LeufsTer43 | p.F89Lfs*43 | P25815 | protein_coding | TCGA-BH-A0DO-01 | Breast | breast invasive carcinoma | Female | >=65 | I/II | Unknown | Unknown | SD | |||
| S100P | SNV | Missense_Mutation | rs770673207 | c.245C>T | p.Thr82Met | p.T82M | P25815 | protein_coding | deleterious(0.01) | benign(0.165) | TCGA-AA-3510-01 | Colorectum | colon adenocarcinoma | Male | >=65 | I/II | Unknown | Unknown | SD |
| S100P | SNV | Missense_Mutation | rs770673207 | c.245C>T | p.Thr82Met | p.T82M | P25815 | protein_coding | deleterious(0.01) | benign(0.165) | TCGA-A5-A0G2-01 | Endometrium | uterine corpus endometrioid carcinoma | Female | <65 | III/IV | Unknown | Unknown | SD |
| S100P | SNV | Missense_Mutation | c.20N>T | p.Ala7Val | p.A7V | P25815 | protein_coding | deleterious(0.01) | probably_damaging(0.966) | TCGA-AP-A059-01 | Endometrium | uterine corpus endometrioid carcinoma | Female | >=65 | I/II | Unknown | Unknown | SD | |
| S100P | SNV | Missense_Mutation | novel | c.251N>T | p.Ala84Val | p.A84V | P25815 | protein_coding | tolerated(0.06) | benign(0) | TCGA-AP-A059-01 | Endometrium | uterine corpus endometrioid carcinoma | Female | >=65 | I/II | Unknown | Unknown | SD |
| S100P | SNV | Missense_Mutation | c.194N>A | p.Gly65Glu | p.G65E | P25815 | protein_coding | tolerated(0.09) | probably_damaging(0.953) | TCGA-49-AARN-01 | Lung | lung adenocarcinoma | Female | <65 | I/II | Unknown | Unknown | SD | |
| S100P | deletion | In_Frame_Del | c.113_115delNNN | p.Lys39del | p.K39del | P25815 | protein_coding | TCGA-HU-A4H8-01 | Stomach | stomach adenocarcinoma | Male | >=65 | I/II | Chemotherapy | didox | PD |
| Page: 1 |
Top |
Related drugs of malignant transformation related genes |
| Identification of chemicals and drugs interact with genes involved in malignant transfromation |
| (DGIdb 4.0) |
| Entrez ID | Symbol | Category | Interaction Types | Drug Claim Name | Drug Name | PMIDs |
| Page: 1 |

Copyright 2023-Present -The University of Texas Health Science Center at Houston |