
|
|||||
|
 | |
| |
| |
| |
| |
| |
|
Gene: S100B |
Gene summary for S100B |
| Gene information | Species | Human | Gene symbol | S100B | Gene ID | 6285 |
| Gene name | S100 calcium binding protein B | |
| Gene Alias | NEF | |
| Cytomap | 21q22.3 | |
| Gene Type | protein-coding | GO ID | GO:0000902 | UniProtAcc | A0A0S2Z4C5 |
Top |
Malignant transformation analysis |
| Identification of the aberrant gene expression in precancerous and cancerous lesions by comparing the gene expression of stem-like cells in diseased tissues with normal stem cells |
| Entrez ID | Symbol | Replicates | Species | Organ | Tissue | Adj P-value | Log2FC | Malignancy |
| 6285 | S100B | P11T-E | Human | Esophagus | ESCC | 6.29e-15 | 1.89e+00 | 0.1426 |
| 6285 | S100B | P16T-E | Human | Esophagus | ESCC | 3.11e-63 | 2.30e+00 | 0.1153 |
| 6285 | S100B | P19T-E | Human | Esophagus | ESCC | 3.26e-13 | 2.35e+00 | 0.1662 |
| 6285 | S100B | P24T-E | Human | Esophagus | ESCC | 3.25e-04 | 5.17e-01 | 0.1287 |
| 6285 | S100B | P32T-E | Human | Esophagus | ESCC | 3.06e-06 | 9.24e-01 | 0.1666 |
| 6285 | S100B | P44T-E | Human | Esophagus | ESCC | 1.52e-02 | 4.55e-01 | 0.1096 |
| 6285 | S100B | P76T-E | Human | Esophagus | ESCC | 4.42e-53 | 2.13e+00 | 0.1207 |
| Page: 1 |
| Tissue | Expression Dynamics | Abbreviation |
| Esophagus |  | ESCC: Esophageal squamous cell carcinoma |
| HGIN: High-grade intraepithelial neoplasias | ||
| LGIN: Low-grade intraepithelial neoplasias | ||
| Skin | 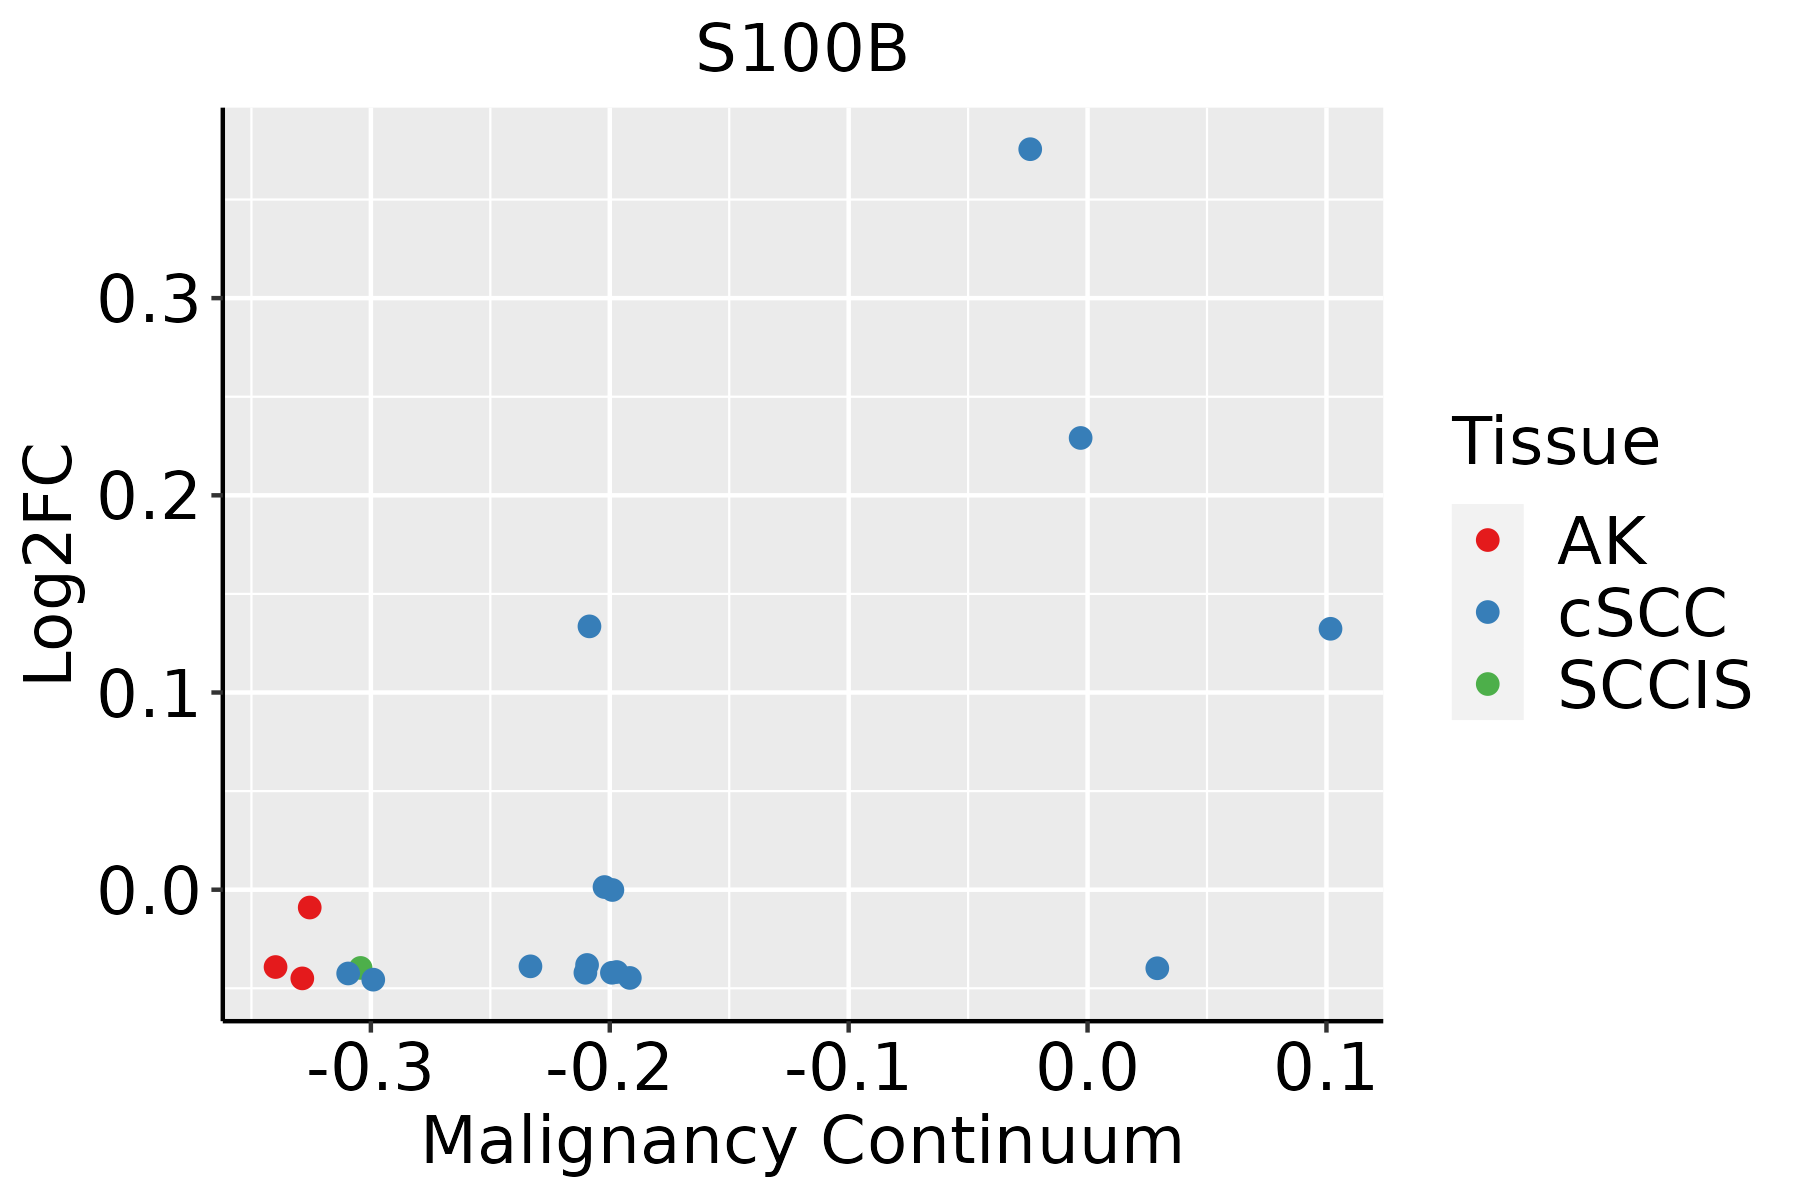 | AK: Actinic keratosis |
| cSCC: Cutaneous squamous cell carcinoma | ||
| SCCIS:squamous cell carcinoma in situ |
| ∗log2FC in expression of this searched gene in stem-like cells from each diseased tissue sample relative to stem-like cells in normal samples in each tissue plotted against the malignancy continuum. Samples are colored based on if they are from different disease stage. |
Top |
Malignant transformation related pathway analysis |
| Find out the enriched GO biological processes and KEGG pathways involved in transition from healthy to precancer to cancer |
| Tissue | Disease Stage | Enriched GO biological Processes |
| Colorectum | AD |  |
| Colorectum | SER |  |
| Colorectum | MSS |  |
| Colorectum | MSI-H |  |
| Colorectum | FAP |  |
| ∗Top 15 enriched GO BP terms are showed in the bar plot of each disease state in each tissue. Each row represents a significant GO biological process which is colored according to the -log10(p.adjust). |
| Page: 1 2 3 4 5 6 7 8 9 |
| GO ID | Tissue | Disease Stage | Description | Gene Ratio | Bg Ratio | pvalue | p.adjust | Count |
| GO:004312318 | Esophagus | ESCC | positive regulation of I-kappaB kinase/NF-kappaB signaling | 132/8552 | 186/18723 | 2.07e-12 | 8.58e-11 | 132 |
| GO:0043122110 | Esophagus | ESCC | regulation of I-kappaB kinase/NF-kappaB signaling | 167/8552 | 249/18723 | 6.11e-12 | 2.32e-10 | 167 |
| GO:000724919 | Esophagus | ESCC | I-kappaB kinase/NF-kappaB signaling | 183/8552 | 281/18723 | 3.02e-11 | 1.01e-09 | 183 |
| GO:0070482111 | Esophagus | ESCC | response to oxygen levels | 218/8552 | 347/18723 | 6.91e-11 | 2.17e-09 | 218 |
| GO:0036293111 | Esophagus | ESCC | response to decreased oxygen levels | 201/8552 | 322/18723 | 8.37e-10 | 2.04e-08 | 201 |
| GO:0001666111 | Esophagus | ESCC | response to hypoxia | 192/8552 | 307/18723 | 1.59e-09 | 3.69e-08 | 192 |
| GO:0048545111 | Esophagus | ESCC | response to steroid hormone | 204/8552 | 339/18723 | 4.47e-08 | 8.11e-07 | 204 |
| GO:0071453110 | Esophagus | ESCC | cellular response to oxygen levels | 114/8552 | 177/18723 | 3.63e-07 | 5.06e-06 | 114 |
| GO:0036294110 | Esophagus | ESCC | cellular response to decreased oxygen levels | 105/8552 | 161/18723 | 4.20e-07 | 5.73e-06 | 105 |
| GO:007145616 | Esophagus | ESCC | cellular response to hypoxia | 97/8552 | 151/18723 | 3.12e-06 | 3.51e-05 | 97 |
| GO:002260420 | Esophagus | ESCC | regulation of cell morphogenesis | 180/8552 | 309/18723 | 5.19e-06 | 5.45e-05 | 180 |
| GO:00425524 | Esophagus | ESCC | myelination | 85/8552 | 134/18723 | 2.51e-05 | 2.13e-04 | 85 |
| GO:00072724 | Esophagus | ESCC | ensheathment of neurons | 86/8552 | 136/18723 | 2.68e-05 | 2.24e-04 | 86 |
| GO:00083664 | Esophagus | ESCC | axon ensheathment | 86/8552 | 136/18723 | 2.68e-05 | 2.24e-04 | 86 |
| GO:00420636 | Esophagus | ESCC | gliogenesis | 172/8552 | 301/18723 | 3.75e-05 | 3.04e-04 | 172 |
| GO:006156415 | Esophagus | ESCC | axon development | 251/8552 | 467/18723 | 2.41e-04 | 1.49e-03 | 251 |
| GO:00100016 | Esophagus | ESCC | glial cell differentiation | 129/8552 | 225/18723 | 2.73e-04 | 1.65e-03 | 129 |
| GO:000836018 | Esophagus | ESCC | regulation of cell shape | 92/8552 | 154/18723 | 3.00e-04 | 1.81e-03 | 92 |
| GO:00519606 | Esophagus | ESCC | regulation of nervous system development | 237/8552 | 443/18723 | 5.02e-04 | 2.78e-03 | 237 |
| GO:003196020 | Esophagus | ESCC | response to corticosteroid | 95/8552 | 167/18723 | 2.27e-03 | 9.99e-03 | 95 |
| Page: 1 2 |
| Pathway ID | Tissue | Disease Stage | Description | Gene Ratio | Bg Ratio | pvalue | p.adjust | qvalue | Count |
| Page: 1 |
Top |
Cell-cell communication analysis |
| Identification of potential cell-cell interactions between two cell types and their ligand-receptor pairs for different disease states |
| Ligand | Receptor | LRpair | Pathway | Tissue | Disease Stage |
| Page: 1 |
Top |
Single-cell gene regulatory network inference analysis |
| Find out the significant the regulons (TFs) and the target genes of each regulon across cell types for different disease states |
| TF | Cell Type | Tissue | Disease Stage | Target Gene | RSS | Regulon Activity |
| ∗The dot plots of a searched regulon are shown for all cell subpopulations in each disease state of each tissue based on the regulon specific score inferred using pySCENIC and by calculating the average expression. |
| Page: 1 |
Top |
Somatic mutation of malignant transformation related genes |
| Annotation of somatic variants for genes involved in malignant transformation |
| Hugo Symbol | Variant Class | Variant Classification | dbSNP RS | HGVSc | HGVSp | HGVSp Short | SWISSPROT | BIOTYPE | SIFT | PolyPhen | Tumor Sample Barcode | Tissue | Histology | Sex | Age | Stage | Therapy Types | Drugs | Outcome |
| S100B | SNV | Missense_Mutation | c.102N>T | p.Lys34Asn | p.K34N | P04271 | protein_coding | deleterious(0) | probably_damaging(0.96) | TCGA-D8-A1XQ-01 | Breast | breast invasive carcinoma | Female | >=65 | I/II | Unknown | Unknown | SD | |
| S100B | SNV | Missense_Mutation | rs375166815 | c.22N>G | p.Met8Val | p.M8V | P04271 | protein_coding | deleterious(0.04) | benign(0.003) | TCGA-E2-A15G-01 | Breast | breast invasive carcinoma | Female | >=65 | I/II | Hormone Therapy | arimidex | SD |
| S100B | insertion | Frame_Shift_Ins | novel | c.1_2insC | p.Met1? | p.M1? | P04271 | protein_coding | TCGA-B6-A0RG-01 | Breast | breast invasive carcinoma | Female | <65 | I/II | Unknown | Unknown | SD | ||
| S100B | SNV | Missense_Mutation | c.208N>A | p.Asp70Asn | p.D70N | P04271 | protein_coding | tolerated(0.06) | benign(0.261) | TCGA-DS-A1OC-01 | Cervix | cervical & endocervical cancer | Female | <65 | I/II | Chemotherapy | gemcitabine | SD | |
| S100B | SNV | Missense_Mutation | rs753432809 | c.40G>A | p.Val14Ile | p.V14I | P04271 | protein_coding | tolerated(0.29) | benign(0.253) | TCGA-AA-3864-01 | Colorectum | colon adenocarcinoma | Male | >=65 | I/II | Unknown | Unknown | SD |
| S100B | SNV | Missense_Mutation | c.132N>A | p.Phe44Leu | p.F44L | P04271 | protein_coding | tolerated(0.12) | benign(0.26) | TCGA-AA-A00N-01 | Colorectum | colon adenocarcinoma | Male | >=65 | I/II | Unknown | Unknown | PD | |
| S100B | SNV | Missense_Mutation | novel | c.147N>C | p.Lys49Asn | p.K49N | P04271 | protein_coding | tolerated(0.07) | benign(0.346) | TCGA-EI-6917-01 | Colorectum | rectum adenocarcinoma | Male | <65 | III/IV | Chemotherapy | 5fluorouracil+oxaciplatina+l-folinian | SD |
| S100B | SNV | Missense_Mutation | novel | c.145A>G | p.Lys49Glu | p.K49E | P04271 | protein_coding | deleterious(0.01) | possibly_damaging(0.851) | TCGA-F5-6814-01 | Colorectum | rectum adenocarcinoma | Male | <65 | I/II | Unknown | Unknown | SD |
| S100B | SNV | Missense_Mutation | novel | c.46N>T | p.His16Tyr | p.H16Y | P04271 | protein_coding | tolerated(0.08) | possibly_damaging(0.876) | TCGA-A5-A0GG-01 | Endometrium | uterine corpus endometrioid carcinoma | Female | >=65 | I/II | Unknown | Unknown | SD |
| S100B | SNV | Missense_Mutation | rs778690779 | c.37G>A | p.Asp13Asn | p.D13N | P04271 | protein_coding | tolerated(0.56) | benign(0.176) | TCGA-AP-A1DK-01 | Endometrium | uterine corpus endometrioid carcinoma | Female | <65 | I/II | Unknown | Unknown | SD |
| Page: 1 2 |
Top |
Related drugs of malignant transformation related genes |
| Identification of chemicals and drugs interact with genes involved in malignant transfromation |
| (DGIdb 4.0) |
| Entrez ID | Symbol | Category | Interaction Types | Drug Claim Name | Drug Name | PMIDs |
| 6285 | S100B | DRUGGABLE GENOME, KINASE | STREPTOZOTOCIN | STREPTOZOCIN | 14583344 | |
| 6285 | S100B | DRUGGABLE GENOME, KINASE | ONO-2506 | |||
| 6285 | S100B | DRUGGABLE GENOME, KINASE | PHENOTHIAZINE | PHENOTHIAZINE | 6947252 | |
| 6285 | S100B | DRUGGABLE GENOME, KINASE | STZ | STREPTOZOCIN | 14583344 |
| Page: 1 |

Copyright 2023-Present -The University of Texas Health Science Center at Houston |