
|
|||||
|
 | |
| |
| |
| |
| |
| |
|
Gene: S100A7 |
Gene summary for S100A7 |
| Gene information | Species | Human | Gene symbol | S100A7 | Gene ID | 6278 |
| Gene name | S100 calcium binding protein A7 | |
| Gene Alias | PSOR1 | |
| Cytomap | 1q21.3 | |
| Gene Type | protein-coding | GO ID | GO:0000165 | UniProtAcc | P31151 |
Top |
Malignant transformation analysis |
| Identification of the aberrant gene expression in precancerous and cancerous lesions by comparing the gene expression of stem-like cells in diseased tissues with normal stem cells |
| Entrez ID | Symbol | Replicates | Species | Organ | Tissue | Adj P-value | Log2FC | Malignancy |
| 6278 | S100A7 | GSM4909298 | Human | Breast | IDC | 3.11e-02 | -1.86e-01 | 0.1551 |
| 6278 | S100A7 | GSM4909302 | Human | Breast | IDC | 1.42e-02 | -1.86e-01 | 0.1545 |
| 6278 | S100A7 | GSM4909317 | Human | Breast | IDC | 1.19e-17 | 7.55e-01 | 0.1355 |
| 6278 | S100A7 | brca2 | Human | Breast | Precancer | 1.24e-05 | 1.74e-01 | -0.024 |
| 6278 | S100A7 | M2 | Human | Breast | IDC | 9.83e-22 | 1.38e+00 | 0.21 |
| 6278 | S100A7 | NCCBC11 | Human | Breast | DCIS | 2.04e-06 | 9.01e-01 | 0.1232 |
| 6278 | S100A7 | NCCBC14 | Human | Breast | DCIS | 1.17e-35 | 1.22e+00 | 0.2021 |
| 6278 | S100A7 | NCCBC5 | Human | Breast | DCIS | 1.08e-08 | 6.67e-01 | 0.2046 |
| 6278 | S100A7 | NCCBC6 | Human | Breast | DCIS | 1.45e-12 | 1.20e+00 | 0.2095 |
| 6278 | S100A7 | CA_HPV_1 | Human | Cervix | CC | 1.78e-27 | -5.25e-01 | 0.0264 |
| 6278 | S100A7 | CA_HPV_2 | Human | Cervix | CC | 2.56e-26 | -5.23e-01 | 0.0391 |
| 6278 | S100A7 | CA_HPV_3 | Human | Cervix | CC | 2.64e-24 | -5.19e-01 | 0.0414 |
| 6278 | S100A7 | HSIL_HPV_1 | Human | Cervix | HSIL_HPV | 1.78e-13 | -5.13e-01 | 0.0116 |
| 6278 | S100A7 | HSIL_HPV_2 | Human | Cervix | HSIL_HPV | 2.50e-18 | -4.92e-01 | 0.0208 |
| 6278 | S100A7 | N_HPV_1 | Human | Cervix | N_HPV | 5.76e-22 | -5.11e-01 | 0.0079 |
| 6278 | S100A7 | N_HPV_2 | Human | Cervix | N_HPV | 5.86e-09 | -6.57e-02 | -0.0131 |
| 6278 | S100A7 | CCI_1 | Human | Cervix | CC | 1.83e-04 | -5.25e-01 | 0.528 |
| 6278 | S100A7 | CCI_2 | Human | Cervix | CC | 5.85e-04 | -5.25e-01 | 0.5249 |
| 6278 | S100A7 | CCI_3 | Human | Cervix | CC | 4.72e-02 | -4.63e-01 | 0.516 |
| 6278 | S100A7 | CCII_1 | Human | Cervix | CC | 8.58e-03 | -4.47e-01 | 0.3249 |
| Page: 1 2 3 4 |
| Tissue | Expression Dynamics | Abbreviation |
| Breast | 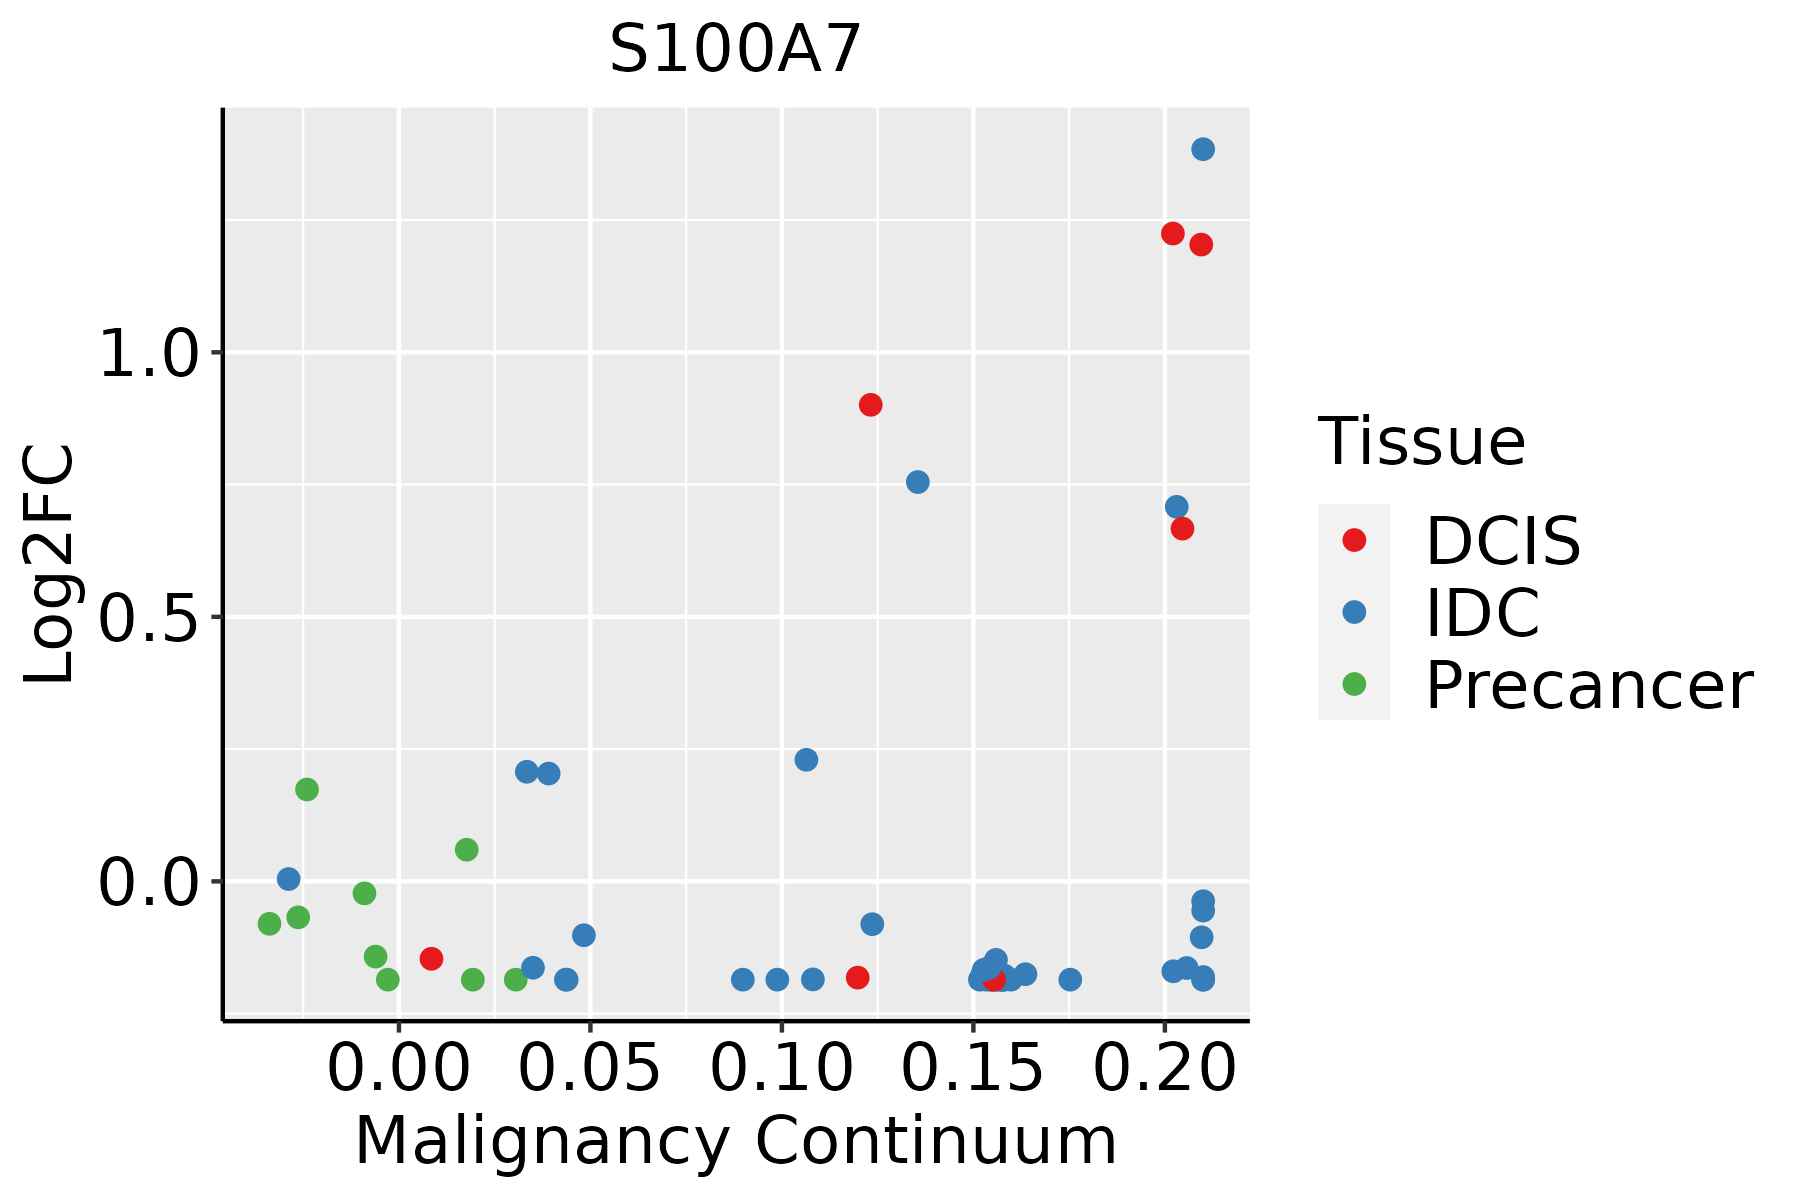 | IDC: Invasive ductal carcinoma |
| DCIS: Ductal carcinoma in situ | ||
| Precancer(BRCA1-mut): Precancerous lesion from BRCA1 mutation carriers | ||
| Cervix | 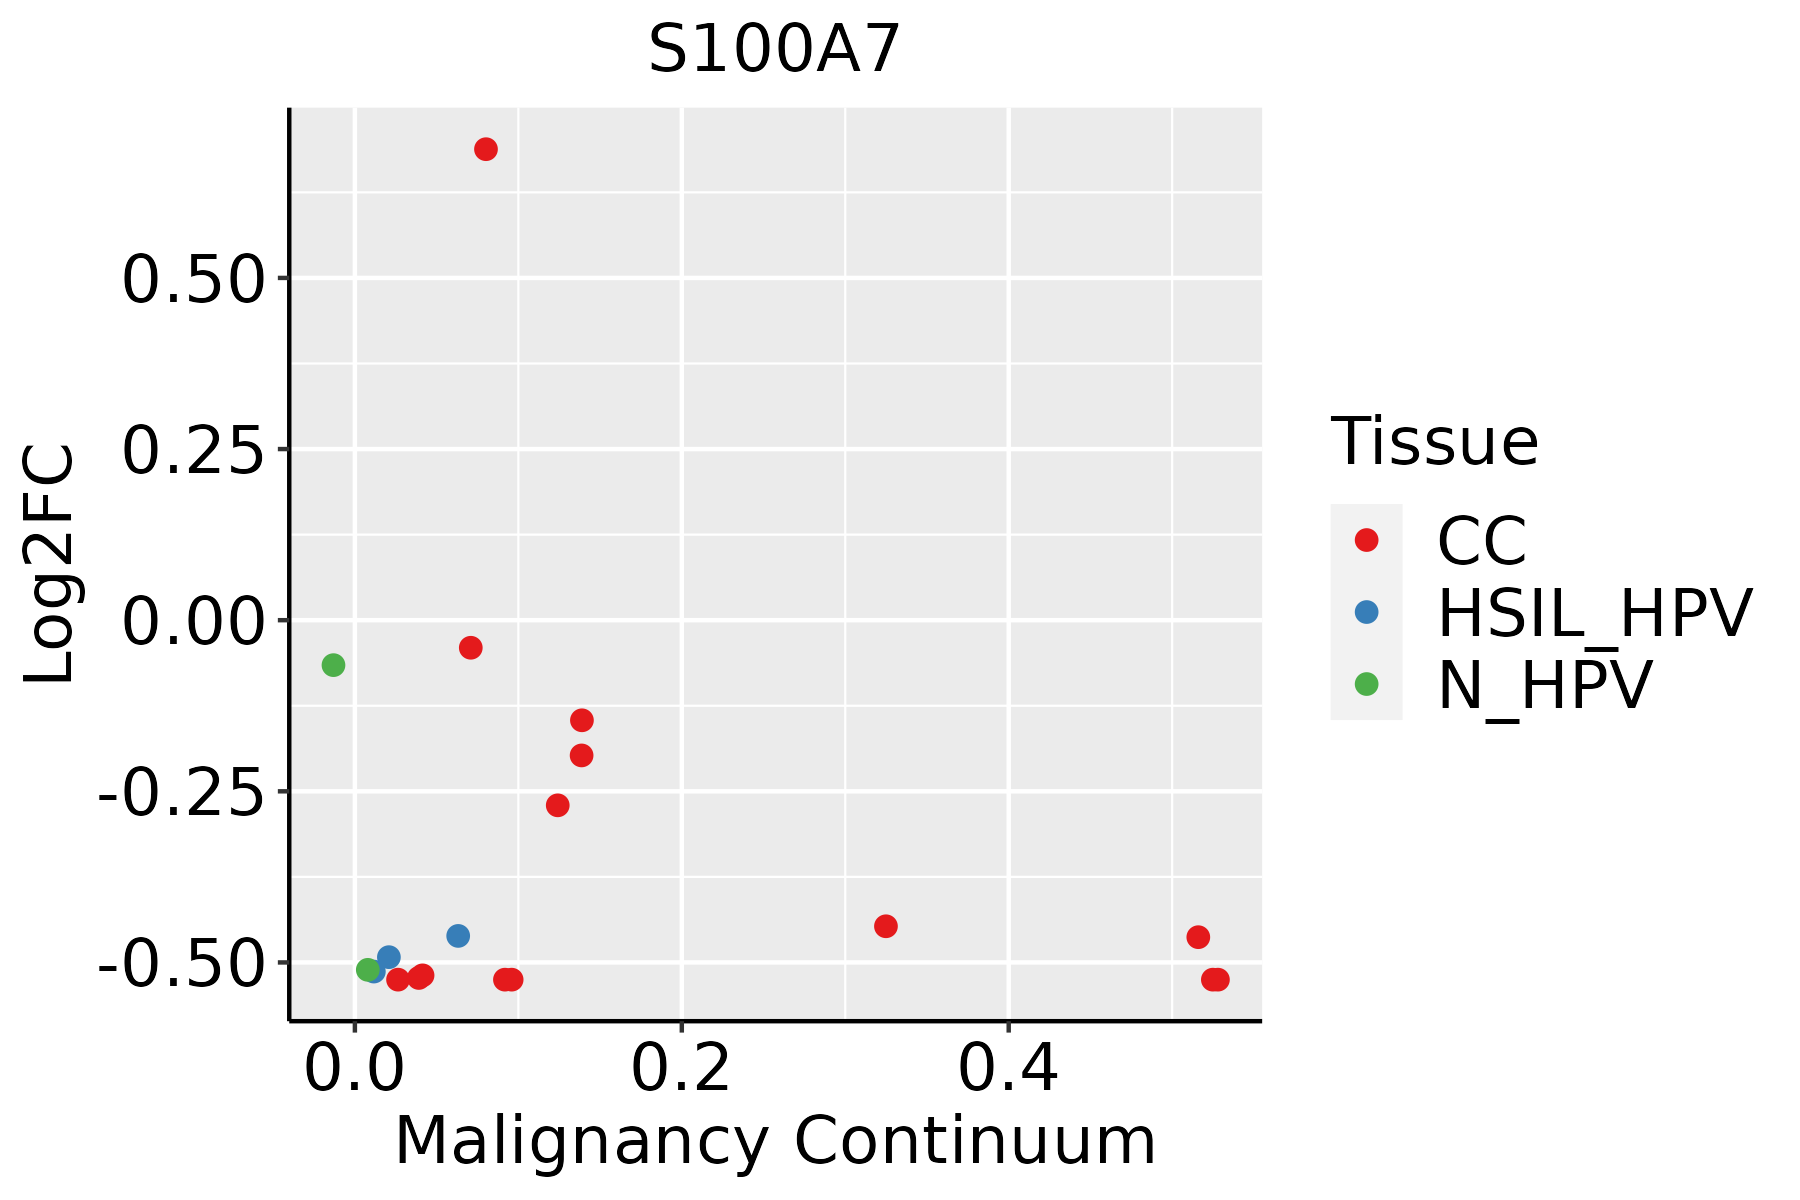 | CC: Cervix cancer |
| HSIL_HPV: HPV-infected high-grade squamous intraepithelial lesions | ||
| N_HPV: HPV-infected normal cervix | ||
| Esophagus |  | ESCC: Esophageal squamous cell carcinoma |
| HGIN: High-grade intraepithelial neoplasias | ||
| LGIN: Low-grade intraepithelial neoplasias | ||
| Oral Cavity | 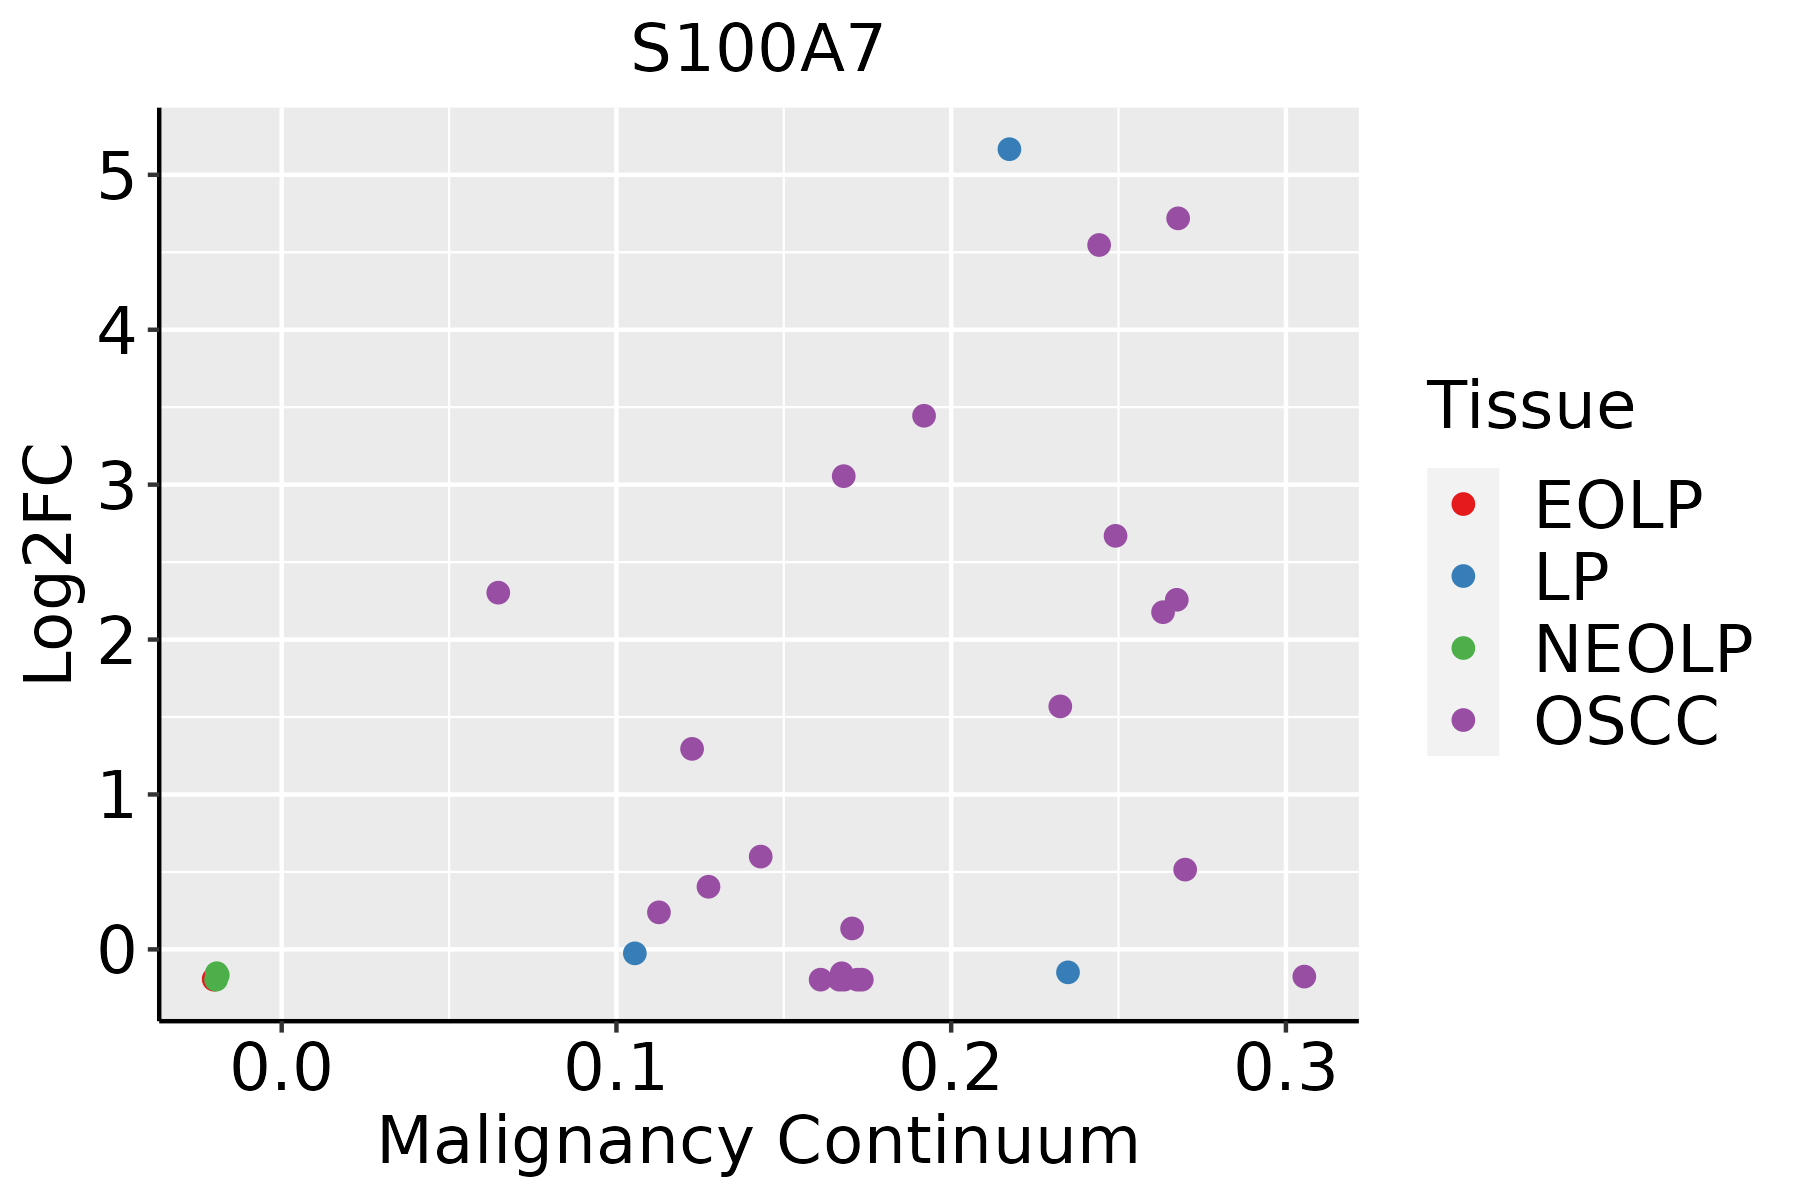 | EOLP: Erosive Oral lichen planus |
| LP: leukoplakia | ||
| NEOLP: Non-erosive oral lichen planus | ||
| OSCC: Oral squamous cell carcinoma | ||
| Skin | 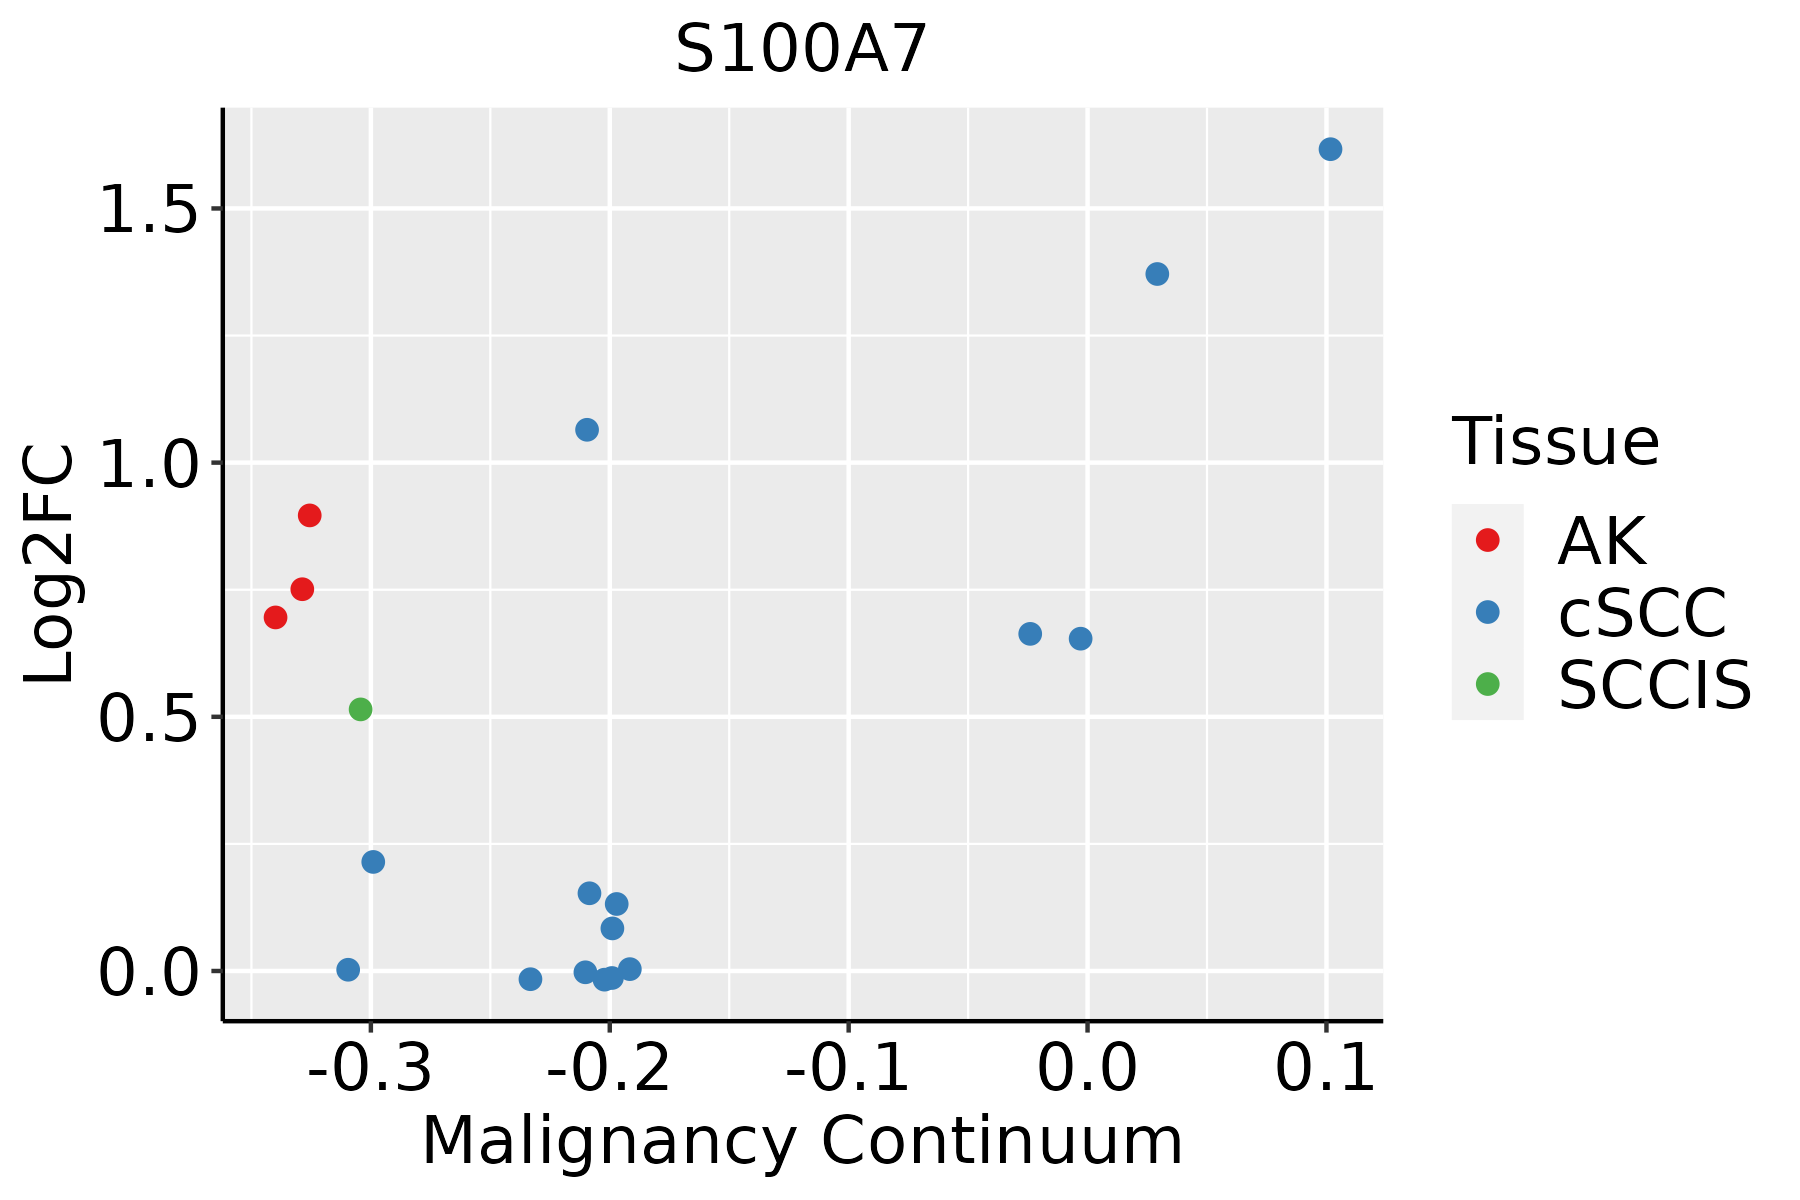 | AK: Actinic keratosis |
| cSCC: Cutaneous squamous cell carcinoma | ||
| SCCIS:squamous cell carcinoma in situ |
| ∗log2FC in expression of this searched gene in stem-like cells from each diseased tissue sample relative to stem-like cells in normal samples in each tissue plotted against the malignancy continuum. Samples are colored based on if they are from different disease stage. |
Top |
Malignant transformation related pathway analysis |
| Find out the enriched GO biological processes and KEGG pathways involved in transition from healthy to precancer to cancer |
| Tissue | Disease Stage | Enriched GO biological Processes |
| Colorectum | AD |  |
| Colorectum | SER |  |
| Colorectum | MSS |  |
| Colorectum | MSI-H |  |
| Colorectum | FAP |  |
| ∗Top 15 enriched GO BP terms are showed in the bar plot of each disease state in each tissue. Each row represents a significant GO biological process which is colored according to the -log10(p.adjust). |
| Page: 1 2 3 4 5 6 7 8 9 |
| GO ID | Tissue | Disease Stage | Description | Gene Ratio | Bg Ratio | pvalue | p.adjust | Count |
| GO:00069799 | Breast | Precancer | response to oxidative stress | 70/1080 | 446/18723 | 1.59e-14 | 4.26e-12 | 70 |
| GO:00003029 | Breast | Precancer | response to reactive oxygen species | 38/1080 | 222/18723 | 1.47e-09 | 1.23e-07 | 38 |
| GO:00975297 | Breast | Precancer | myeloid leukocyte migration | 34/1080 | 220/18723 | 1.42e-07 | 7.82e-06 | 34 |
| GO:00509006 | Breast | Precancer | leukocyte migration | 47/1080 | 369/18723 | 2.82e-07 | 1.39e-05 | 47 |
| GO:00305956 | Breast | Precancer | leukocyte chemotaxis | 34/1080 | 230/18723 | 4.16e-07 | 1.89e-05 | 34 |
| GO:00603266 | Breast | Precancer | cell chemotaxis | 41/1080 | 310/18723 | 5.99e-07 | 2.55e-05 | 41 |
| GO:00716217 | Breast | Precancer | granulocyte chemotaxis | 23/1080 | 125/18723 | 6.73e-07 | 2.77e-05 | 23 |
| GO:00975307 | Breast | Precancer | granulocyte migration | 24/1080 | 148/18723 | 4.04e-06 | 1.26e-04 | 24 |
| GO:00512358 | Breast | Precancer | maintenance of location | 40/1080 | 327/18723 | 5.85e-06 | 1.71e-04 | 40 |
| GO:00022378 | Breast | Precancer | response to molecule of bacterial origin | 43/1080 | 363/18723 | 6.05e-06 | 1.72e-04 | 43 |
| GO:00324968 | Breast | Precancer | response to lipopolysaccharide | 41/1080 | 343/18723 | 7.94e-06 | 2.17e-04 | 41 |
| GO:00512383 | Breast | Precancer | sequestering of metal ion | 7/1080 | 16/18723 | 1.50e-05 | 3.71e-04 | 7 |
| GO:00321034 | Breast | Precancer | positive regulation of response to external stimulus | 46/1080 | 427/18723 | 3.41e-05 | 7.40e-04 | 46 |
| GO:00197307 | Breast | Precancer | antimicrobial humoral response | 19/1080 | 122/18723 | 7.02e-05 | 1.40e-03 | 19 |
| GO:00026856 | Breast | Precancer | regulation of leukocyte migration | 27/1080 | 210/18723 | 7.93e-05 | 1.54e-03 | 27 |
| GO:00618446 | Breast | Precancer | antimicrobial humoral immune response mediated by antimicrobial peptide | 14/1080 | 79/18723 | 1.53e-04 | 2.61e-03 | 14 |
| GO:00085445 | Breast | Precancer | epidermis development | 35/1080 | 324/18723 | 2.71e-04 | 3.96e-03 | 35 |
| GO:00716744 | Breast | Precancer | mononuclear cell migration | 24/1080 | 196/18723 | 4.03e-04 | 5.44e-03 | 24 |
| GO:00026887 | Breast | Precancer | regulation of leukocyte chemotaxis | 17/1080 | 122/18723 | 6.34e-04 | 7.86e-03 | 17 |
| GO:00026877 | Breast | Precancer | positive regulation of leukocyte migration | 18/1080 | 135/18723 | 7.60e-04 | 9.04e-03 | 18 |
| Page: 1 2 3 4 5 6 7 8 9 10 11 12 13 14 15 16 17 18 19 20 21 |
| Pathway ID | Tissue | Disease Stage | Description | Gene Ratio | Bg Ratio | pvalue | p.adjust | qvalue | Count |
| hsa0465716 | Breast | Precancer | IL-17 signaling pathway | 20/684 | 94/8465 | 4.74e-05 | 4.54e-04 | 3.48e-04 | 20 |
| hsa0465717 | Breast | Precancer | IL-17 signaling pathway | 20/684 | 94/8465 | 4.74e-05 | 4.54e-04 | 3.48e-04 | 20 |
| hsa0465721 | Breast | IDC | IL-17 signaling pathway | 18/867 | 94/8465 | 6.39e-03 | 3.30e-02 | 2.47e-02 | 18 |
| hsa0465731 | Breast | IDC | IL-17 signaling pathway | 18/867 | 94/8465 | 6.39e-03 | 3.30e-02 | 2.47e-02 | 18 |
| hsa0465741 | Breast | DCIS | IL-17 signaling pathway | 18/846 | 94/8465 | 4.95e-03 | 2.67e-02 | 1.96e-02 | 18 |
| hsa0465751 | Breast | DCIS | IL-17 signaling pathway | 18/846 | 94/8465 | 4.95e-03 | 2.67e-02 | 1.96e-02 | 18 |
| hsa0465718 | Cervix | CC | IL-17 signaling pathway | 31/1267 | 94/8465 | 8.71e-06 | 7.43e-05 | 4.39e-05 | 31 |
| hsa0465719 | Cervix | CC | IL-17 signaling pathway | 31/1267 | 94/8465 | 8.71e-06 | 7.43e-05 | 4.39e-05 | 31 |
| hsa0465722 | Cervix | HSIL_HPV | IL-17 signaling pathway | 15/459 | 94/8465 | 1.45e-04 | 1.74e-03 | 1.40e-03 | 15 |
| hsa0465732 | Cervix | HSIL_HPV | IL-17 signaling pathway | 15/459 | 94/8465 | 1.45e-04 | 1.74e-03 | 1.40e-03 | 15 |
| hsa0465742 | Cervix | N_HPV | IL-17 signaling pathway | 16/349 | 94/8465 | 1.20e-06 | 1.64e-05 | 1.28e-05 | 16 |
| hsa0465752 | Cervix | N_HPV | IL-17 signaling pathway | 16/349 | 94/8465 | 1.20e-06 | 1.64e-05 | 1.28e-05 | 16 |
| hsa0465727 | Esophagus | ESCC | IL-17 signaling pathway | 66/4205 | 94/8465 | 3.93e-05 | 1.75e-04 | 8.99e-05 | 66 |
| hsa0465734 | Esophagus | ESCC | IL-17 signaling pathway | 66/4205 | 94/8465 | 3.93e-05 | 1.75e-04 | 8.99e-05 | 66 |
| hsa0465724 | Oral cavity | OSCC | IL-17 signaling pathway | 64/3704 | 94/8465 | 1.48e-06 | 7.87e-06 | 4.01e-06 | 64 |
| hsa04657112 | Oral cavity | OSCC | IL-17 signaling pathway | 64/3704 | 94/8465 | 1.48e-06 | 7.87e-06 | 4.01e-06 | 64 |
| hsa0465725 | Oral cavity | LP | IL-17 signaling pathway | 47/2418 | 94/8465 | 8.45e-06 | 6.25e-05 | 4.03e-05 | 47 |
| hsa0465733 | Oral cavity | LP | IL-17 signaling pathway | 47/2418 | 94/8465 | 8.45e-06 | 6.25e-05 | 4.03e-05 | 47 |
| hsa0465743 | Oral cavity | EOLP | IL-17 signaling pathway | 24/1218 | 94/8465 | 2.98e-03 | 9.61e-03 | 5.67e-03 | 24 |
| hsa0465753 | Oral cavity | EOLP | IL-17 signaling pathway | 24/1218 | 94/8465 | 2.98e-03 | 9.61e-03 | 5.67e-03 | 24 |
| Page: 1 2 |
Top |
Cell-cell communication analysis |
| Identification of potential cell-cell interactions between two cell types and their ligand-receptor pairs for different disease states |
| Ligand | Receptor | LRpair | Pathway | Tissue | Disease Stage |
| Page: 1 |
Top |
Single-cell gene regulatory network inference analysis |
| Find out the significant the regulons (TFs) and the target genes of each regulon across cell types for different disease states |
| TF | Cell Type | Tissue | Disease Stage | Target Gene | RSS | Regulon Activity |
| ∗The dot plots of a searched regulon are shown for all cell subpopulations in each disease state of each tissue based on the regulon specific score inferred using pySCENIC and by calculating the average expression. |
| Page: 1 |
Top |
Somatic mutation of malignant transformation related genes |
| Annotation of somatic variants for genes involved in malignant transformation |
| Hugo Symbol | Variant Class | Variant Classification | dbSNP RS | HGVSc | HGVSp | HGVSp Short | SWISSPROT | BIOTYPE | SIFT | PolyPhen | Tumor Sample Barcode | Tissue | Histology | Sex | Age | Stage | Therapy Types | Drugs | Outcome |
| S100A7 | SNV | Missense_Mutation | rs762356824 | c.166N>A | p.Ala56Thr | p.A56T | P31151 | protein_coding | tolerated(0.36) | benign(0) | TCGA-EA-A3HS-01 | Cervix | cervical & endocervical cancer | Female | <65 | I/II | Unknown | Unknown | SD |
| S100A7 | SNV | Missense_Mutation | c.43N>A | p.Asp15Asn | p.D15N | P31151 | protein_coding | tolerated(0.49) | benign(0) | TCGA-AD-A5EJ-01 | Colorectum | colon adenocarcinoma | Female | >=65 | I/II | Unknown | Unknown | SD | |
| S100A7 | SNV | Missense_Mutation | novel | c.199G>A | p.Asp67Asn | p.D67N | P31151 | protein_coding | deleterious(0) | possibly_damaging(0.9) | TCGA-AZ-4315-01 | Colorectum | colon adenocarcinoma | Male | <65 | I/II | Unknown | Unknown | SD |
| S100A7 | SNV | Missense_Mutation | rs370414457 | c.169N>A | p.Asp57Asn | p.D57N | P31151 | protein_coding | tolerated(1) | benign(0) | TCGA-CA-6717-01 | Colorectum | colon adenocarcinoma | Male | <65 | I/II | Chemotherapy | oxaliplatin | CR |
| S100A7 | SNV | Missense_Mutation | c.204G>T | p.Lys68Asn | p.K68N | P31151 | protein_coding | tolerated(0.14) | possibly_damaging(0.78) | TCGA-F5-6464-01 | Colorectum | rectum adenocarcinoma | Female | >=65 | III/IV | Unknown | Unknown | SD | |
| S100A7 | SNV | Missense_Mutation | c.43N>A | p.Asp15Asn | p.D15N | P31151 | protein_coding | tolerated(0.49) | benign(0) | TCGA-AJ-A3EL-01 | Endometrium | uterine corpus endometrioid carcinoma | Female | <65 | I/II | Unknown | Unknown | SD | |
| S100A7 | SNV | Missense_Mutation | c.43N>A | p.Asp15Asn | p.D15N | P31151 | protein_coding | tolerated(0.49) | benign(0) | TCGA-AJ-A5DW-01 | Endometrium | uterine corpus endometrioid carcinoma | Female | <65 | I/II | Unknown | Unknown | SD | |
| S100A7 | SNV | Missense_Mutation | c.187G>T | p.Asp63Tyr | p.D63Y | P31151 | protein_coding | deleterious(0) | probably_damaging(0.999) | TCGA-AP-A056-01 | Endometrium | uterine corpus endometrioid carcinoma | Female | <65 | I/II | Unknown | Unknown | SD | |
| S100A7 | SNV | Missense_Mutation | rs370414457 | c.169G>A | p.Asp57Asn | p.D57N | P31151 | protein_coding | tolerated(1) | benign(0) | TCGA-AP-A1E0-01 | Endometrium | uterine corpus endometrioid carcinoma | Female | <65 | III/IV | Chemotherapy | paclitaxel | SD |
| S100A7 | SNV | Missense_Mutation | novel | c.186N>T | p.Lys62Asn | p.K62N | P31151 | protein_coding | deleterious(0.05) | probably_damaging(0.971) | TCGA-AX-A06F-01 | Endometrium | uterine corpus endometrioid carcinoma | Female | <65 | III/IV | Chemotherapy | carboplatin | SD |
| Page: 1 2 3 4 |
Top |
Related drugs of malignant transformation related genes |
| Identification of chemicals and drugs interact with genes involved in malignant transfromation |
| (DGIdb 4.0) |
| Entrez ID | Symbol | Category | Interaction Types | Drug Claim Name | Drug Name | PMIDs |
| Page: 1 |

Copyright 2023-Present -The University of Texas Health Science Center at Houston |