
|
|||||
|
 | |
| |
| |
| |
| |
| |
|
Gene: S100A4 |
Gene summary for S100A4 |
| Gene information | Species | Human | Gene symbol | S100A4 | Gene ID | 6275 |
| Gene name | S100 calcium binding protein A4 | |
| Gene Alias | 18A2 | |
| Cytomap | 1q21.3 | |
| Gene Type | protein-coding | GO ID | GO:0001837 | UniProtAcc | P26447 |
Top |
Malignant transformation analysis |
| Identification of the aberrant gene expression in precancerous and cancerous lesions by comparing the gene expression of stem-like cells in diseased tissues with normal stem cells |
| Entrez ID | Symbol | Replicates | Species | Organ | Tissue | Adj P-value | Log2FC | Malignancy |
| 6275 | S100A4 | GSM4909281 | Human | Breast | IDC | 1.26e-11 | 4.71e-01 | 0.21 |
| 6275 | S100A4 | GSM4909282 | Human | Breast | IDC | 1.63e-37 | 7.80e-01 | -0.0288 |
| 6275 | S100A4 | GSM4909285 | Human | Breast | IDC | 4.20e-05 | 2.07e-01 | 0.21 |
| 6275 | S100A4 | GSM4909286 | Human | Breast | IDC | 7.01e-17 | 3.16e-01 | 0.1081 |
| 6275 | S100A4 | GSM4909295 | Human | Breast | IDC | 1.24e-21 | 1.05e+00 | 0.0898 |
| 6275 | S100A4 | GSM4909311 | Human | Breast | IDC | 3.13e-07 | -2.84e-01 | 0.1534 |
| 6275 | S100A4 | GSM4909312 | Human | Breast | IDC | 8.86e-09 | -3.24e-01 | 0.1552 |
| 6275 | S100A4 | GSM4909319 | Human | Breast | IDC | 1.25e-06 | -2.13e-01 | 0.1563 |
| 6275 | S100A4 | GSM4909321 | Human | Breast | IDC | 1.60e-11 | -3.34e-01 | 0.1559 |
| 6275 | S100A4 | M1 | Human | Breast | IDC | 2.59e-09 | 5.50e-01 | 0.1577 |
| 6275 | S100A4 | NCCBC14 | Human | Breast | DCIS | 9.37e-03 | 4.98e-02 | 0.2021 |
| 6275 | S100A4 | NCCBC3 | Human | Breast | DCIS | 8.80e-10 | 5.66e-01 | 0.1198 |
| 6275 | S100A4 | NCCBC5 | Human | Breast | DCIS | 5.42e-05 | 4.25e-01 | 0.2046 |
| 6275 | S100A4 | DCIS2 | Human | Breast | DCIS | 3.80e-11 | -6.23e-02 | 0.0085 |
| 6275 | S100A4 | CA_HPV_2 | Human | Cervix | CC | 4.45e-03 | -3.15e-01 | 0.0391 |
| 6275 | S100A4 | CA_HPV_3 | Human | Cervix | CC | 6.78e-09 | -5.07e-01 | 0.0414 |
| 6275 | S100A4 | HSIL_HPV_1 | Human | Cervix | HSIL_HPV | 1.09e-04 | 2.14e-01 | 0.0116 |
| 6275 | S100A4 | CCI_1 | Human | Cervix | CC | 3.03e-24 | -1.47e+00 | 0.528 |
| 6275 | S100A4 | CCI_2 | Human | Cervix | CC | 1.86e-21 | -1.44e+00 | 0.5249 |
| 6275 | S100A4 | CCI_3 | Human | Cervix | CC | 7.93e-32 | -1.48e+00 | 0.516 |
| Page: 1 2 3 4 5 6 7 8 9 10 11 |
| Tissue | Expression Dynamics | Abbreviation |
| Breast | 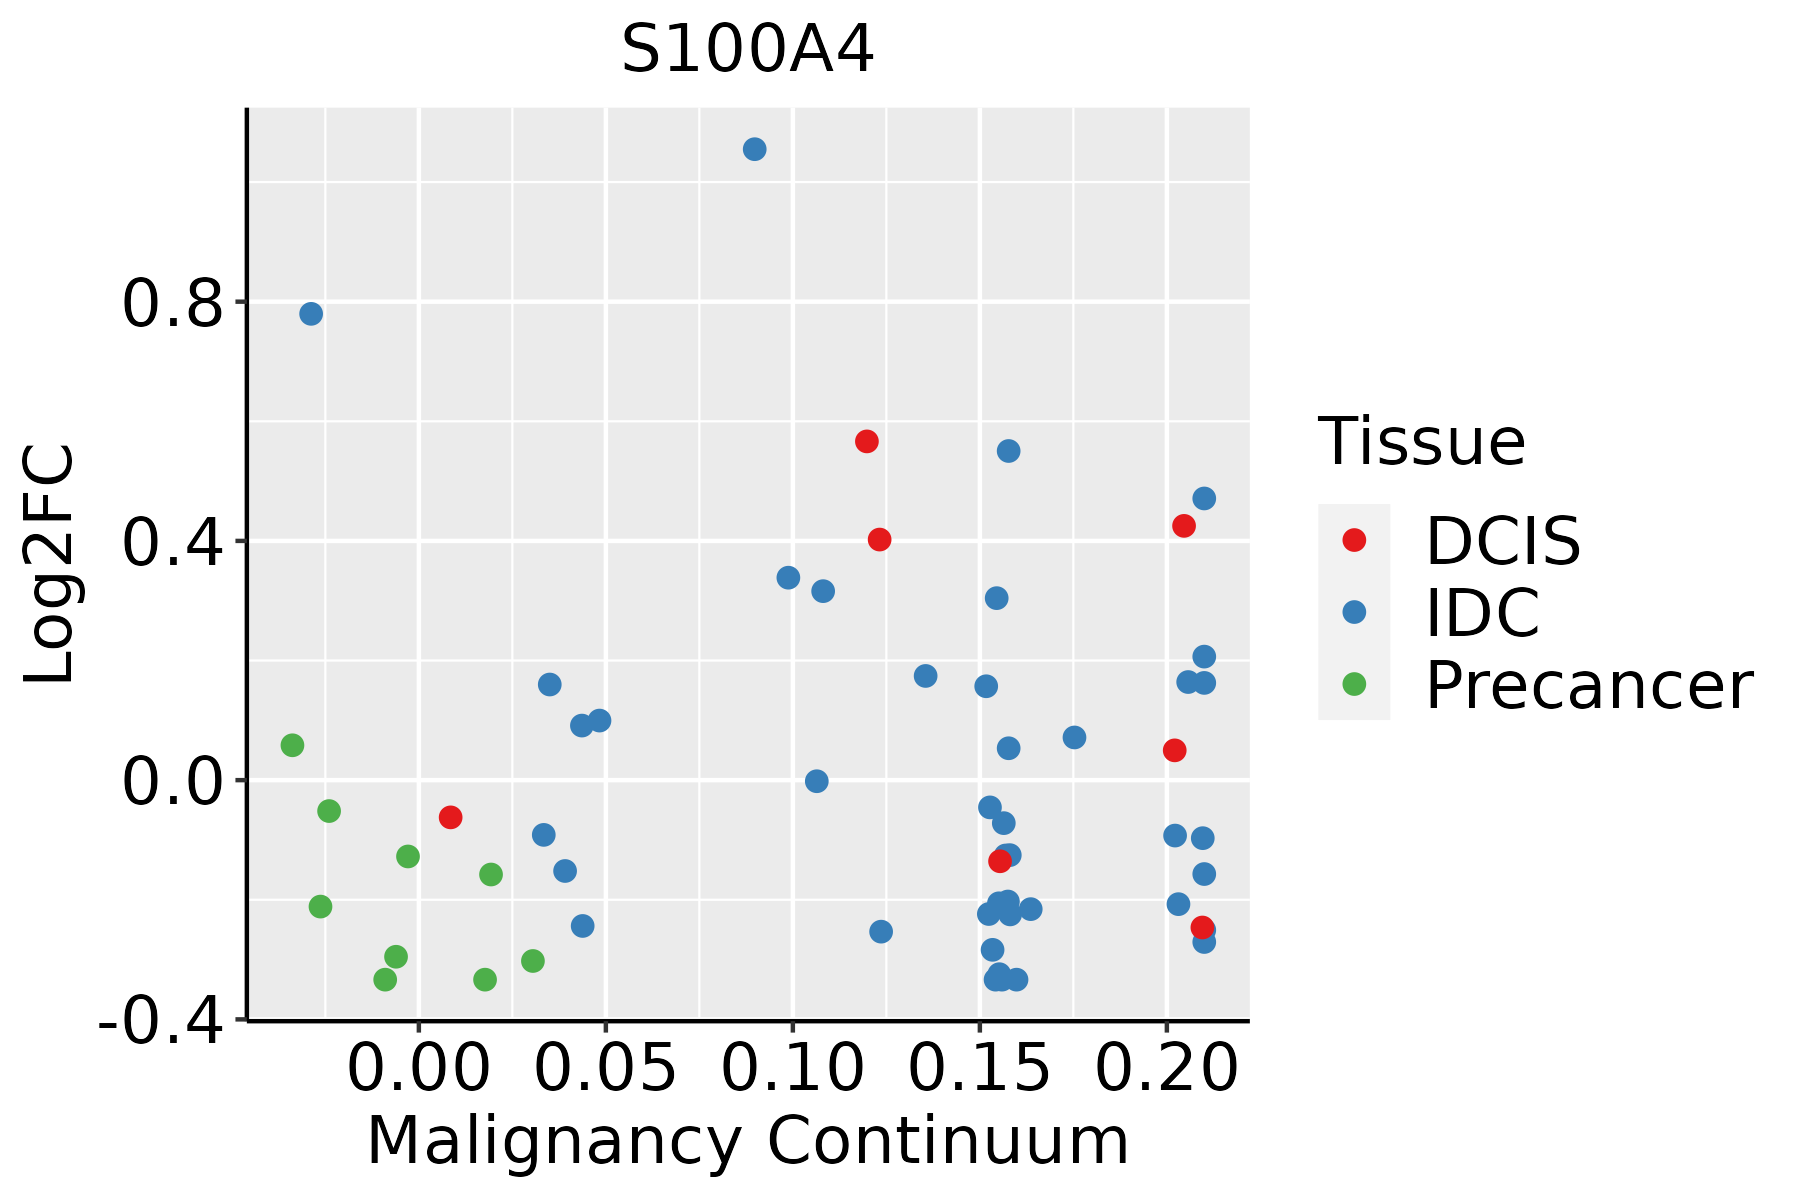 | IDC: Invasive ductal carcinoma |
| DCIS: Ductal carcinoma in situ | ||
| Precancer(BRCA1-mut): Precancerous lesion from BRCA1 mutation carriers | ||
| Cervix | 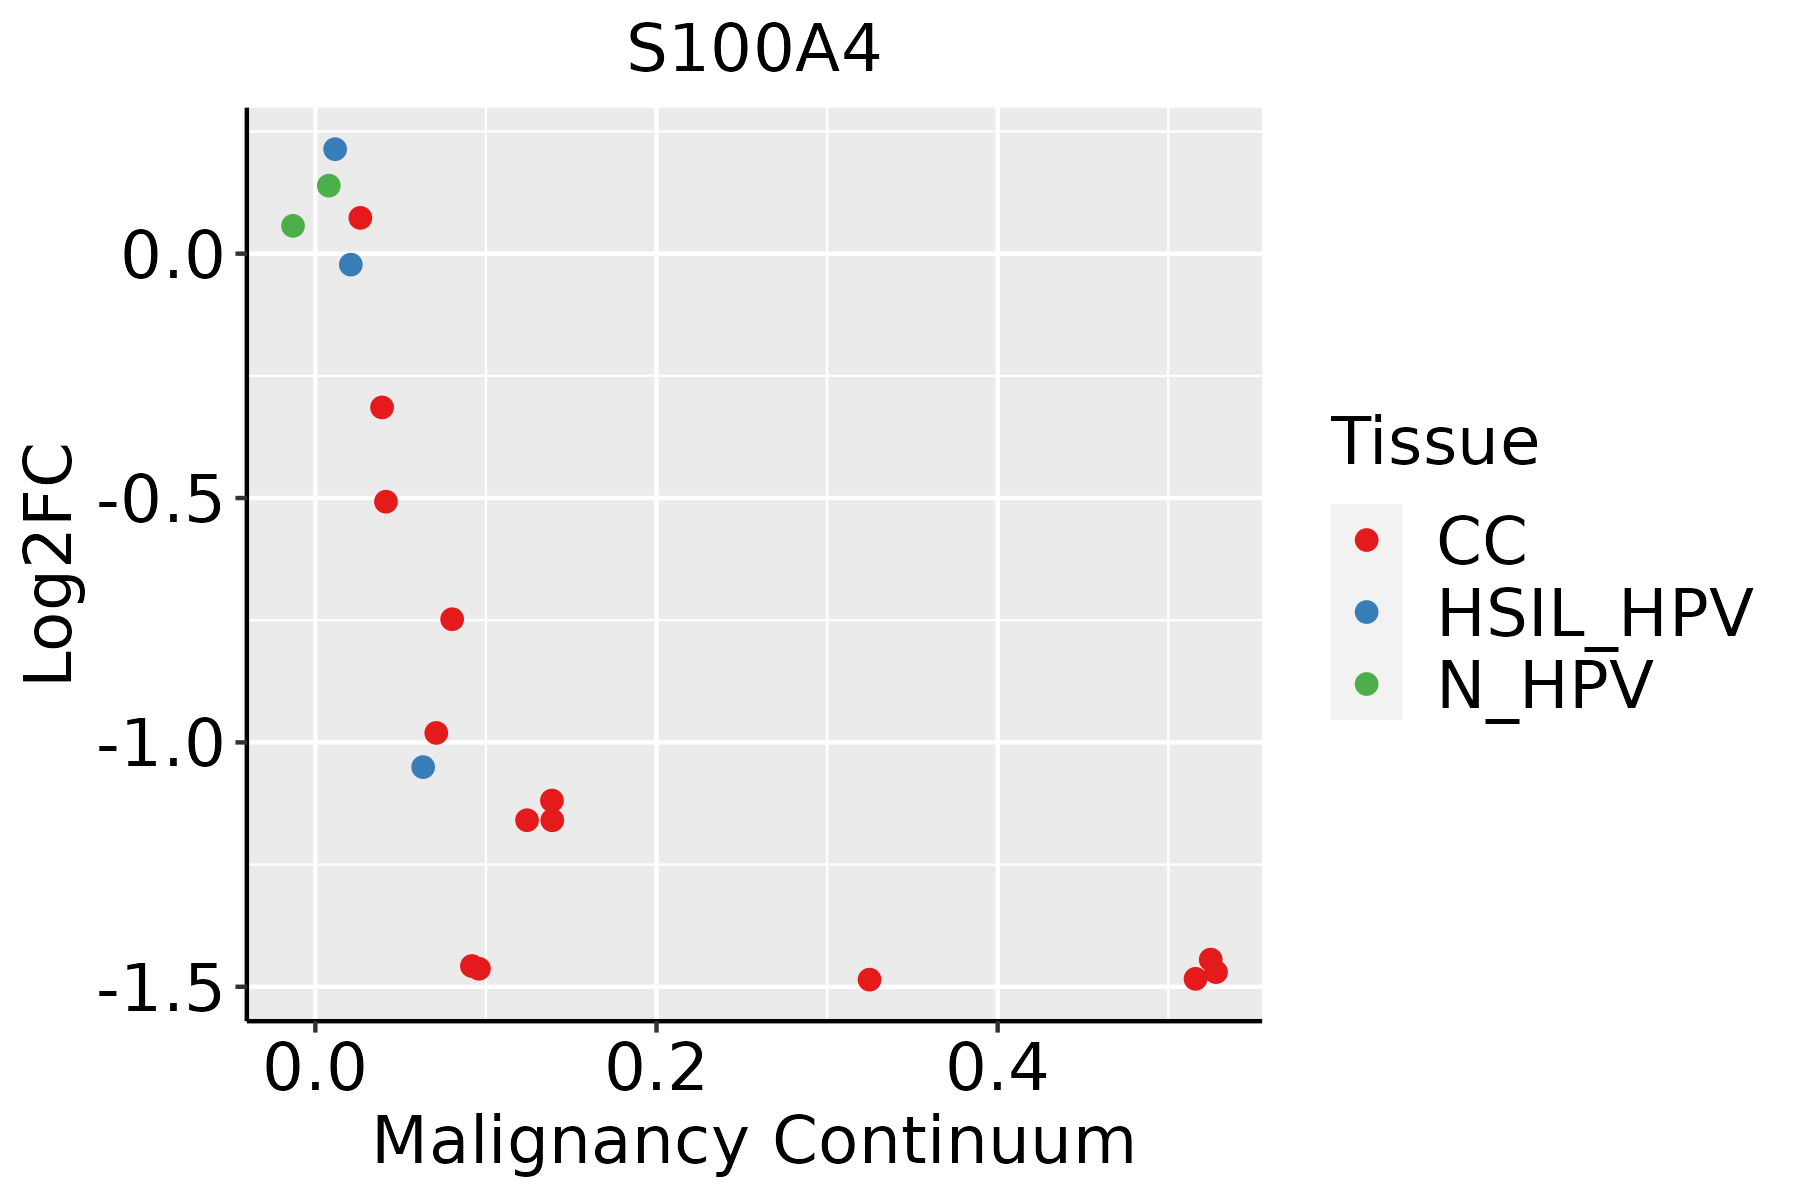 | CC: Cervix cancer |
| HSIL_HPV: HPV-infected high-grade squamous intraepithelial lesions | ||
| N_HPV: HPV-infected normal cervix | ||
| Endometrium | 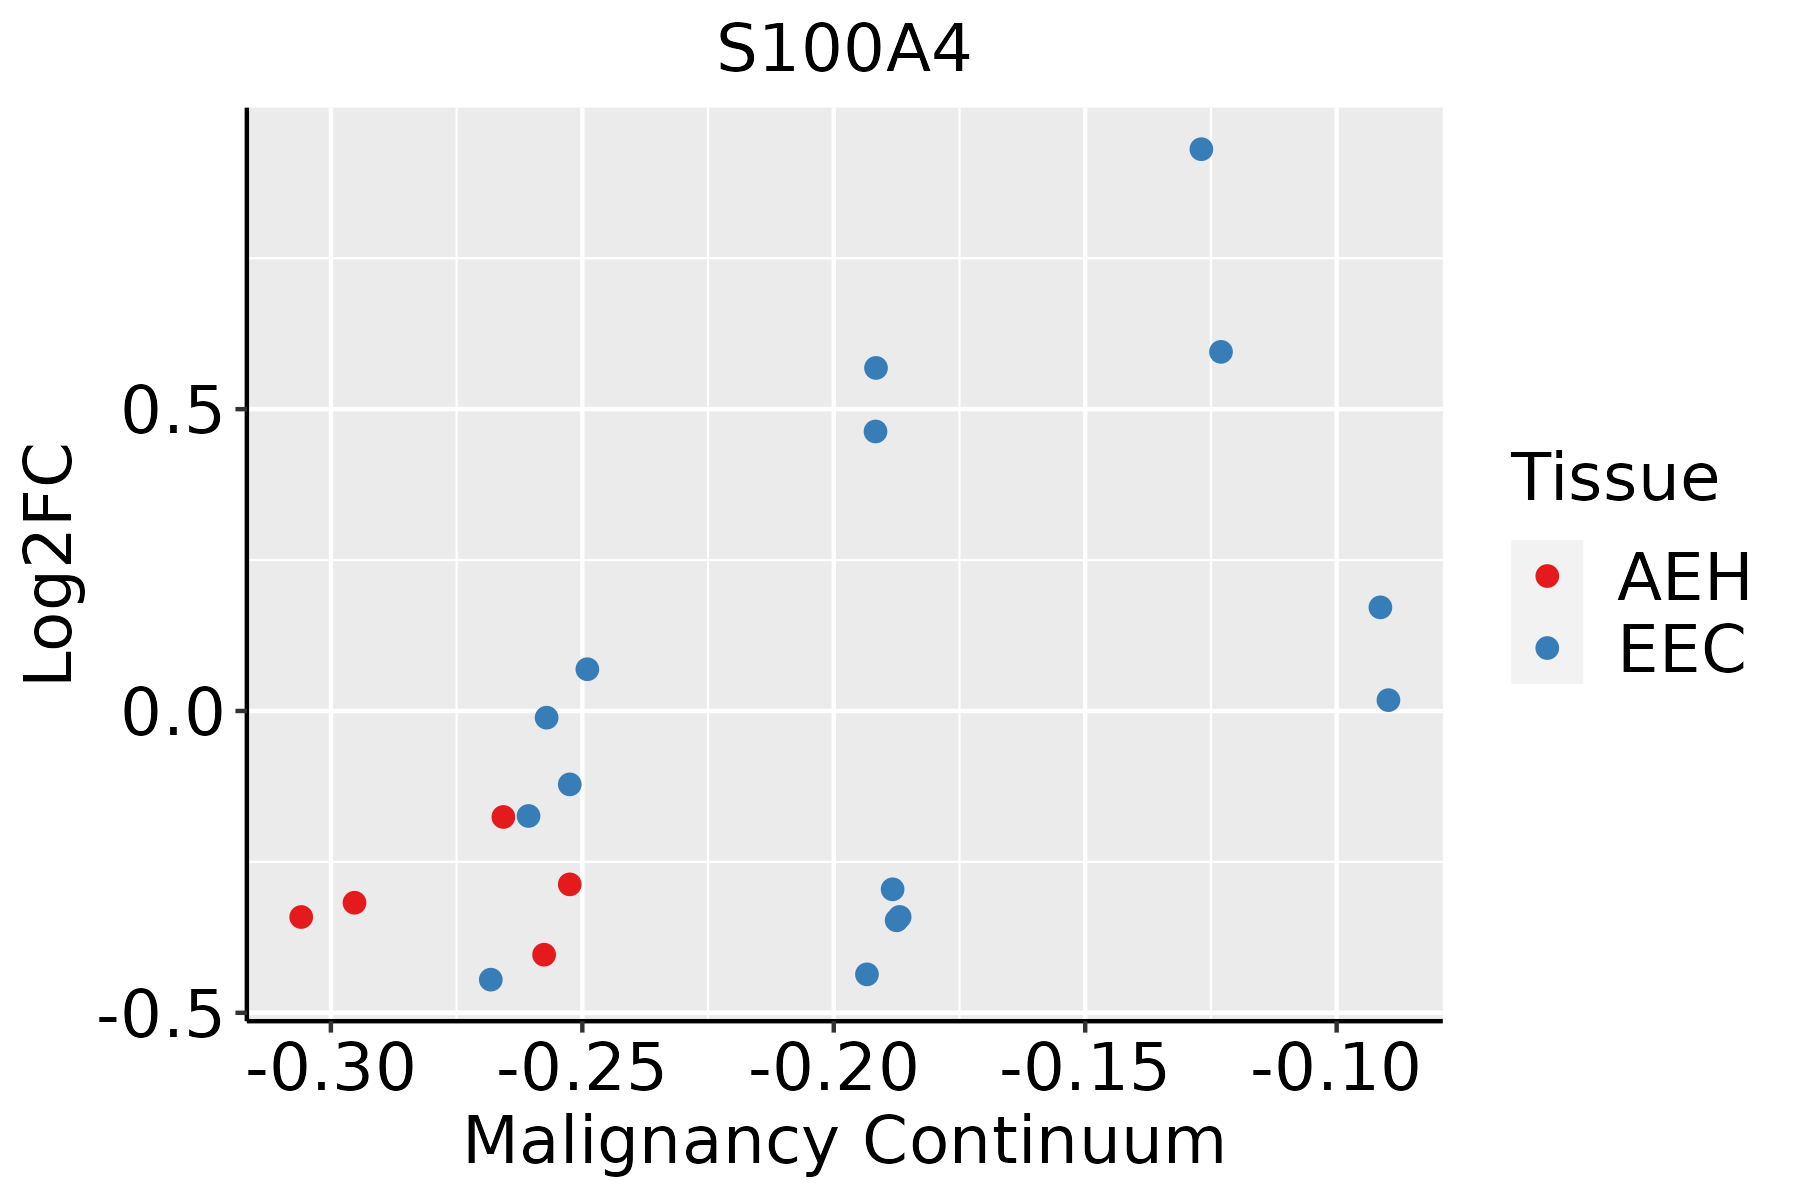 | AEH: Atypical endometrial hyperplasia |
| EEC: Endometrioid Cancer | ||
| Esophagus |  | ESCC: Esophageal squamous cell carcinoma |
| HGIN: High-grade intraepithelial neoplasias | ||
| LGIN: Low-grade intraepithelial neoplasias | ||
| GC | 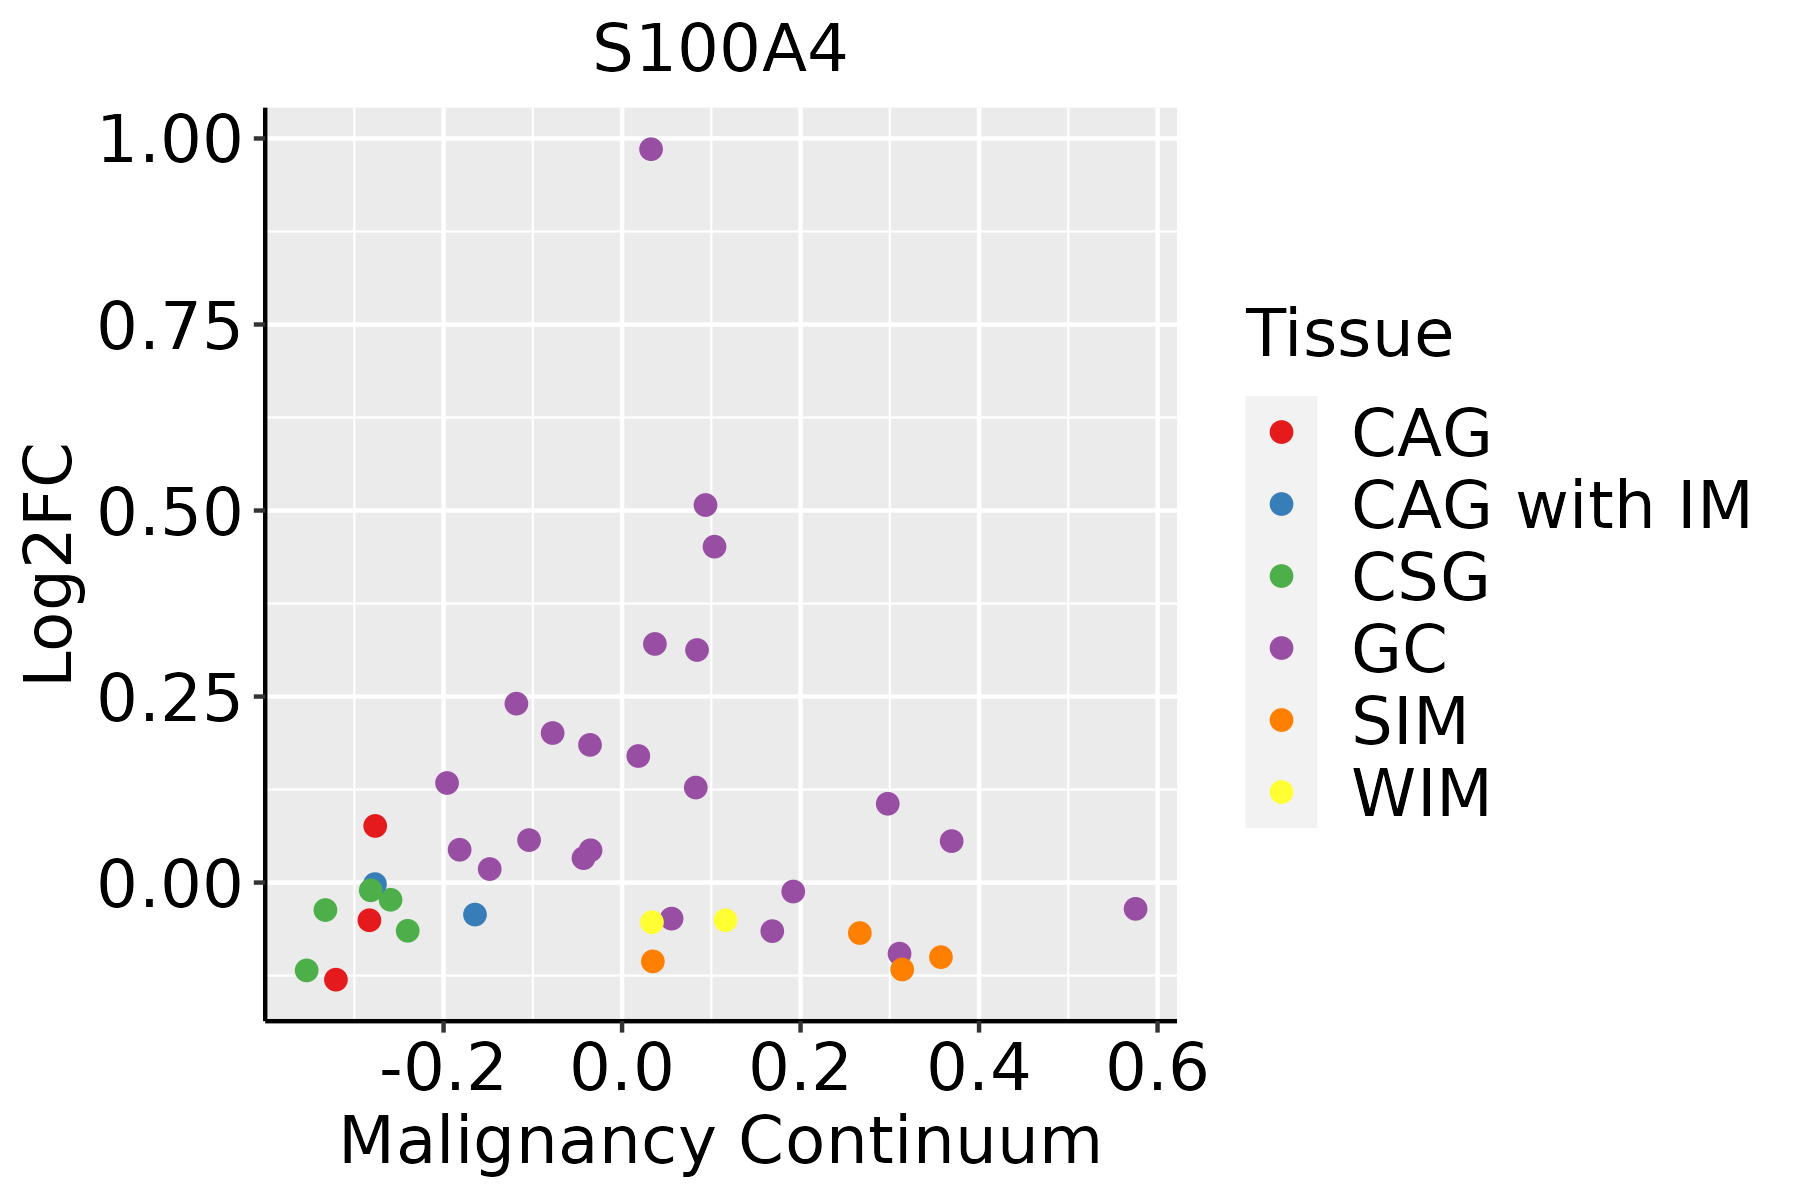 | CAG: Chronic atrophic gastritis |
| CAG with IM: Chronic atrophic gastritis with intestinal metaplasia | ||
| CSG: Chronic superficial gastritis | ||
| GC: Gastric cancer | ||
| SIM: Severe intestinal metaplasia | ||
| WIM: Wild intestinal metaplasia | ||
| Liver | 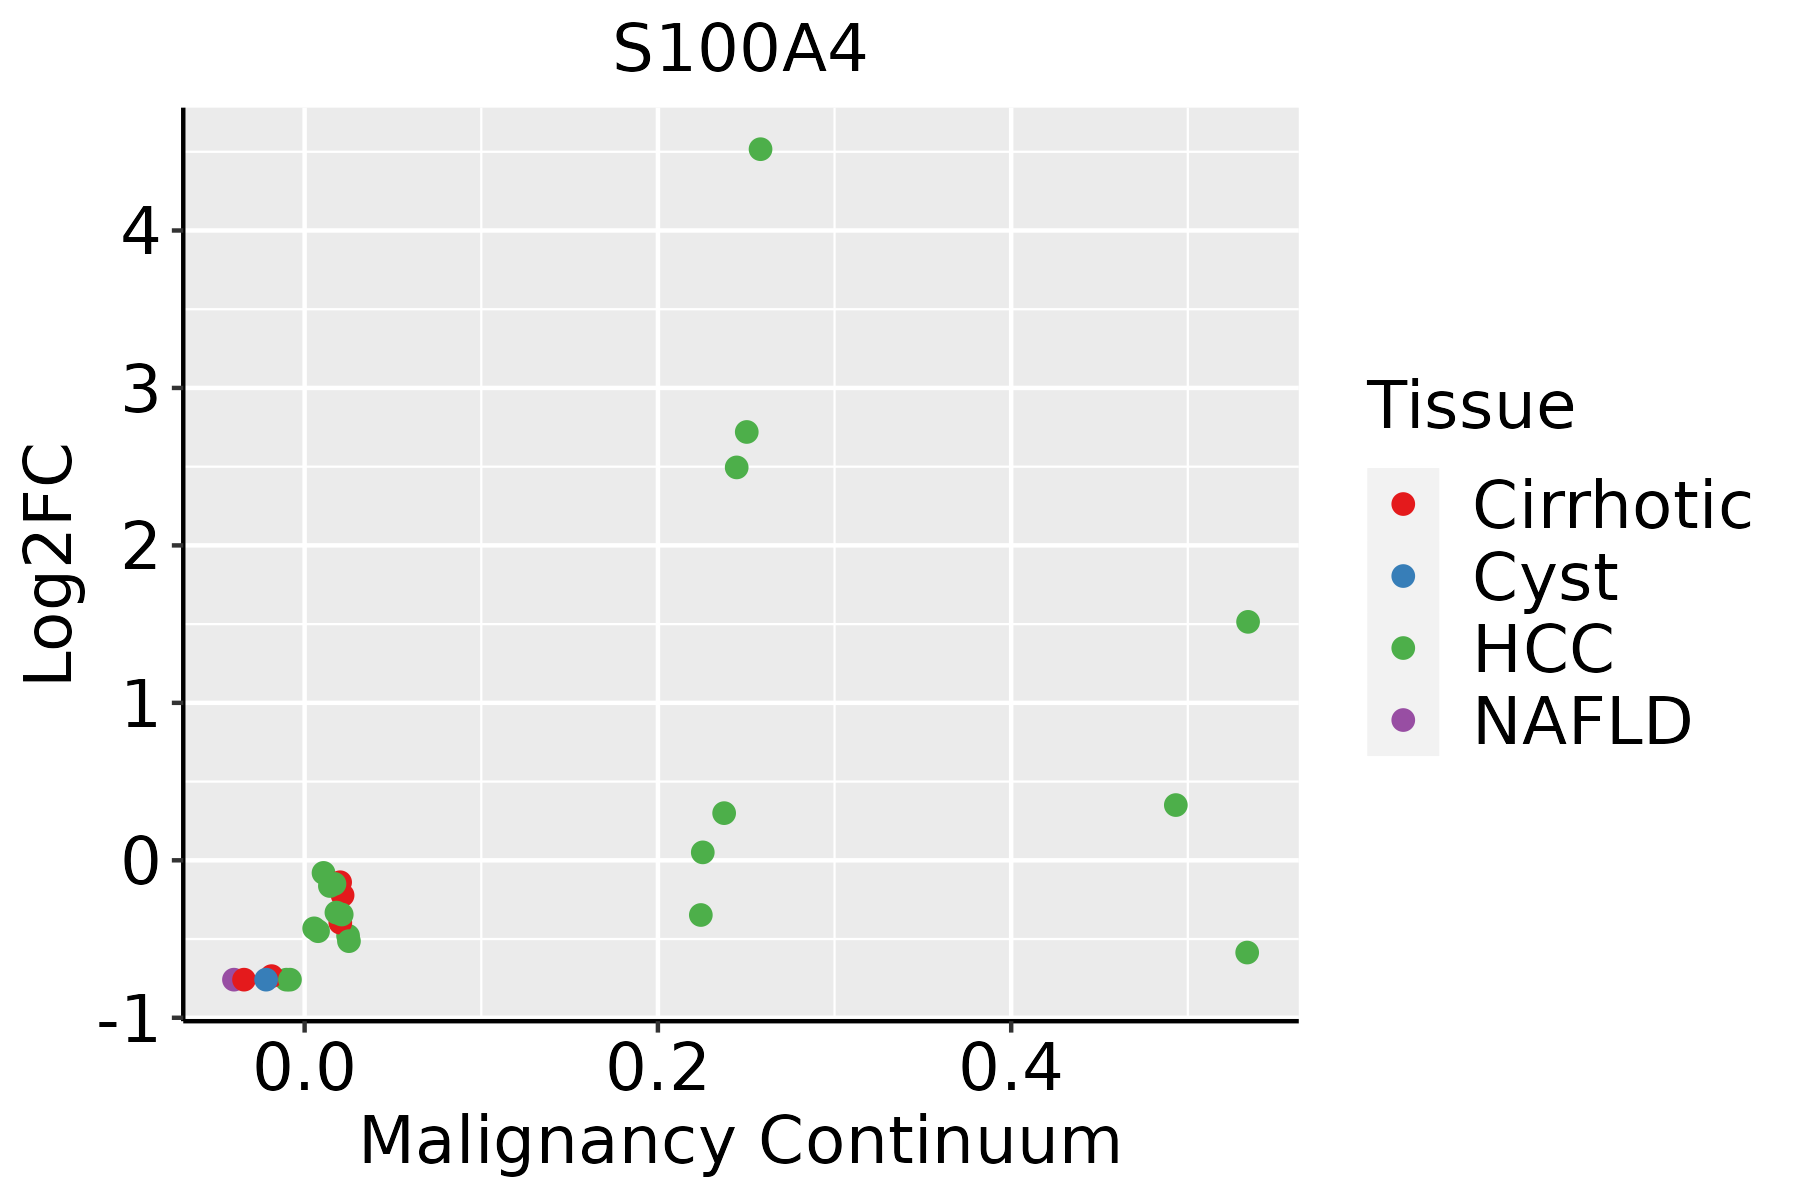 | HCC: Hepatocellular carcinoma |
| NAFLD: Non-alcoholic fatty liver disease | ||
| Lung | 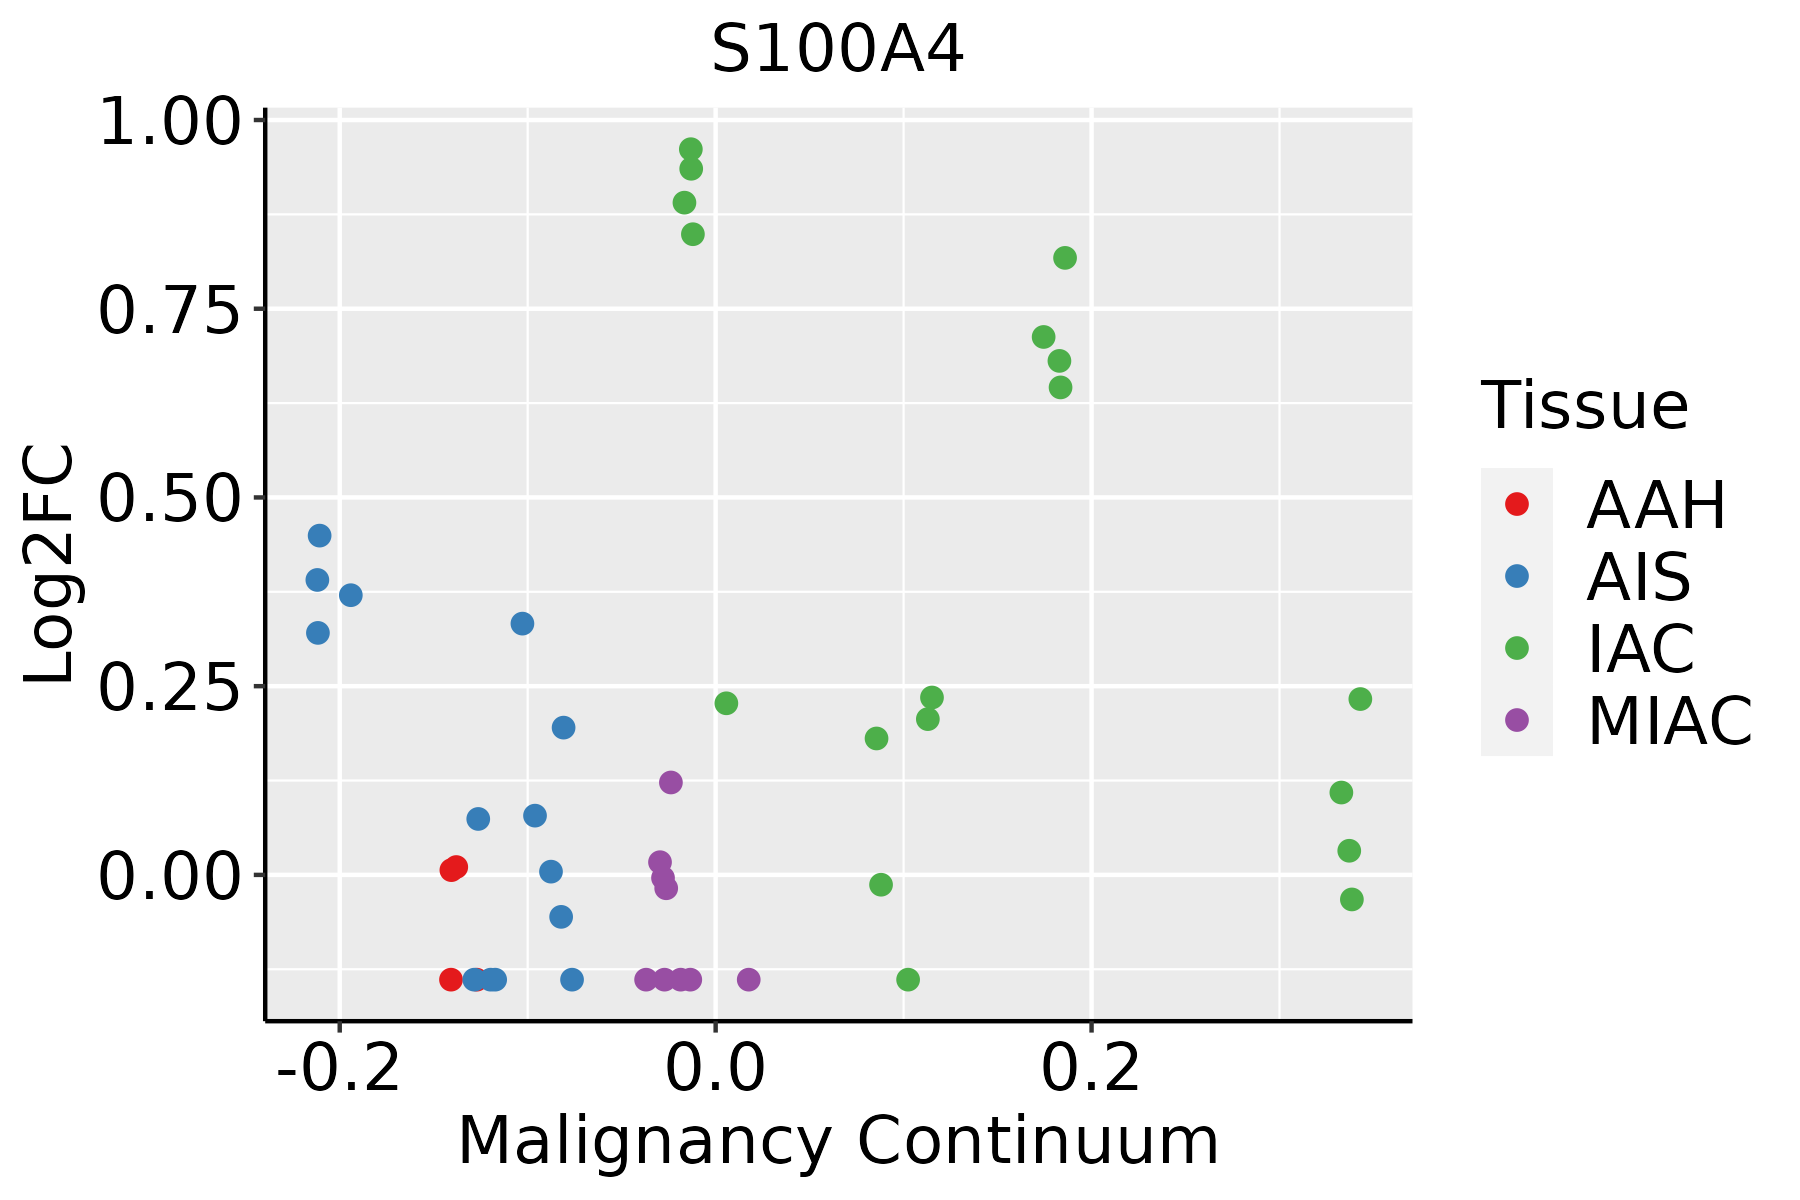 | AAH: Atypical adenomatous hyperplasia |
| AIS: Adenocarcinoma in situ | ||
| IAC: Invasive lung adenocarcinoma | ||
| MIA: Minimally invasive adenocarcinoma | ||
| Oral Cavity | 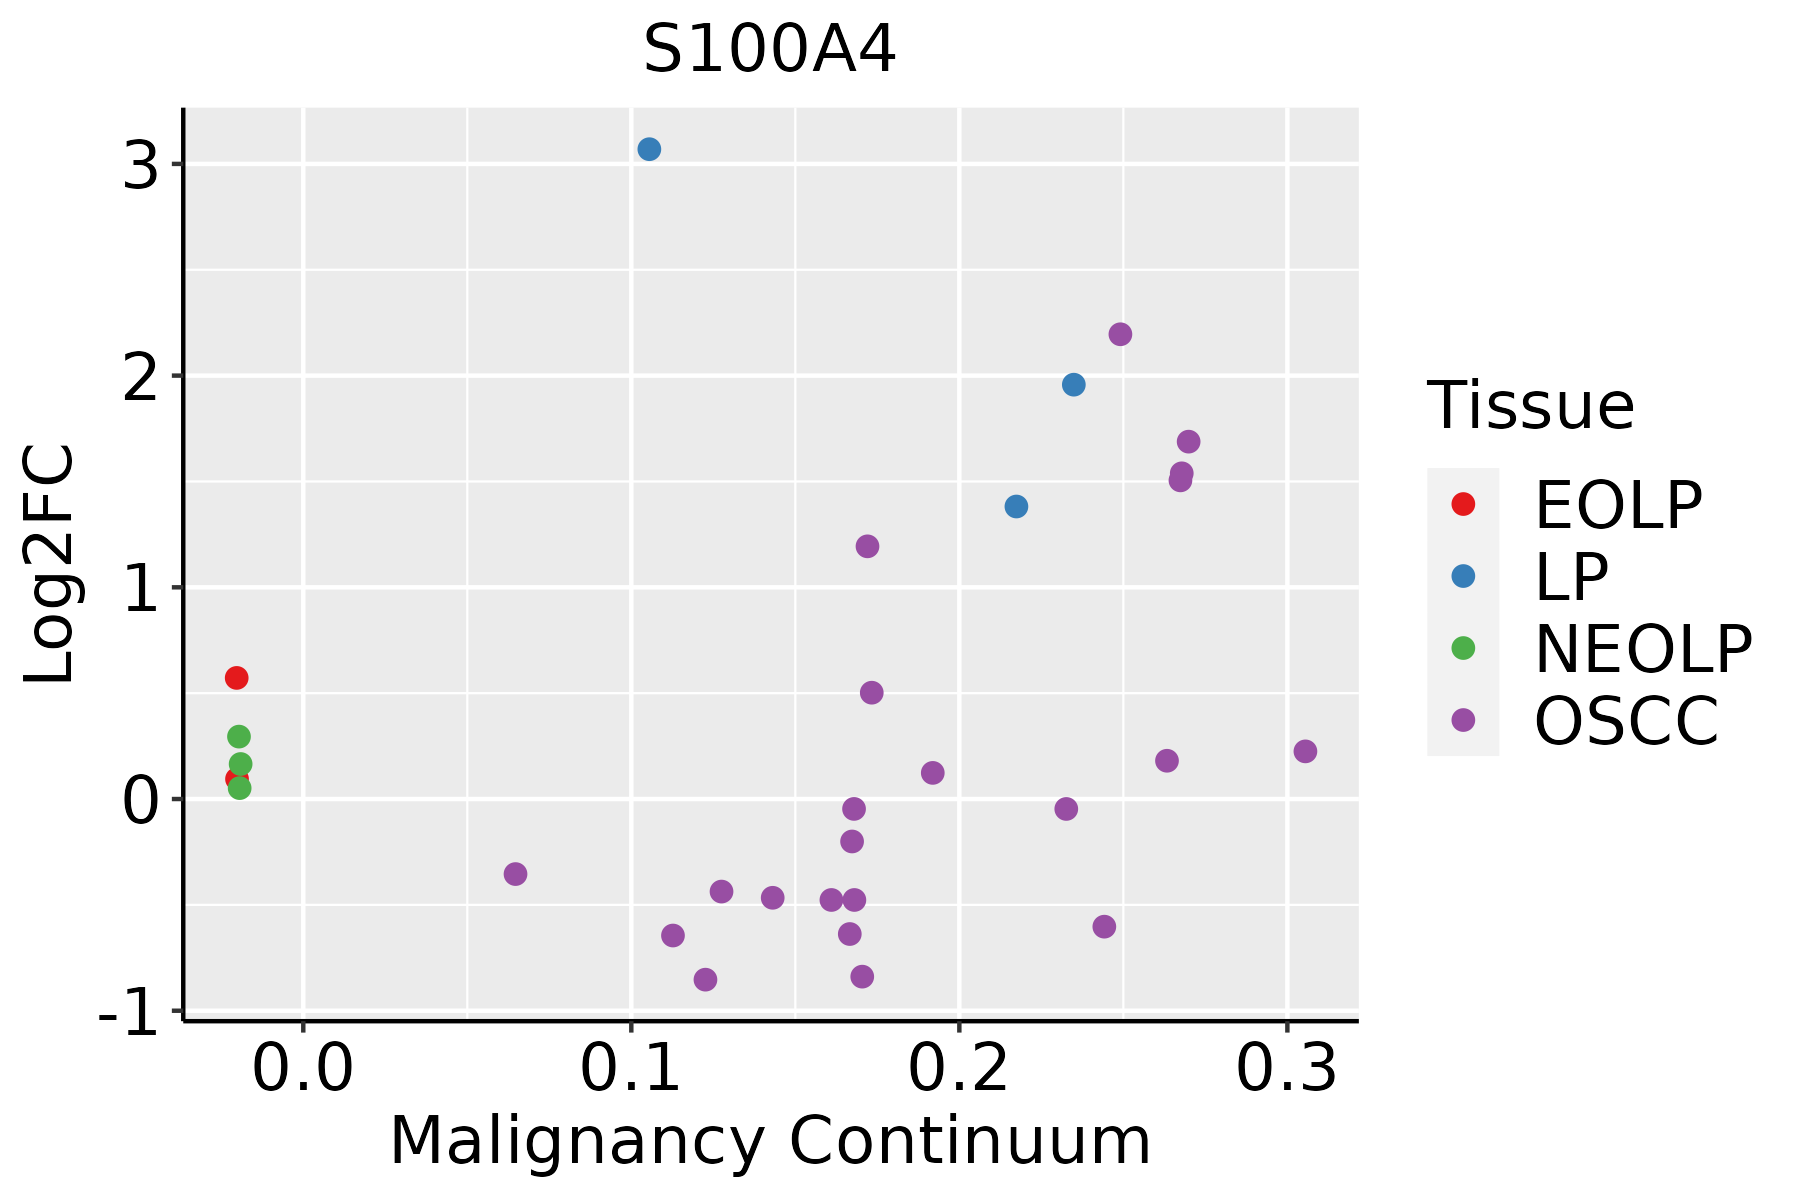 | EOLP: Erosive Oral lichen planus |
| LP: leukoplakia | ||
| NEOLP: Non-erosive oral lichen planus | ||
| OSCC: Oral squamous cell carcinoma | ||
| Skin | 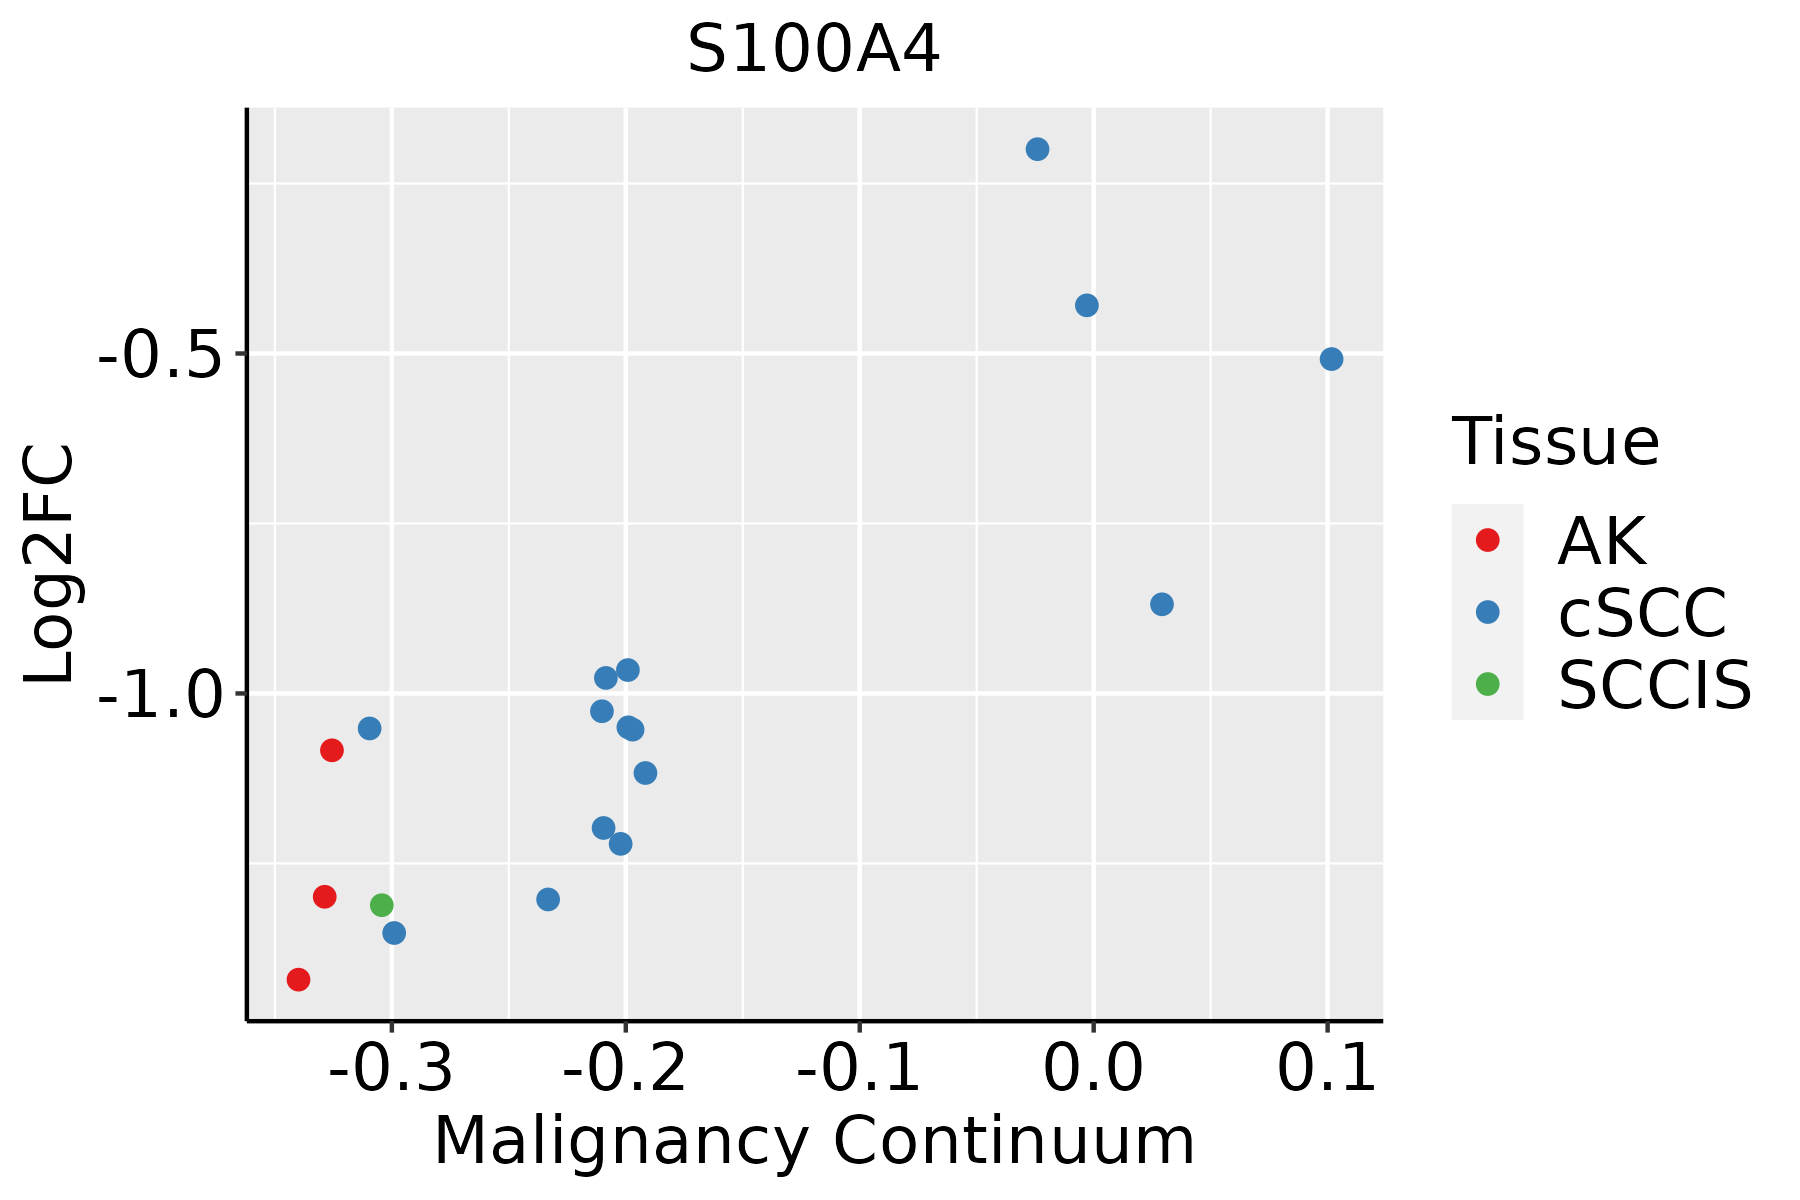 | AK: Actinic keratosis |
| cSCC: Cutaneous squamous cell carcinoma | ||
| SCCIS:squamous cell carcinoma in situ | ||
| Thyroid | 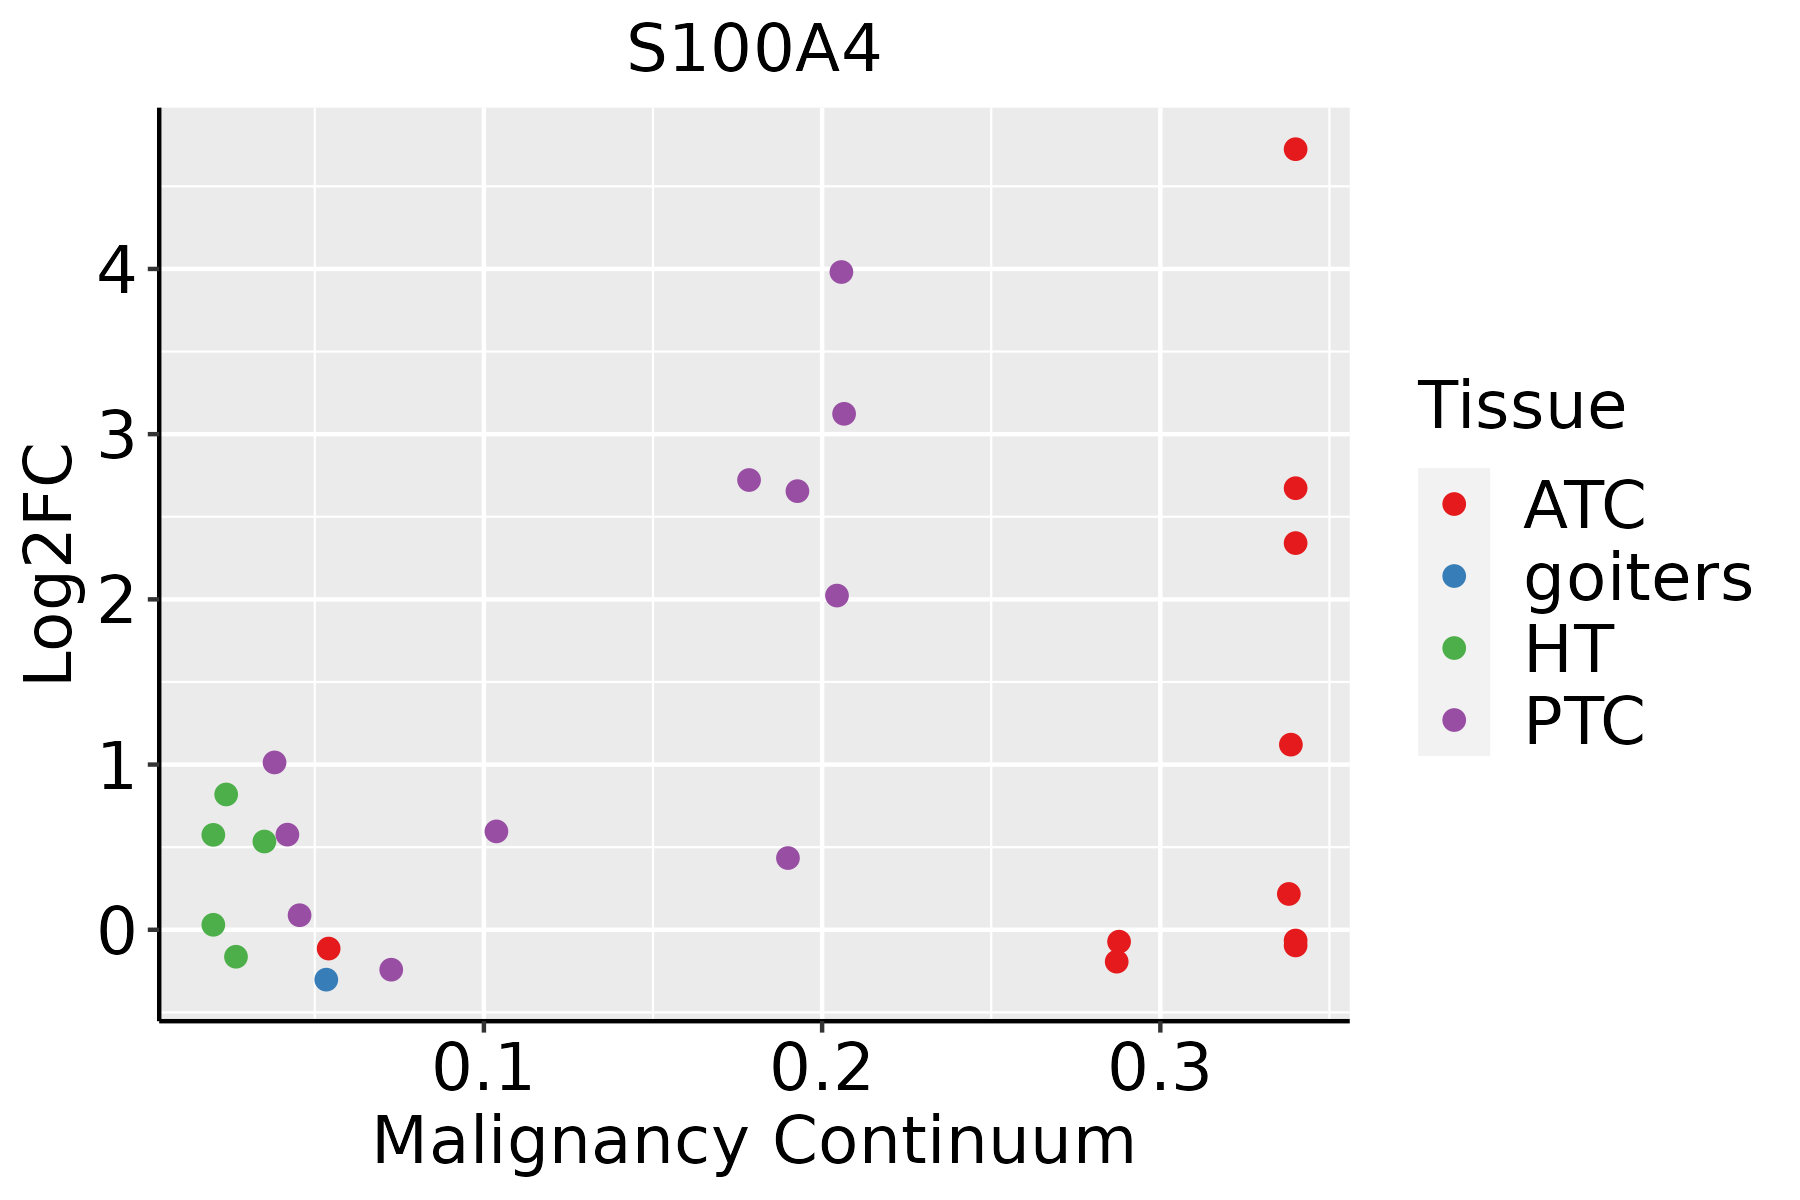 | ATC: Anaplastic thyroid cancer |
| HT: Hashimoto's thyroiditis | ||
| PTC: Papillary thyroid cancer |
| ∗log2FC in expression of this searched gene in stem-like cells from each diseased tissue sample relative to stem-like cells in normal samples in each tissue plotted against the malignancy continuum. Samples are colored based on if they are from different disease stage. |
Top |
Malignant transformation related pathway analysis |
| Find out the enriched GO biological processes and KEGG pathways involved in transition from healthy to precancer to cancer |
| Tissue | Disease Stage | Enriched GO biological Processes |
| Colorectum | AD |  |
| Colorectum | SER |  |
| Colorectum | MSS |  |
| Colorectum | MSI-H |  |
| Colorectum | FAP |  |
| ∗Top 15 enriched GO BP terms are showed in the bar plot of each disease state in each tissue. Each row represents a significant GO biological process which is colored according to the -log10(p.adjust). |
| Page: 1 2 3 4 5 6 7 8 9 |
| GO ID | Tissue | Disease Stage | Description | Gene Ratio | Bg Ratio | pvalue | p.adjust | Count |
| GO:00431227 | Breast | IDC | regulation of I-kappaB kinase/NF-kappaB signaling | 34/1434 | 249/18723 | 7.18e-04 | 8.77e-03 | 34 |
| GO:000724914 | Breast | IDC | I-kappaB kinase/NF-kappaB signaling | 37/1434 | 281/18723 | 8.58e-04 | 9.98e-03 | 37 |
| GO:000183711 | Breast | IDC | epithelial to mesenchymal transition | 23/1434 | 157/18723 | 1.97e-03 | 1.88e-02 | 23 |
| GO:00431236 | Breast | IDC | positive regulation of I-kappaB kinase/NF-kappaB signaling | 26/1434 | 186/18723 | 2.06e-03 | 1.95e-02 | 26 |
| GO:004312214 | Breast | DCIS | regulation of I-kappaB kinase/NF-kappaB signaling | 32/1390 | 249/18723 | 1.67e-03 | 1.66e-02 | 32 |
| GO:000724923 | Breast | DCIS | I-kappaB kinase/NF-kappaB signaling | 35/1390 | 281/18723 | 1.80e-03 | 1.74e-02 | 35 |
| GO:000183721 | Breast | DCIS | epithelial to mesenchymal transition | 22/1390 | 157/18723 | 2.92e-03 | 2.50e-02 | 22 |
| GO:004312313 | Breast | DCIS | positive regulation of I-kappaB kinase/NF-kappaB signaling | 24/1390 | 186/18723 | 5.66e-03 | 4.09e-02 | 24 |
| GO:00431228 | Cervix | CC | regulation of I-kappaB kinase/NF-kappaB signaling | 53/2311 | 249/18723 | 4.50e-05 | 6.87e-04 | 53 |
| GO:00072497 | Cervix | CC | I-kappaB kinase/NF-kappaB signaling | 56/2311 | 281/18723 | 1.81e-04 | 2.12e-03 | 56 |
| GO:00431237 | Cervix | CC | positive regulation of I-kappaB kinase/NF-kappaB signaling | 37/2311 | 186/18723 | 2.15e-03 | 1.55e-02 | 37 |
| GO:00018374 | Cervix | CC | epithelial to mesenchymal transition | 31/2311 | 157/18723 | 5.25e-03 | 3.08e-02 | 31 |
| GO:00487624 | Cervix | CC | mesenchymal cell differentiation | 42/2311 | 236/18723 | 9.12e-03 | 4.60e-02 | 42 |
| GO:004312215 | Cervix | HSIL_HPV | regulation of I-kappaB kinase/NF-kappaB signaling | 19/737 | 249/18723 | 4.66e-03 | 3.88e-02 | 19 |
| GO:00431229 | Endometrium | AEH | regulation of I-kappaB kinase/NF-kappaB signaling | 52/2100 | 249/18723 | 6.58e-06 | 1.59e-04 | 52 |
| GO:00431238 | Endometrium | AEH | positive regulation of I-kappaB kinase/NF-kappaB signaling | 41/2100 | 186/18723 | 1.59e-05 | 3.32e-04 | 41 |
| GO:00072498 | Endometrium | AEH | I-kappaB kinase/NF-kappaB signaling | 55/2100 | 281/18723 | 2.60e-05 | 4.88e-04 | 55 |
| GO:00487625 | Endometrium | AEH | mesenchymal cell differentiation | 46/2100 | 236/18723 | 1.27e-04 | 1.74e-03 | 46 |
| GO:00604853 | Endometrium | AEH | mesenchyme development | 54/2100 | 291/18723 | 1.34e-04 | 1.83e-03 | 54 |
| GO:00018375 | Endometrium | AEH | epithelial to mesenchymal transition | 33/2100 | 157/18723 | 2.64e-04 | 3.09e-03 | 33 |
| Page: 1 2 3 4 5 6 |
| Pathway ID | Tissue | Disease Stage | Description | Gene Ratio | Bg Ratio | pvalue | p.adjust | qvalue | Count |
| Page: 1 |
Top |
Cell-cell communication analysis |
| Identification of potential cell-cell interactions between two cell types and their ligand-receptor pairs for different disease states |
| Ligand | Receptor | LRpair | Pathway | Tissue | Disease Stage |
| Page: 1 |
Top |
Single-cell gene regulatory network inference analysis |
| Find out the significant the regulons (TFs) and the target genes of each regulon across cell types for different disease states |
| TF | Cell Type | Tissue | Disease Stage | Target Gene | RSS | Regulon Activity |
| ∗The dot plots of a searched regulon are shown for all cell subpopulations in each disease state of each tissue based on the regulon specific score inferred using pySCENIC and by calculating the average expression. |
| Page: 1 |
Top |
Somatic mutation of malignant transformation related genes |
| Annotation of somatic variants for genes involved in malignant transformation |
| Hugo Symbol | Variant Class | Variant Classification | dbSNP RS | HGVSc | HGVSp | HGVSp Short | SWISSPROT | BIOTYPE | SIFT | PolyPhen | Tumor Sample Barcode | Tissue | Histology | Sex | Age | Stage | Therapy Types | Drugs | Outcome |
| S100A4 | SNV | Missense_Mutation | novel | c.277T>G | p.Phe93Val | p.F93V | P26447 | protein_coding | tolerated(0.5) | benign(0.003) | TCGA-AZ-4315-01 | Colorectum | colon adenocarcinoma | Male | <65 | I/II | Unknown | Unknown | SD |
| S100A4 | SNV | Missense_Mutation | novel | c.194N>G | p.Asn65Ser | p.N65S | P26447 | protein_coding | deleterious(0) | probably_damaging(0.92) | TCGA-CA-6717-01 | Colorectum | colon adenocarcinoma | Male | <65 | I/II | Chemotherapy | oxaliplatin | CR |
| S100A4 | SNV | Missense_Mutation | novel | c.263N>C | p.Glu88Ala | p.E88A | P26447 | protein_coding | deleterious(0.01) | benign(0.127) | TCGA-A5-A2K5-01 | Endometrium | uterine corpus endometrioid carcinoma | Female | >=65 | I/II | Unknown | Unknown | SD |
| S100A4 | SNV | Missense_Mutation | c.247N>A | p.Ala83Thr | p.A83T | P26447 | protein_coding | tolerated(1) | benign(0.162) | TCGA-AX-A06F-01 | Endometrium | uterine corpus endometrioid carcinoma | Female | <65 | III/IV | Chemotherapy | carboplatin | SD | |
| S100A4 | SNV | Missense_Mutation | novel | c.235C>A | p.Leu79Met | p.L79M | P26447 | protein_coding | deleterious(0.01) | probably_damaging(0.993) | TCGA-B5-A1MX-01 | Endometrium | uterine corpus endometrioid carcinoma | Female | <65 | I/II | Hormone Therapy | megace | SD |
| S100A4 | SNV | Missense_Mutation | novel | c.98N>G | p.Glu33Gly | p.E33G | P26447 | protein_coding | deleterious(0) | probably_damaging(0.999) | TCGA-B5-A3FA-01 | Endometrium | uterine corpus endometrioid carcinoma | Female | >=65 | I/II | Unknown | Unknown | SD |
| S100A4 | SNV | Missense_Mutation | novel | c.300N>T | p.Lys100Asn | p.K100N | P26447 | protein_coding | deleterious(0) | benign(0.395) | TCGA-BK-A6W3-01 | Endometrium | uterine corpus endometrioid carcinoma | Female | <65 | I/II | Unknown | Unknown | SD |
| S100A4 | SNV | Missense_Mutation | rs368160023 | c.262N>A | p.Glu88Lys | p.E88K | P26447 | protein_coding | deleterious(0.01) | benign(0.098) | TCGA-E6-A1LX-01 | Endometrium | uterine corpus endometrioid carcinoma | Female | <65 | I/II | Unknown | Unknown | SD |
| S100A4 | SNV | Missense_Mutation | novel | c.205N>A | p.Glu69Lys | p.E69K | P26447 | protein_coding | deleterious(0.04) | possibly_damaging(0.488) | TCGA-EO-A22R-01 | Endometrium | uterine corpus endometrioid carcinoma | Female | <65 | I/II | Unknown | Unknown | SD |
| S100A4 | SNV | Missense_Mutation | c.247G>A | p.Ala83Thr | p.A83T | P26447 | protein_coding | tolerated(1) | benign(0.162) | TCGA-FI-A2D0-01 | Endometrium | uterine corpus endometrioid carcinoma | Female | <65 | I/II | Unknown | Unknown | SD |
| Page: 1 2 |
Top |
Related drugs of malignant transformation related genes |
| Identification of chemicals and drugs interact with genes involved in malignant transfromation |
| (DGIdb 4.0) |
| Entrez ID | Symbol | Category | Interaction Types | Drug Claim Name | Drug Name | PMIDs |
| 6275 | S100A4 | NA | SP-MET-1 | |||
| 6275 | S100A4 | NA | DOXORUBICIN HYDROCHLORIDE | DOXORUBICIN HYDROCHLORIDE | ||
| 6275 | S100A4 | NA | DAUNORUBICIN HYDROCHLORIDE | DAUNORUBICIN HYDROCHLORIDE | ||
| 6275 | S100A4 | NA | GNF-PF-4459 | CHEMBL585502 |
| Page: 1 |

Copyright 2023-Present -The University of Texas Health Science Center at Houston |