
|
|||||
|
 | |
| |
| |
| |
| |
| |
|
Gene: S100A3 |
Gene summary for S100A3 |
| Gene information | Species | Human | Gene symbol | S100A3 | Gene ID | 6274 |
| Gene name | S100 calcium binding protein A3 | |
| Gene Alias | S100E | |
| Cytomap | 1q21.3 | |
| Gene Type | protein-coding | GO ID | GO:0005575 | UniProtAcc | P33764 |
Top |
Malignant transformation analysis |
| Identification of the aberrant gene expression in precancerous and cancerous lesions by comparing the gene expression of stem-like cells in diseased tissues with normal stem cells |
| Entrez ID | Symbol | Replicates | Species | Organ | Tissue | Adj P-value | Log2FC | Malignancy |
| 6274 | S100A3 | C04 | Human | Oral cavity | OSCC | 9.99e-04 | 4.13e-01 | 0.2633 |
| 6274 | S100A3 | C21 | Human | Oral cavity | OSCC | 5.73e-13 | 4.35e-01 | 0.2678 |
| 6274 | S100A3 | C30 | Human | Oral cavity | OSCC | 9.89e-12 | 5.99e-01 | 0.3055 |
| 6274 | S100A3 | C51 | Human | Oral cavity | OSCC | 4.51e-15 | 6.99e-01 | 0.2674 |
| 6274 | S100A3 | SYSMH2 | Human | Oral cavity | OSCC | 1.60e-09 | 3.29e-01 | 0.2326 |
| 6274 | S100A3 | SYSMH3 | Human | Oral cavity | OSCC | 2.50e-12 | 2.56e-01 | 0.2442 |
| 6274 | S100A3 | SYSMH5 | Human | Oral cavity | OSCC | 1.58e-05 | 1.57e-01 | 0.0647 |
| 6274 | S100A3 | ATC2 | Human | Thyroid | ATC | 4.17e-22 | 1.51e+00 | 0.34 |
| 6274 | S100A3 | ATC4 | Human | Thyroid | ATC | 1.40e-02 | 1.35e-01 | 0.34 |
| Page: 1 |
| Tissue | Expression Dynamics | Abbreviation |
| Oral Cavity | 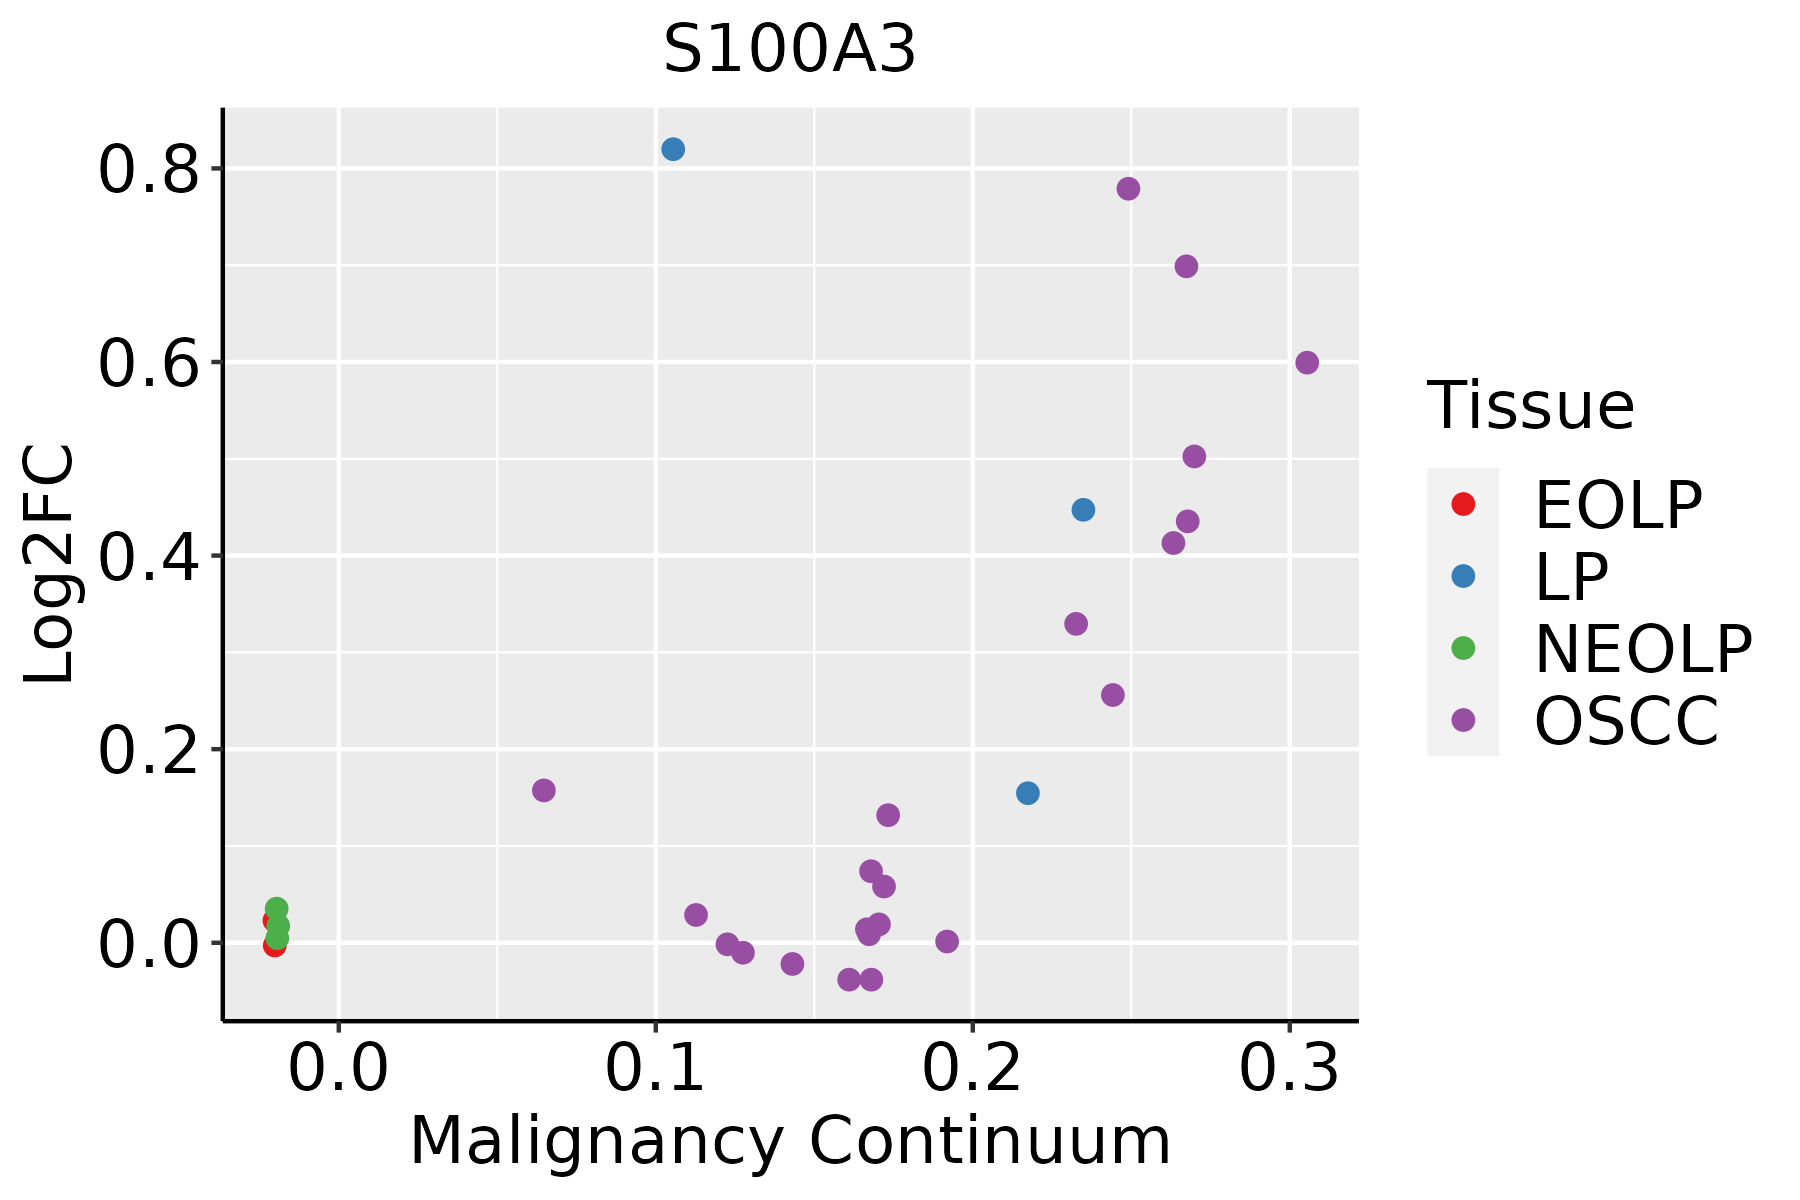 | EOLP: Erosive Oral lichen planus |
| LP: leukoplakia | ||
| NEOLP: Non-erosive oral lichen planus | ||
| OSCC: Oral squamous cell carcinoma | ||
| Thyroid | 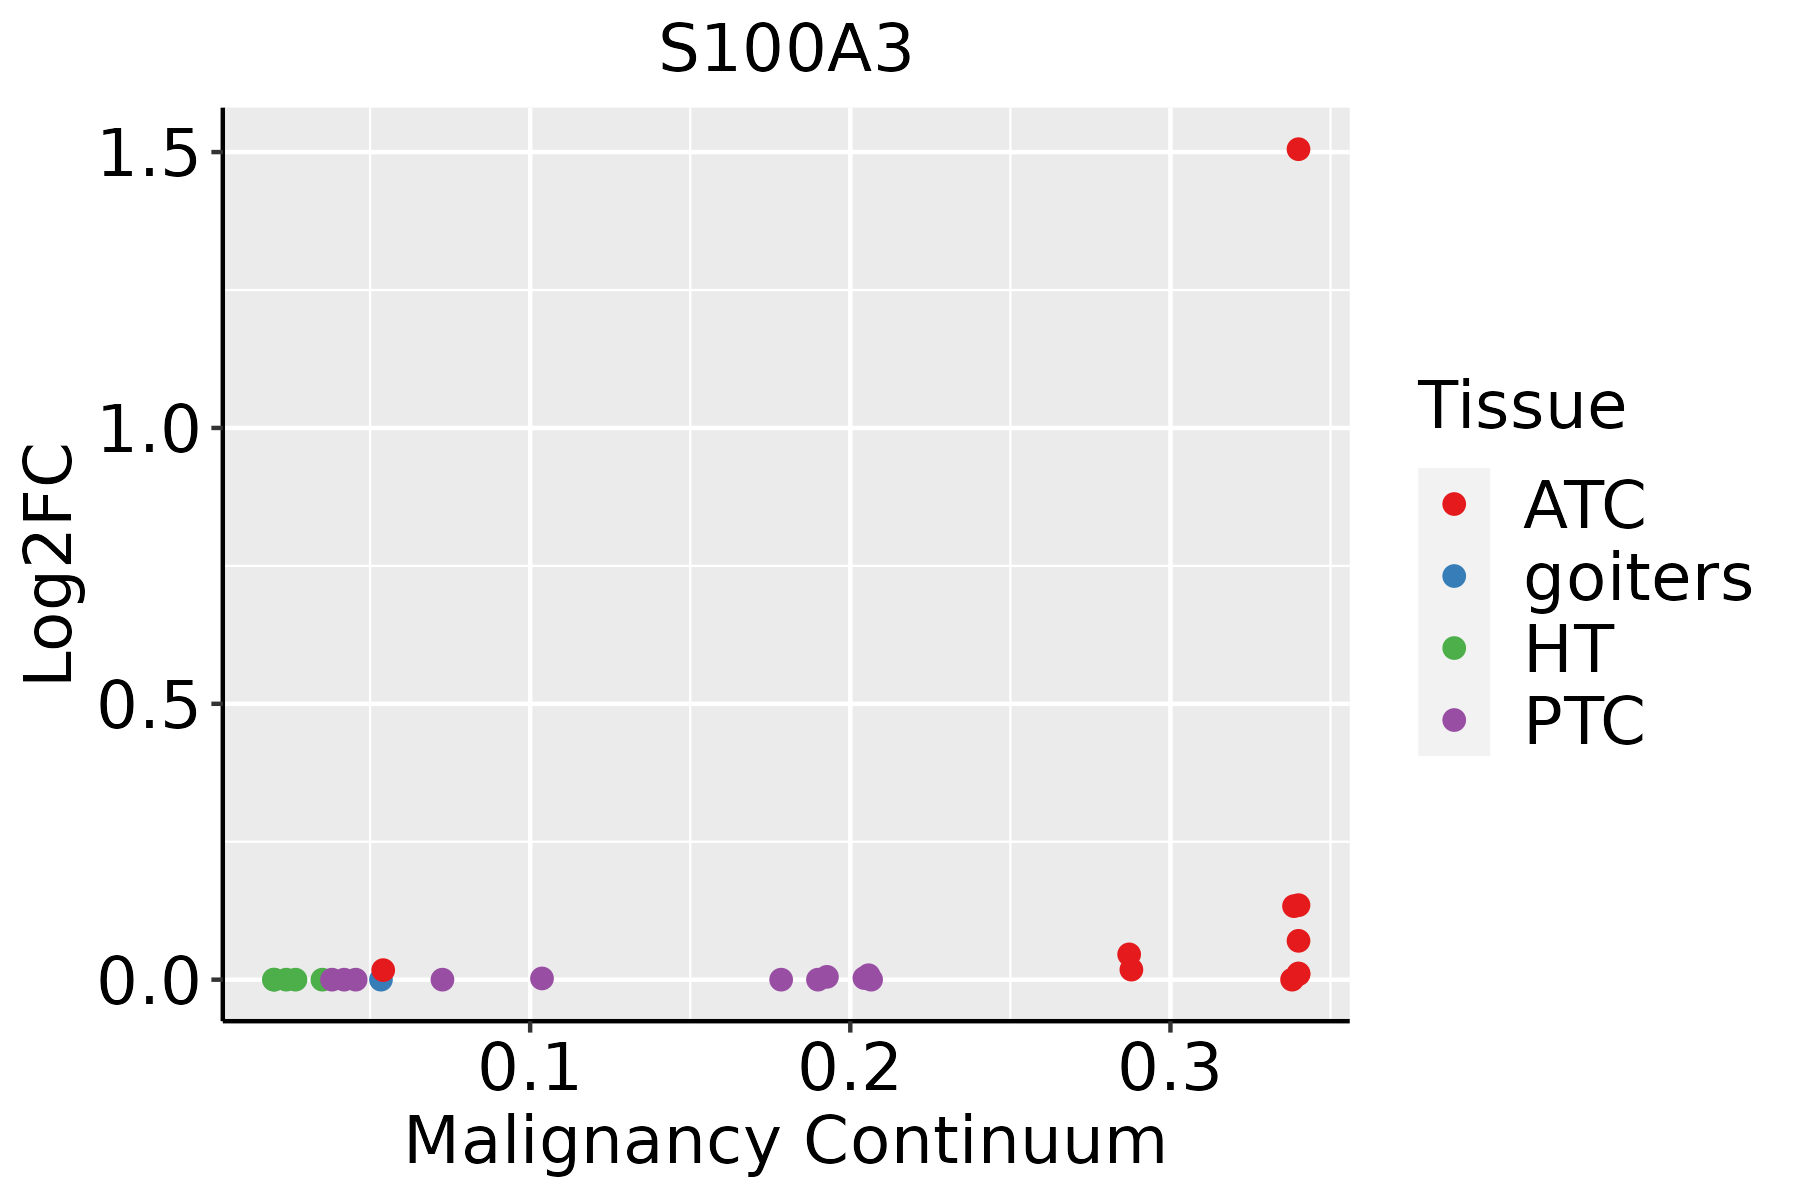 | ATC: Anaplastic thyroid cancer |
| HT: Hashimoto's thyroiditis | ||
| PTC: Papillary thyroid cancer |
| ∗log2FC in expression of this searched gene in stem-like cells from each diseased tissue sample relative to stem-like cells in normal samples in each tissue plotted against the malignancy continuum. Samples are colored based on if they are from different disease stage. |
Top |
Malignant transformation related pathway analysis |
| Find out the enriched GO biological processes and KEGG pathways involved in transition from healthy to precancer to cancer |
| Tissue | Disease Stage | Enriched GO biological Processes |
| Colorectum | AD |  |
| Colorectum | SER |  |
| Colorectum | MSS |  |
| Colorectum | MSI-H |  |
| Colorectum | FAP |  |
| ∗Top 15 enriched GO BP terms are showed in the bar plot of each disease state in each tissue. Each row represents a significant GO biological process which is colored according to the -log10(p.adjust). |
| Page: 1 2 3 4 5 6 7 8 9 |
| GO ID | Tissue | Disease Stage | Description | Gene Ratio | Bg Ratio | pvalue | p.adjust | Count |
| Page: 1 |
| Pathway ID | Tissue | Disease Stage | Description | Gene Ratio | Bg Ratio | pvalue | p.adjust | qvalue | Count |
| Page: 1 |
Top |
Cell-cell communication analysis |
| Identification of potential cell-cell interactions between two cell types and their ligand-receptor pairs for different disease states |
| Ligand | Receptor | LRpair | Pathway | Tissue | Disease Stage |
| Page: 1 |
Top |
Single-cell gene regulatory network inference analysis |
| Find out the significant the regulons (TFs) and the target genes of each regulon across cell types for different disease states |
| TF | Cell Type | Tissue | Disease Stage | Target Gene | RSS | Regulon Activity |
| ∗The dot plots of a searched regulon are shown for all cell subpopulations in each disease state of each tissue based on the regulon specific score inferred using pySCENIC and by calculating the average expression. |
| Page: 1 |
Top |
Somatic mutation of malignant transformation related genes |
| Annotation of somatic variants for genes involved in malignant transformation |
| Hugo Symbol | Variant Class | Variant Classification | dbSNP RS | HGVSc | HGVSp | HGVSp Short | SWISSPROT | BIOTYPE | SIFT | PolyPhen | Tumor Sample Barcode | Tissue | Histology | Sex | Age | Stage | Therapy Types | Drugs | Outcome |
| S100A3 | SNV | Missense_Mutation | novel | c.274N>A | p.Asp92Asn | p.D92N | P33764 | protein_coding | tolerated(0.17) | benign(0) | TCGA-LL-A5YO-01 | Breast | breast invasive carcinoma | Female | <65 | I/II | Chemotherapy | taxotere | CR |
| S100A3 | insertion | Nonsense_Mutation | novel | c.88_89insTTCTTTGGGATCTTTGAGA | p.Cys30PhefsTer6 | p.C30Ffs*6 | P33764 | protein_coding | TCGA-BH-A0B8-01 | Breast | breast invasive carcinoma | Female | <65 | I/II | Hormone Therapy | arimidex | SD | ||
| S100A3 | SNV | Missense_Mutation | rs772235092 | c.205N>A | p.Glu69Lys | p.E69K | P33764 | protein_coding | deleterious(0.04) | benign(0.001) | TCGA-A5-A0G2-01 | Endometrium | uterine corpus endometrioid carcinoma | Female | <65 | III/IV | Unknown | Unknown | SD |
| S100A3 | SNV | Missense_Mutation | rs566984814 | c.152G>A | p.Arg51Gln | p.R51Q | P33764 | protein_coding | tolerated(0.36) | benign(0) | TCGA-B5-A11E-01 | Endometrium | uterine corpus endometrioid carcinoma | Female | <65 | I/II | Unknown | Unknown | SD |
| S100A3 | SNV | Missense_Mutation | novel | c.269T>C | p.Phe90Ser | p.F90S | P33764 | protein_coding | deleterious(0.02) | probably_damaging(0.99) | TCGA-DF-A2KN-01 | Endometrium | uterine corpus endometrioid carcinoma | Female | Unknown | I/II | Unknown | Unknown | SD |
| S100A3 | SNV | Missense_Mutation | novel | c.77N>C | p.Lys26Thr | p.K26T | P33764 | protein_coding | deleterious(0) | benign(0.245) | TCGA-E6-A1LX-01 | Endometrium | uterine corpus endometrioid carcinoma | Female | <65 | I/II | Unknown | Unknown | SD |
| S100A3 | SNV | Missense_Mutation | novel | c.223N>A | p.Tyr75Asn | p.Y75N | P33764 | protein_coding | deleterious(0) | possibly_damaging(0.766) | TCGA-DD-AAC8-01 | Liver | liver hepatocellular carcinoma | Male | >=65 | I/II | Unknown | Unknown | SD |
| S100A3 | SNV | Missense_Mutation | novel | c.25N>A | p.Val9Ile | p.V9I | P33764 | protein_coding | tolerated(0.18) | benign(0.001) | TCGA-77-6844-01 | Lung | lung squamous cell carcinoma | Male | >=65 | III/IV | Unknown | Unknown | PD |
| S100A3 | SNV | Missense_Mutation | rs761565452 | c.284N>T | p.Ser95Leu | p.S95L | P33764 | protein_coding | tolerated(0.36) | benign(0) | TCGA-MF-A522-01 | Lung | lung squamous cell carcinoma | Male | <65 | I/II | Chemotherapy | cisplatin | PD |
| S100A3 | SNV | Missense_Mutation | rs778353602 | c.230G>A | p.Arg77His | p.R77H | P33764 | protein_coding | tolerated(0.6) | benign(0) | TCGA-XK-AAIW-01 | Prostate | prostate adenocarcinoma | Male | >=65 | 9 | Unknown | Unknown | PD |
| Page: 1 2 |
Top |
Related drugs of malignant transformation related genes |
| Identification of chemicals and drugs interact with genes involved in malignant transfromation |
| (DGIdb 4.0) |
| Entrez ID | Symbol | Category | Interaction Types | Drug Claim Name | Drug Name | PMIDs |
| Page: 1 |

Copyright 2023-Present -The University of Texas Health Science Center at Houston |