
|
|||||
|
 | |
| |
| |
| |
| |
| |
|
Gene: S100A2 |
Gene summary for S100A2 |
| Gene information | Species | Human | Gene symbol | S100A2 | Gene ID | 6273 |
| Gene name | S100 calcium binding protein A2 | |
| Gene Alias | CAN19 | |
| Cytomap | 1q21.3 | |
| Gene Type | protein-coding | GO ID | GO:0001667 | UniProtAcc | P29034 |
Top |
Malignant transformation analysis |
| Identification of the aberrant gene expression in precancerous and cancerous lesions by comparing the gene expression of stem-like cells in diseased tissues with normal stem cells |
| Entrez ID | Symbol | Replicates | Species | Organ | Tissue | Adj P-value | Log2FC | Malignancy |
| 6273 | S100A2 | GSM4909282 | Human | Breast | IDC | 1.21e-05 | 3.27e-01 | -0.0288 |
| 6273 | S100A2 | GSM4909285 | Human | Breast | IDC | 2.03e-04 | 4.45e-01 | 0.21 |
| 6273 | S100A2 | GSM4909286 | Human | Breast | IDC | 5.90e-05 | -1.83e-01 | 0.1081 |
| 6273 | S100A2 | GSM4909293 | Human | Breast | IDC | 1.84e-05 | -1.81e-01 | 0.1581 |
| 6273 | S100A2 | GSM4909294 | Human | Breast | IDC | 3.03e-06 | -1.73e-01 | 0.2022 |
| 6273 | S100A2 | GSM4909295 | Human | Breast | IDC | 3.32e-11 | 6.54e-01 | 0.0898 |
| 6273 | S100A2 | GSM4909296 | Human | Breast | IDC | 2.35e-07 | -1.86e-01 | 0.1524 |
| 6273 | S100A2 | GSM4909297 | Human | Breast | IDC | 1.68e-06 | -1.71e-01 | 0.1517 |
| 6273 | S100A2 | GSM4909298 | Human | Breast | IDC | 4.02e-03 | -1.70e-01 | 0.1551 |
| 6273 | S100A2 | GSM4909301 | Human | Breast | IDC | 1.11e-07 | -1.83e-01 | 0.1577 |
| 6273 | S100A2 | GSM4909302 | Human | Breast | IDC | 4.14e-03 | -1.91e-01 | 0.1545 |
| 6273 | S100A2 | GSM4909304 | Human | Breast | IDC | 3.70e-04 | -1.83e-01 | 0.1636 |
| 6273 | S100A2 | GSM4909306 | Human | Breast | IDC | 2.53e-02 | -1.52e-01 | 0.1564 |
| 6273 | S100A2 | GSM4909311 | Human | Breast | IDC | 1.67e-08 | -1.58e-02 | 0.1534 |
| 6273 | S100A2 | GSM4909312 | Human | Breast | IDC | 8.23e-09 | -1.97e-01 | 0.1552 |
| 6273 | S100A2 | GSM4909315 | Human | Breast | IDC | 8.30e-08 | -1.97e-01 | 0.21 |
| 6273 | S100A2 | GSM4909319 | Human | Breast | IDC | 5.05e-09 | -1.85e-01 | 0.1563 |
| 6273 | S100A2 | GSM4909321 | Human | Breast | IDC | 1.78e-08 | -1.97e-01 | 0.1559 |
| 6273 | S100A2 | brca1 | Human | Breast | Precancer | 1.04e-02 | 2.36e-01 | -0.0338 |
| 6273 | S100A2 | brca2 | Human | Breast | Precancer | 3.26e-44 | 7.80e-01 | -0.024 |
| Page: 1 2 3 4 5 6 7 8 9 10 11 |
| Tissue | Expression Dynamics | Abbreviation |
| Breast | 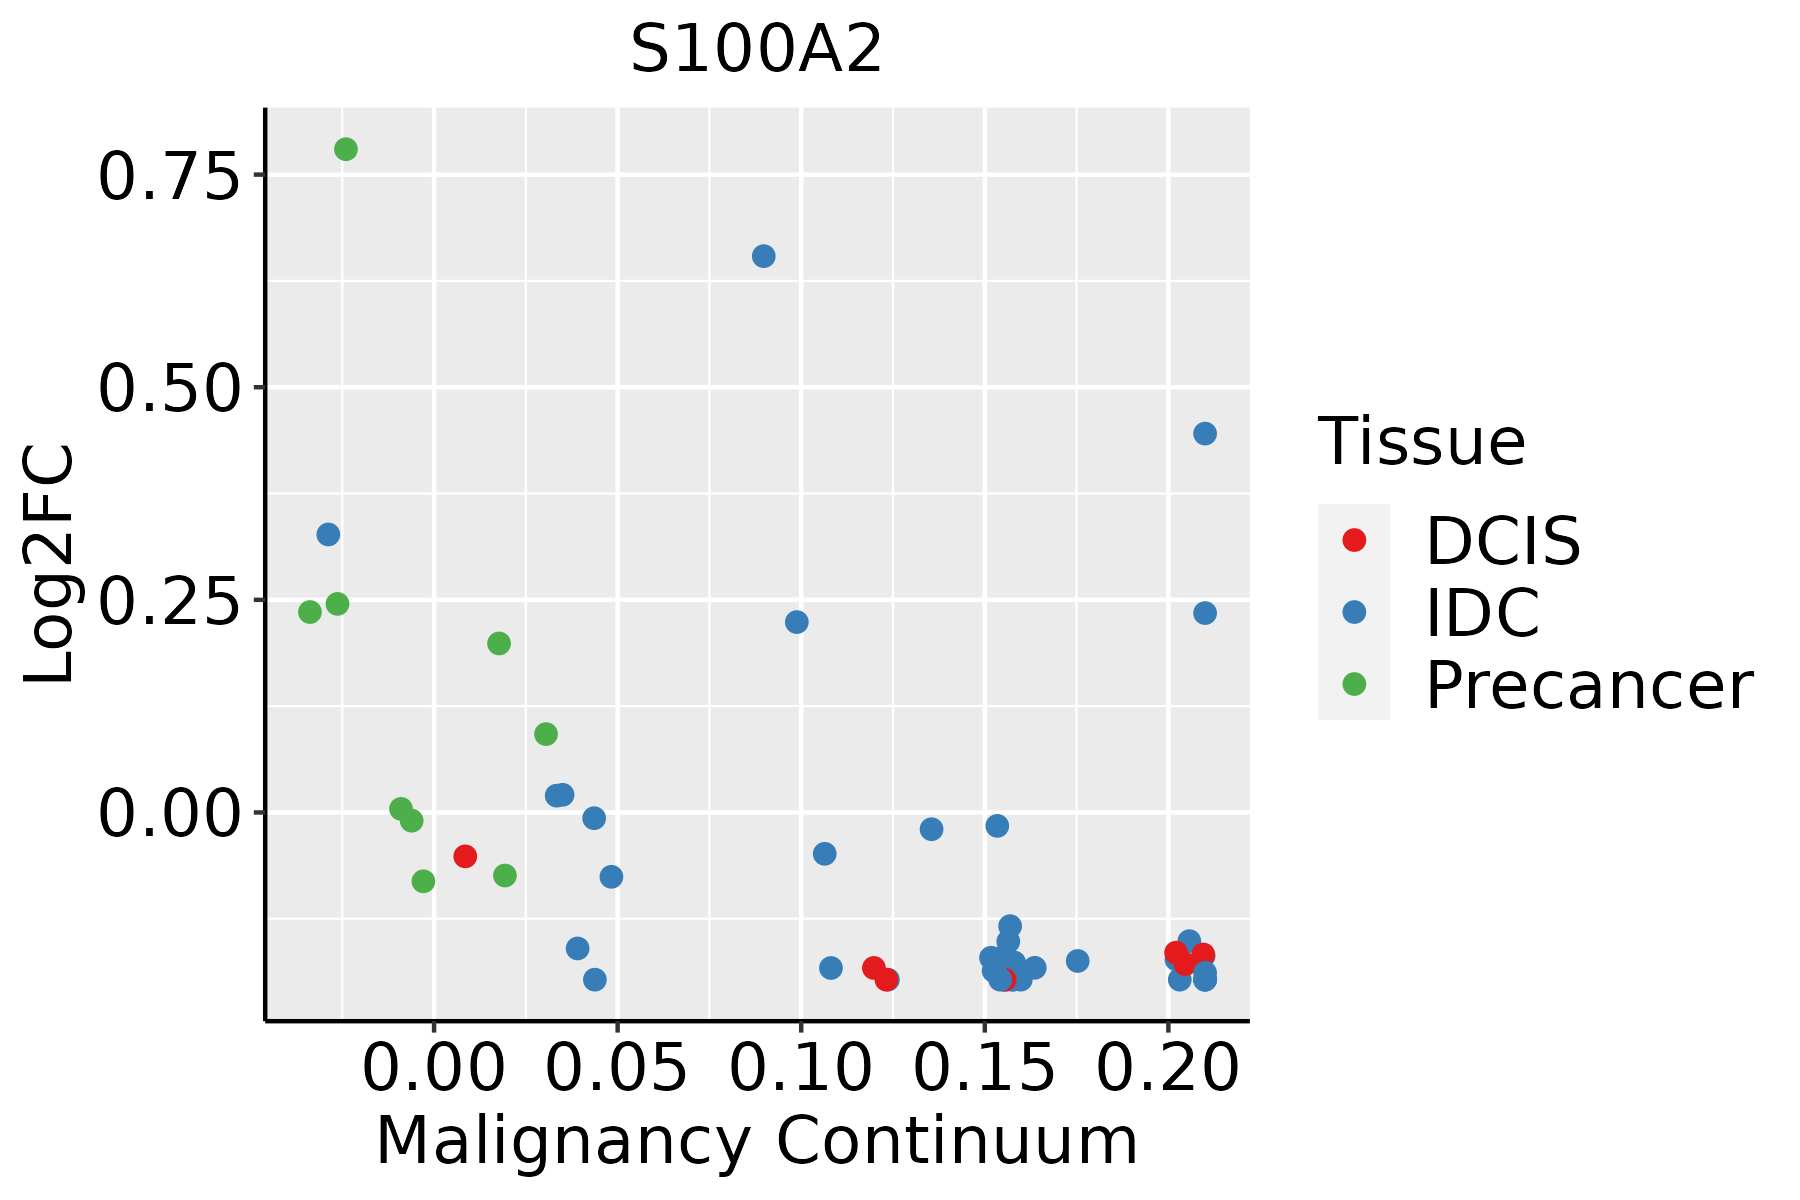 | IDC: Invasive ductal carcinoma |
| DCIS: Ductal carcinoma in situ | ||
| Precancer(BRCA1-mut): Precancerous lesion from BRCA1 mutation carriers | ||
| Cervix | 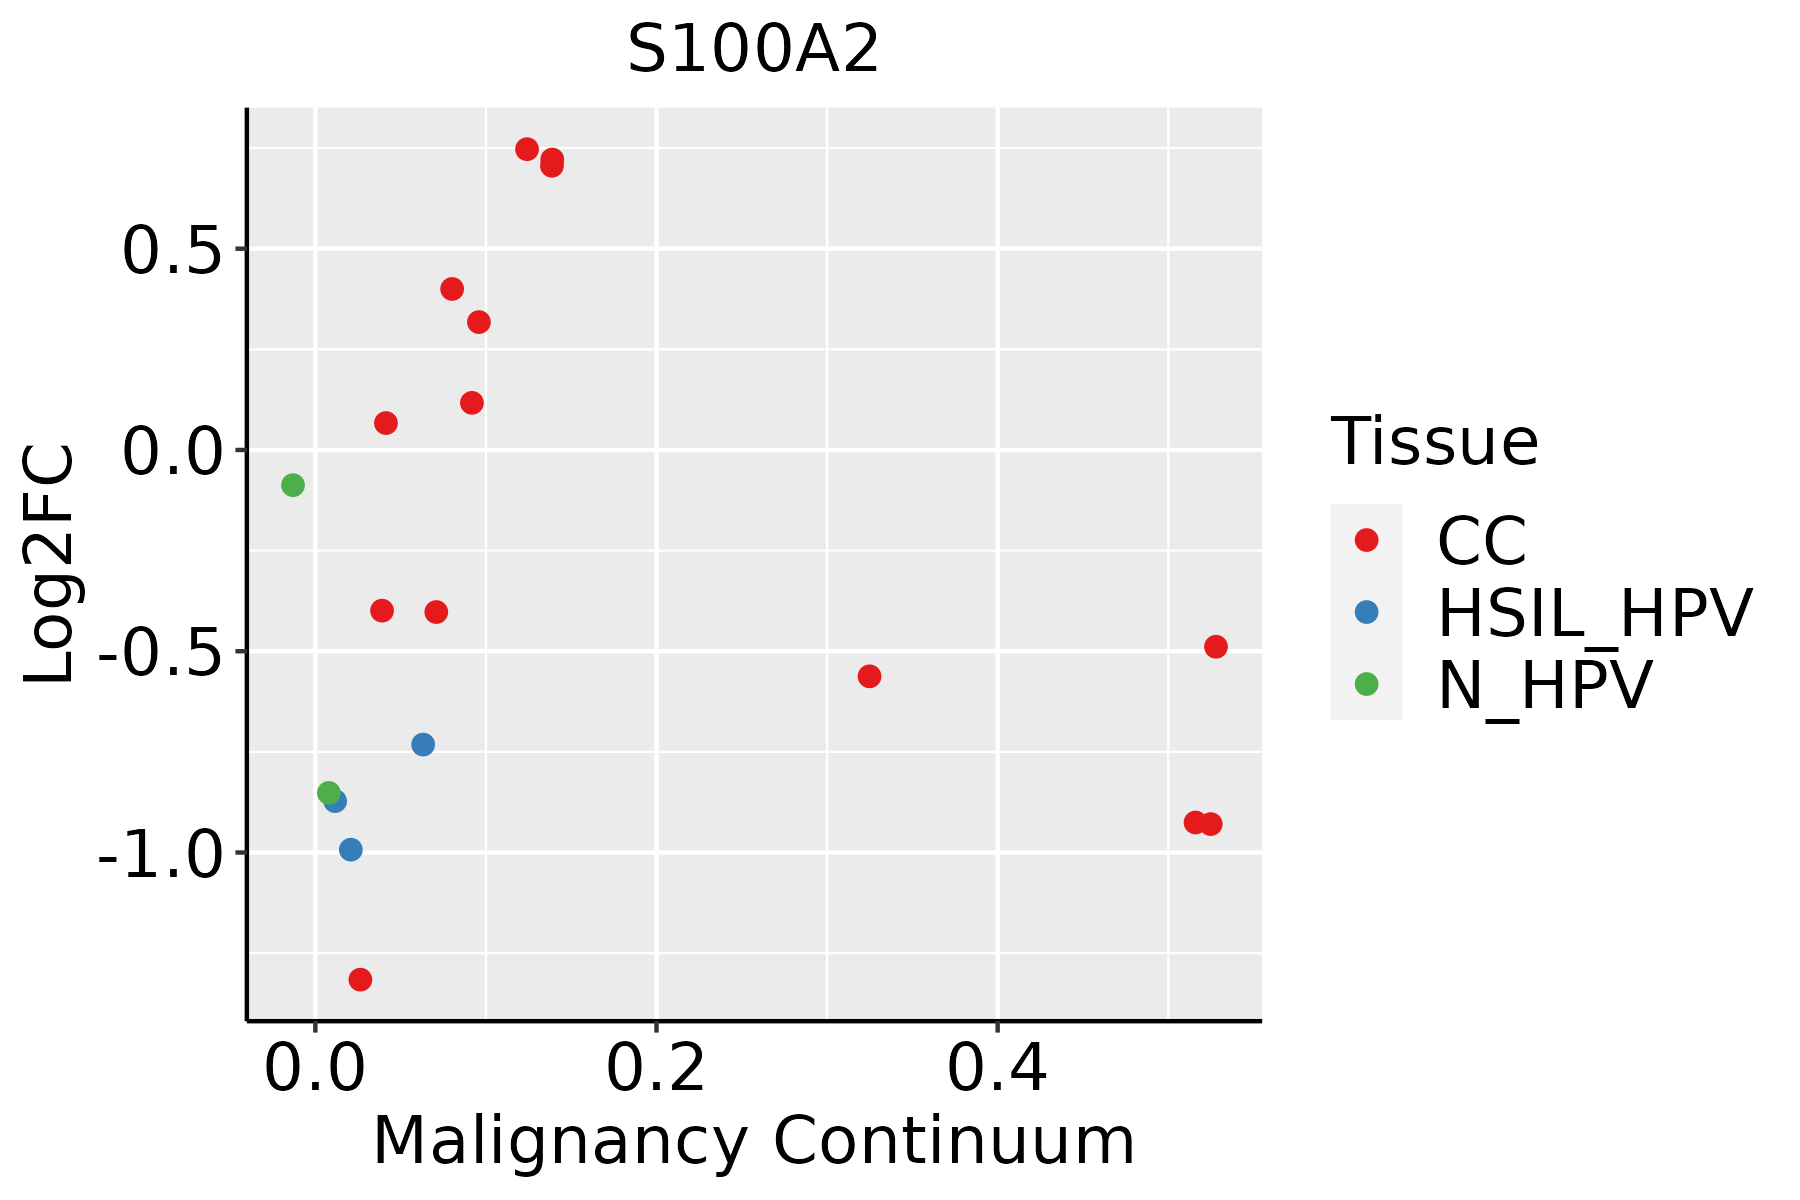 | CC: Cervix cancer |
| HSIL_HPV: HPV-infected high-grade squamous intraepithelial lesions | ||
| N_HPV: HPV-infected normal cervix | ||
| Esophagus | 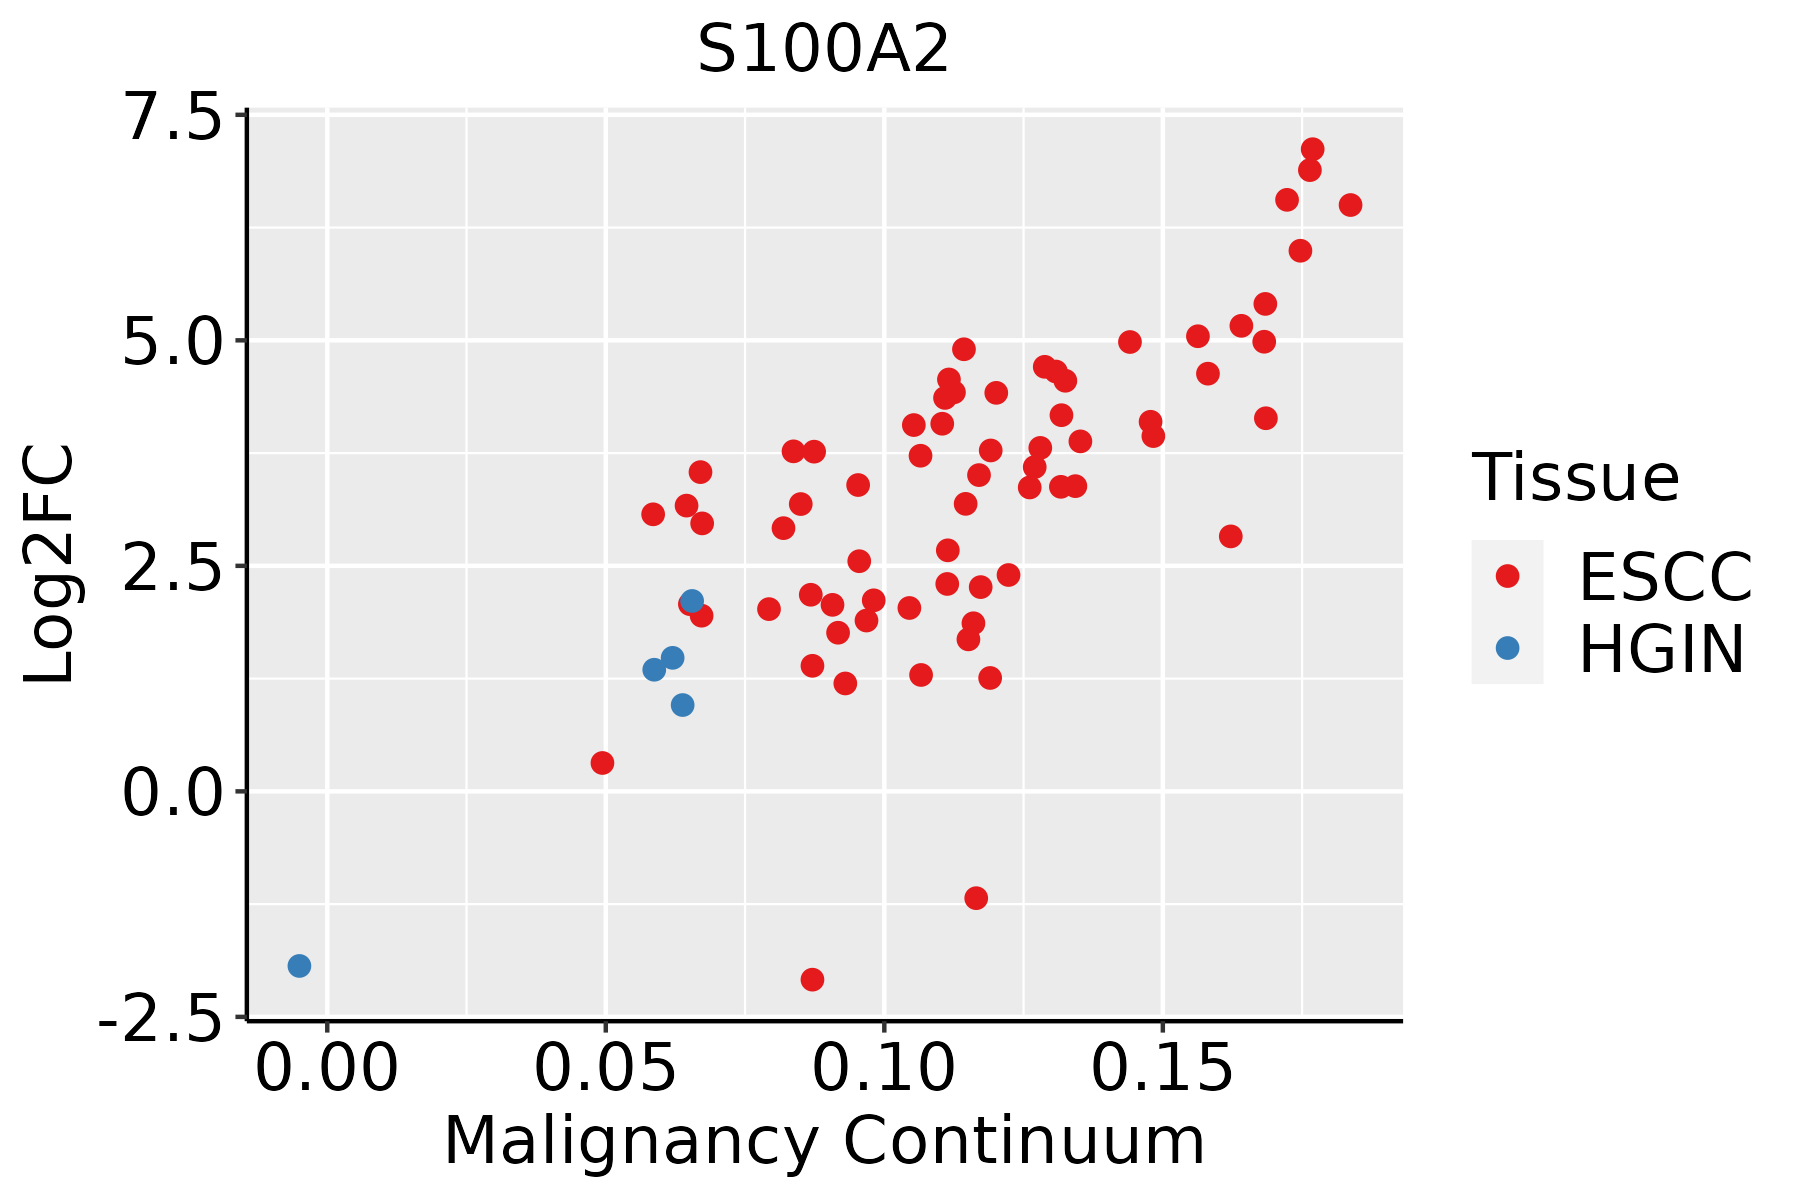 | ESCC: Esophageal squamous cell carcinoma |
| HGIN: High-grade intraepithelial neoplasias | ||
| LGIN: Low-grade intraepithelial neoplasias | ||
| Liver | 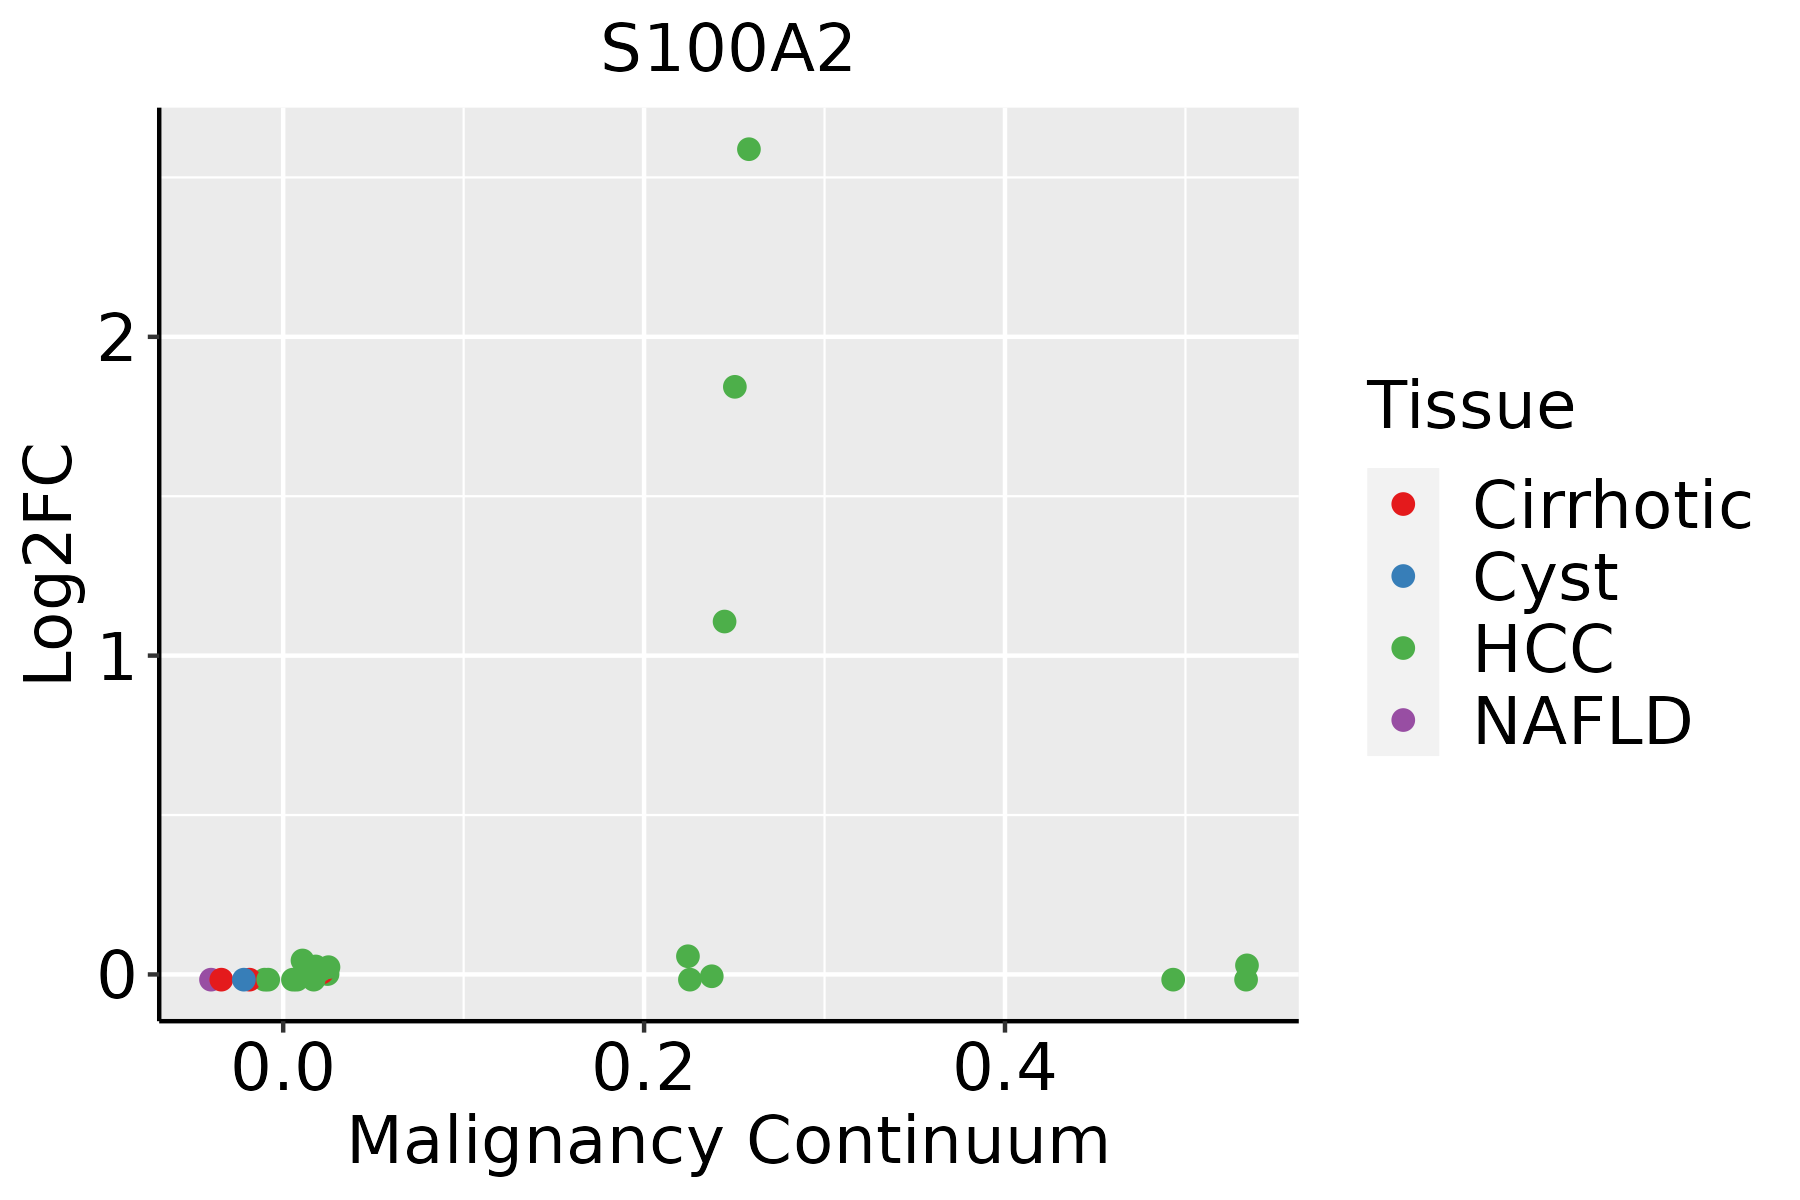 | HCC: Hepatocellular carcinoma |
| NAFLD: Non-alcoholic fatty liver disease | ||
| Oral Cavity | 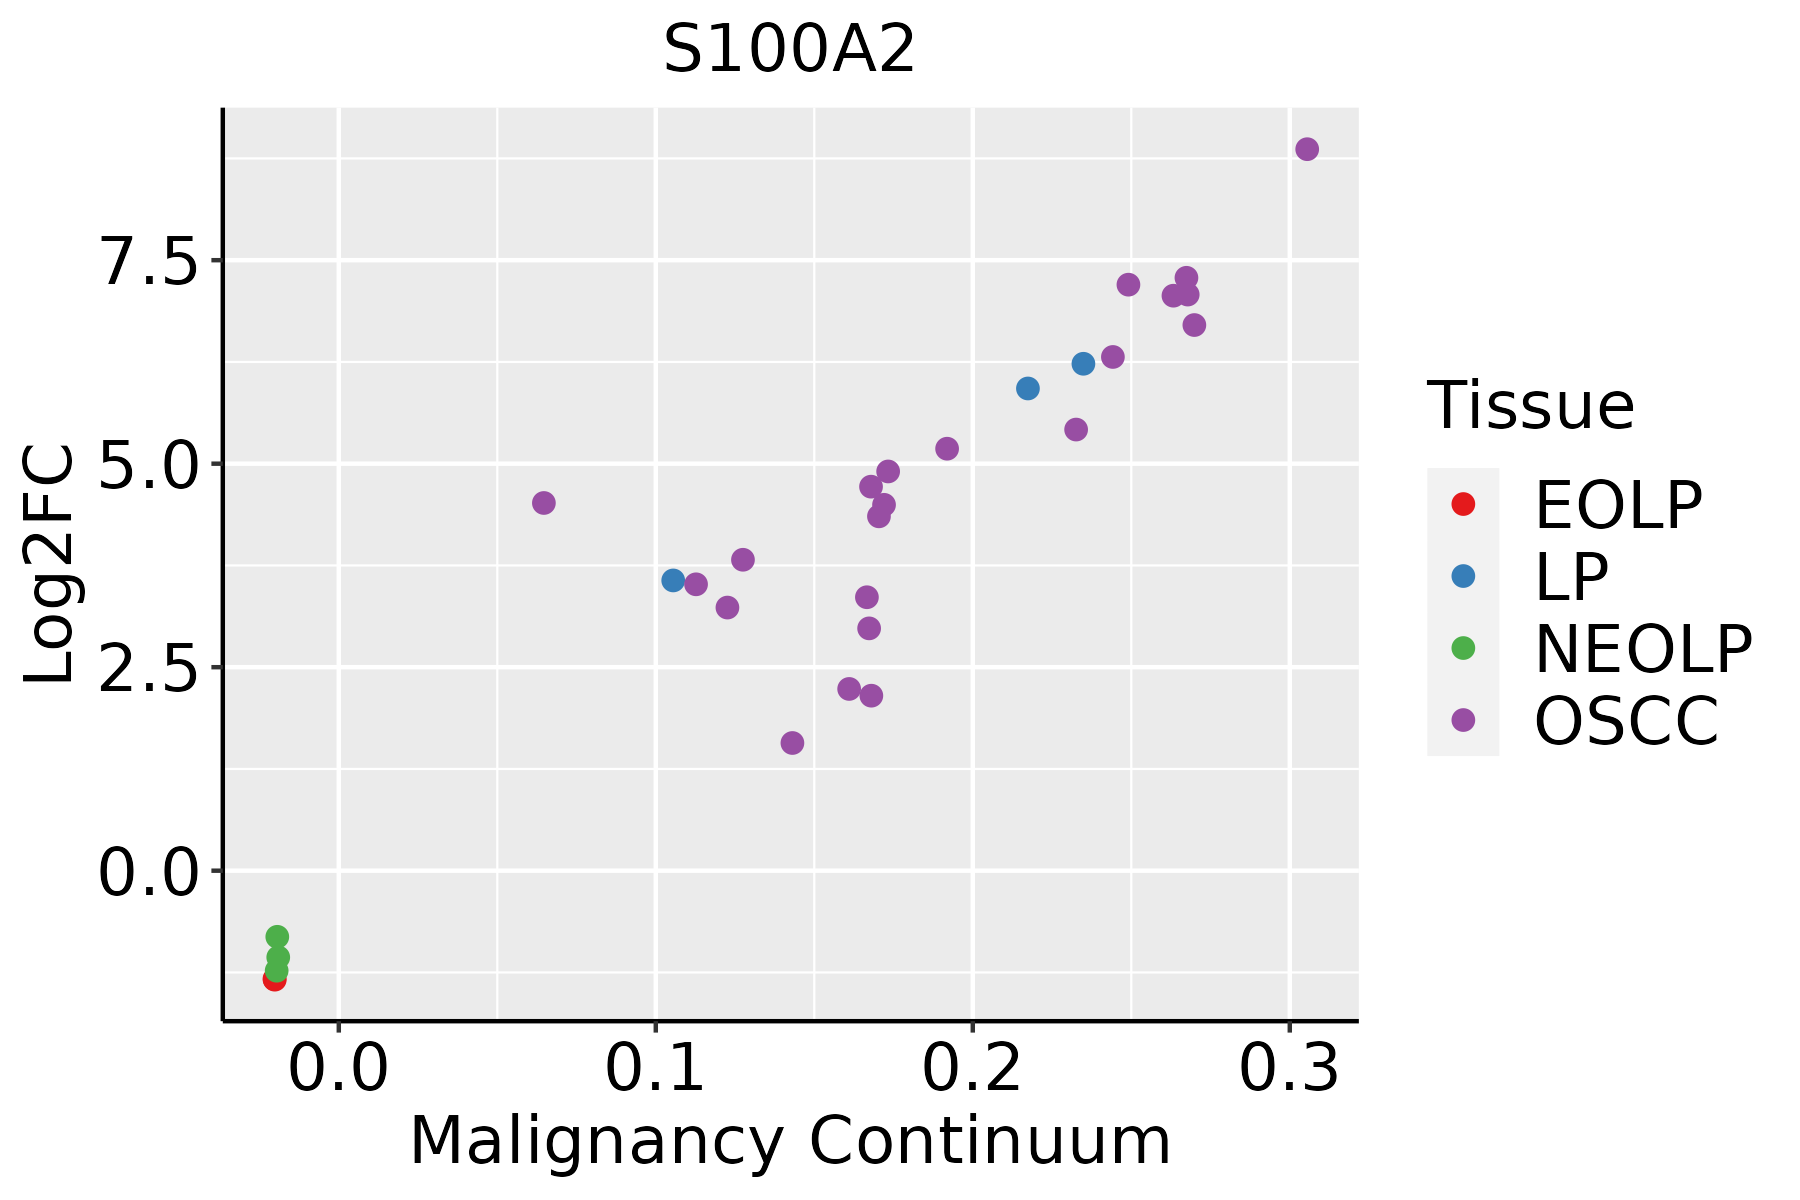 | EOLP: Erosive Oral lichen planus |
| LP: leukoplakia | ||
| NEOLP: Non-erosive oral lichen planus | ||
| OSCC: Oral squamous cell carcinoma | ||
| Prostate | 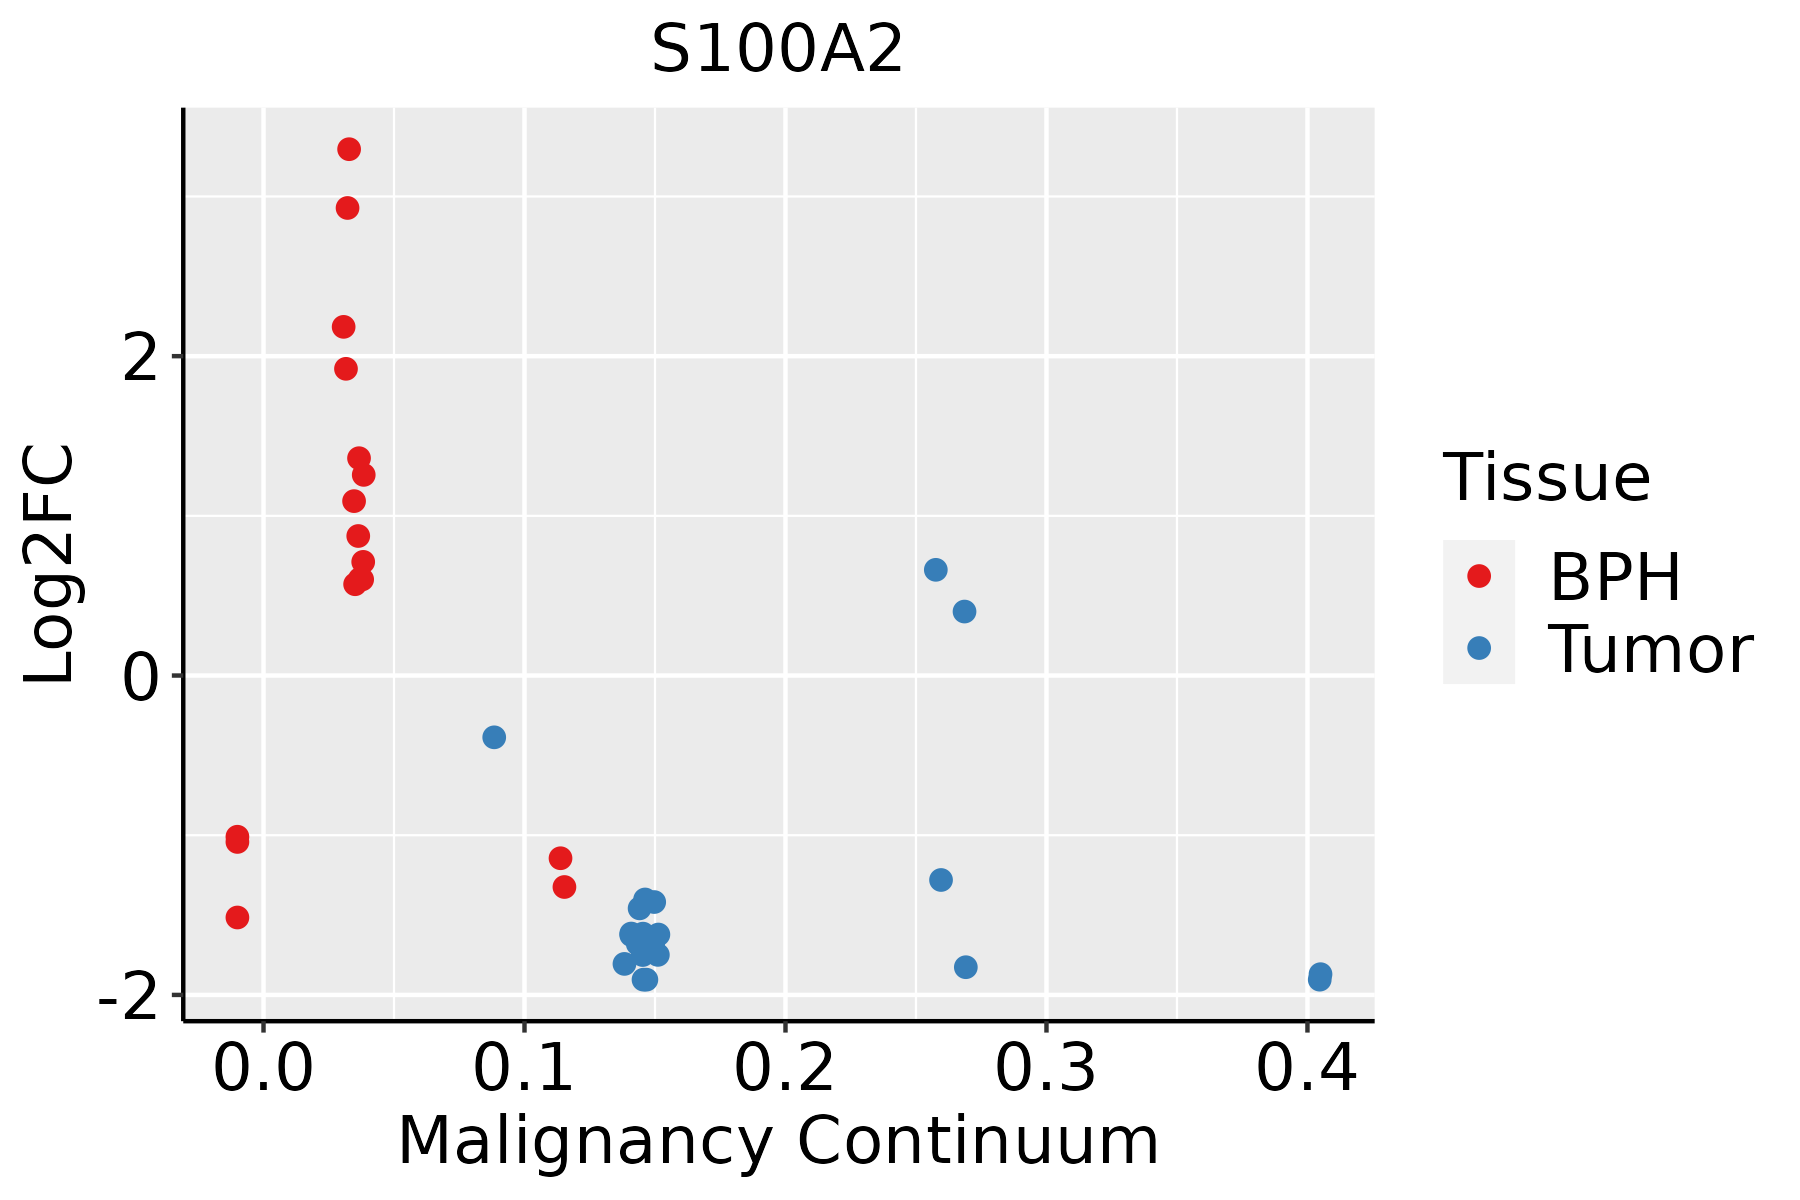 | BPH: Benign Prostatic Hyperplasia |
| Skin | 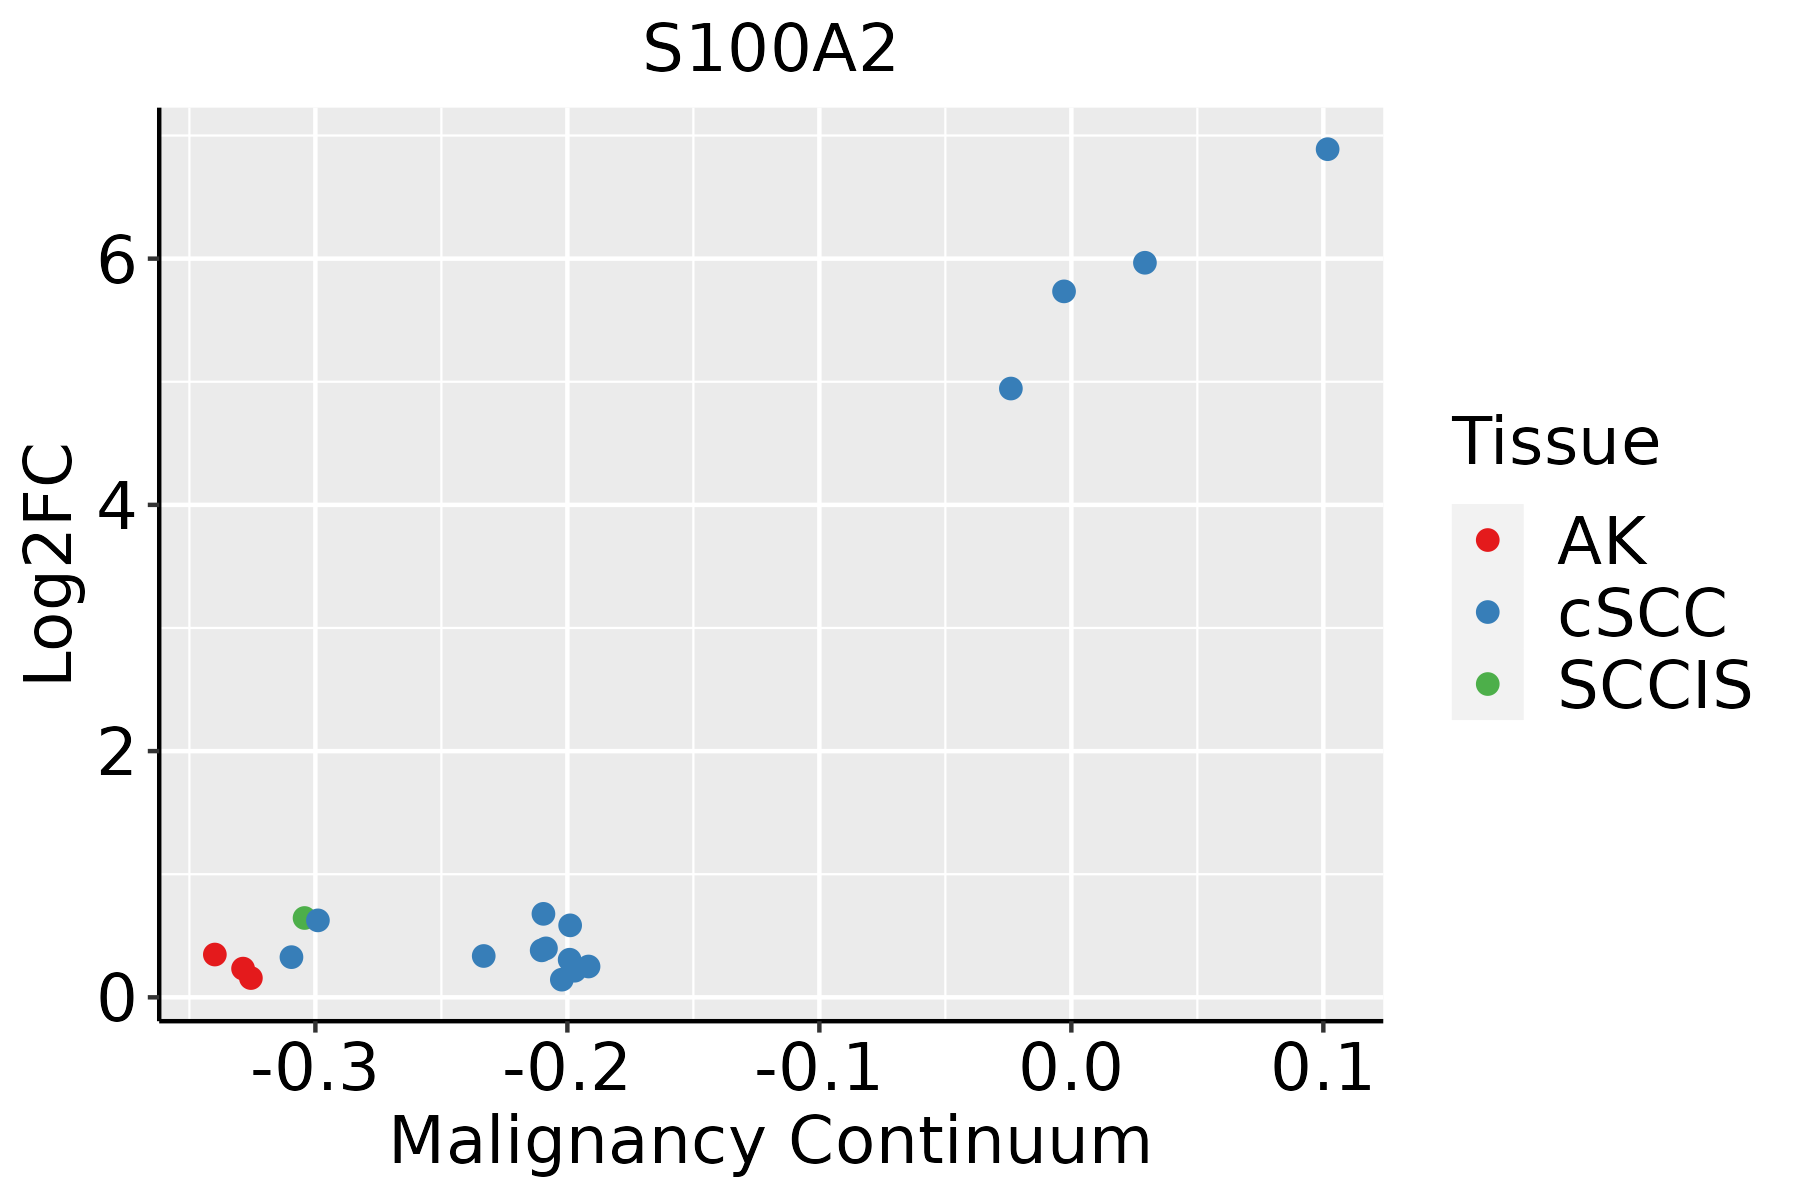 | AK: Actinic keratosis |
| cSCC: Cutaneous squamous cell carcinoma | ||
| SCCIS:squamous cell carcinoma in situ | ||
| Thyroid |  | ATC: Anaplastic thyroid cancer |
| HT: Hashimoto's thyroiditis | ||
| PTC: Papillary thyroid cancer |
| ∗log2FC in expression of this searched gene in stem-like cells from each diseased tissue sample relative to stem-like cells in normal samples in each tissue plotted against the malignancy continuum. Samples are colored based on if they are from different disease stage. |
Top |
Malignant transformation related pathway analysis |
| Find out the enriched GO biological processes and KEGG pathways involved in transition from healthy to precancer to cancer |
| Tissue | Disease Stage | Enriched GO biological Processes |
| Colorectum | AD |  |
| Colorectum | SER |  |
| Colorectum | MSS |  |
| Colorectum | MSI-H |  |
| Colorectum | FAP |  |
| ∗Top 15 enriched GO BP terms are showed in the bar plot of each disease state in each tissue. Each row represents a significant GO biological process which is colored according to the -log10(p.adjust). |
| Page: 1 2 3 4 5 6 7 8 9 |
| GO ID | Tissue | Disease Stage | Description | Gene Ratio | Bg Ratio | pvalue | p.adjust | Count |
| GO:00106319 | Breast | Precancer | epithelial cell migration | 40/1080 | 357/18723 | 4.57e-05 | 9.71e-04 | 40 |
| GO:00901329 | Breast | Precancer | epithelium migration | 40/1080 | 360/18723 | 5.51e-05 | 1.14e-03 | 40 |
| GO:00435426 | Breast | Precancer | endothelial cell migration | 33/1080 | 279/18723 | 7.28e-05 | 1.44e-03 | 33 |
| GO:00901309 | Breast | Precancer | tissue migration | 40/1080 | 365/18723 | 7.48e-05 | 1.47e-03 | 40 |
| GO:00016678 | Breast | Precancer | ameboidal-type cell migration | 47/1080 | 475/18723 | 2.19e-04 | 3.35e-03 | 47 |
| GO:000166714 | Breast | IDC | ameboidal-type cell migration | 64/1434 | 475/18723 | 6.65e-06 | 2.05e-04 | 64 |
| GO:001063112 | Breast | IDC | epithelial cell migration | 51/1434 | 357/18723 | 1.14e-05 | 3.08e-04 | 51 |
| GO:009013212 | Breast | IDC | epithelium migration | 51/1434 | 360/18723 | 1.44e-05 | 3.70e-04 | 51 |
| GO:009013012 | Breast | IDC | tissue migration | 51/1434 | 365/18723 | 2.11e-05 | 5.11e-04 | 51 |
| GO:004354211 | Breast | IDC | endothelial cell migration | 40/1434 | 279/18723 | 8.97e-05 | 1.74e-03 | 40 |
| GO:001063121 | Breast | DCIS | epithelial cell migration | 51/1390 | 357/18723 | 4.83e-06 | 1.43e-04 | 51 |
| GO:009013221 | Breast | DCIS | epithelium migration | 51/1390 | 360/18723 | 6.14e-06 | 1.75e-04 | 51 |
| GO:009013021 | Breast | DCIS | tissue migration | 51/1390 | 365/18723 | 9.09e-06 | 2.45e-04 | 51 |
| GO:000166723 | Breast | DCIS | ameboidal-type cell migration | 62/1390 | 475/18723 | 9.60e-06 | 2.56e-04 | 62 |
| GO:004354221 | Breast | DCIS | endothelial cell migration | 40/1390 | 279/18723 | 4.54e-05 | 9.49e-04 | 40 |
| GO:009013210 | Cervix | CC | epithelium migration | 90/2311 | 360/18723 | 2.45e-11 | 6.11e-09 | 90 |
| GO:00016679 | Cervix | CC | ameboidal-type cell migration | 110/2311 | 475/18723 | 2.66e-11 | 6.36e-09 | 110 |
| GO:001063110 | Cervix | CC | epithelial cell migration | 89/2311 | 357/18723 | 3.72e-11 | 8.54e-09 | 89 |
| GO:009013010 | Cervix | CC | tissue migration | 90/2311 | 365/18723 | 5.42e-11 | 1.05e-08 | 90 |
| GO:00435427 | Cervix | CC | endothelial cell migration | 60/2311 | 279/18723 | 1.05e-05 | 2.33e-04 | 60 |
| Page: 1 2 3 4 5 |
| Pathway ID | Tissue | Disease Stage | Description | Gene Ratio | Bg Ratio | pvalue | p.adjust | qvalue | Count |
| Page: 1 |
Top |
Cell-cell communication analysis |
| Identification of potential cell-cell interactions between two cell types and their ligand-receptor pairs for different disease states |
| Ligand | Receptor | LRpair | Pathway | Tissue | Disease Stage |
| Page: 1 |
Top |
Single-cell gene regulatory network inference analysis |
| Find out the significant the regulons (TFs) and the target genes of each regulon across cell types for different disease states |
| TF | Cell Type | Tissue | Disease Stage | Target Gene | RSS | Regulon Activity |
| ∗The dot plots of a searched regulon are shown for all cell subpopulations in each disease state of each tissue based on the regulon specific score inferred using pySCENIC and by calculating the average expression. |
| Page: 1 |
Top |
Somatic mutation of malignant transformation related genes |
| Annotation of somatic variants for genes involved in malignant transformation |
| Hugo Symbol | Variant Class | Variant Classification | dbSNP RS | HGVSc | HGVSp | HGVSp Short | SWISSPROT | BIOTYPE | SIFT | PolyPhen | Tumor Sample Barcode | Tissue | Histology | Sex | Age | Stage | Therapy Types | Drugs | Outcome |
| S100A2 | SNV | Missense_Mutation | c.41N>T | p.Thr14Ile | p.T14I | P29034 | protein_coding | tolerated(0.15) | benign(0.031) | TCGA-BH-A0HF-01 | Breast | breast invasive carcinoma | Female | >=65 | I/II | Hormone Therapy | arimidex | SD | |
| S100A2 | SNV | Missense_Mutation | c.76N>C | p.Lys26Gln | p.K26Q | P29034 | protein_coding | deleterious(0) | probably_damaging(0.913) | TCGA-AA-3966-01 | Colorectum | colon adenocarcinoma | Female | >=65 | I/II | Unknown | Unknown | SD | |
| S100A2 | SNV | Missense_Mutation | c.211N>A | p.Asp71Asn | p.D71N | P29034 | protein_coding | tolerated(0.11) | probably_damaging(0.997) | TCGA-AA-A010-01 | Colorectum | colon adenocarcinoma | Female | <65 | I/II | Chemotherapy | folinic | CR | |
| S100A2 | SNV | Missense_Mutation | novel | c.230N>A | p.Val77Asp | p.V77D | P29034 | protein_coding | tolerated(0.22) | possibly_damaging(0.642) | TCGA-AA-A029-01 | Colorectum | colon adenocarcinoma | Male | >=65 | I/II | Unknown | Unknown | SD |
| S100A2 | SNV | Missense_Mutation | c.189T>G | p.Asp63Glu | p.D63E | P29034 | protein_coding | deleterious(0) | probably_damaging(0.994) | TCGA-CK-5915-01 | Colorectum | colon adenocarcinoma | Male | <65 | I/II | Unknown | Unknown | SD | |
| S100A2 | SNV | Missense_Mutation | rs758899452 | c.73G>A | p.Asp25Asn | p.D25N | P29034 | protein_coding | tolerated(0.06) | probably_damaging(0.994) | TCGA-A5-A0GB-01 | Endometrium | uterine corpus endometrioid carcinoma | Female | >=65 | I/II | Unknown | Unknown | SD |
| S100A2 | SNV | Missense_Mutation | rs575985349 | c.23N>T | p.Ala8Val | p.A8V | P29034 | protein_coding | deleterious(0.02) | probably_damaging(0.951) | TCGA-AJ-A3OK-01 | Endometrium | uterine corpus endometrioid carcinoma | Female | >=65 | I/II | Chemotherapy | carboplatin | CR |
| S100A2 | SNV | Missense_Mutation | c.89G>T | p.Ser30Ile | p.S30I | P29034 | protein_coding | deleterious(0.01) | probably_damaging(0.913) | TCGA-AP-A051-01 | Endometrium | uterine corpus endometrioid carcinoma | Female | >=65 | I/II | Unknown | Unknown | SD | |
| S100A2 | SNV | Missense_Mutation | novel | c.190N>A | p.Glu64Lys | p.E64K | P29034 | protein_coding | tolerated(0.88) | benign(0.007) | TCGA-34-8454-01 | Lung | lung squamous cell carcinoma | Female | <65 | III/IV | Chemotherapy | cisplatin | SD |
| S100A2 | SNV | Missense_Mutation | novel | c.287N>A | p.Arg96Gln | p.R96Q | P29034 | protein_coding | tolerated(0.09) | benign(0.058) | TCGA-56-A5DR-01 | Lung | lung squamous cell carcinoma | Male | >=65 | I/II | Unknown | Unknown | SD |
| Page: 1 2 |
Top |
Related drugs of malignant transformation related genes |
| Identification of chemicals and drugs interact with genes involved in malignant transfromation |
| (DGIdb 4.0) |
| Entrez ID | Symbol | Category | Interaction Types | Drug Claim Name | Drug Name | PMIDs |
| 6273 | S100A2 | NA | ANTISENSE OLIGONUCLEOTIDES | 11304580 | ||
| 6273 | S100A2 | NA | ANTISERUM | 9463588 |
| Page: 1 |

Copyright 2023-Present -The University of Texas Health Science Center at Houston |