
|
|||||
|
 | |
| |
| |
| |
| |
| |
|
Gene: S100A16 |
Gene summary for S100A16 |
| Gene information | Species | Human | Gene symbol | S100A16 | Gene ID | 140576 |
| Gene name | S100 calcium binding protein A16 | |
| Gene Alias | AAG13 | |
| Cytomap | 1q21.3 | |
| Gene Type | protein-coding | GO ID | GO:0008150 | UniProtAcc | Q96FQ6 |
Top |
Malignant transformation analysis |
| Identification of the aberrant gene expression in precancerous and cancerous lesions by comparing the gene expression of stem-like cells in diseased tissues with normal stem cells |
| Entrez ID | Symbol | Replicates | Species | Organ | Tissue | Adj P-value | Log2FC | Malignancy |
| 140576 | S100A16 | GSM4909282 | Human | Breast | IDC | 4.84e-12 | 4.71e-01 | -0.0288 |
| 140576 | S100A16 | GSM4909286 | Human | Breast | IDC | 3.34e-15 | -4.61e-01 | 0.1081 |
| 140576 | S100A16 | GSM4909288 | Human | Breast | IDC | 4.38e-09 | -2.71e-01 | 0.0988 |
| 140576 | S100A16 | GSM4909290 | Human | Breast | IDC | 1.57e-03 | 3.08e-01 | 0.2096 |
| 140576 | S100A16 | GSM4909294 | Human | Breast | IDC | 2.75e-11 | 1.52e-01 | 0.2022 |
| 140576 | S100A16 | GSM4909296 | Human | Breast | IDC | 1.98e-10 | 1.24e-01 | 0.1524 |
| 140576 | S100A16 | GSM4909297 | Human | Breast | IDC | 2.09e-18 | -1.08e-01 | 0.1517 |
| 140576 | S100A16 | GSM4909299 | Human | Breast | IDC | 1.27e-04 | -3.18e-01 | 0.035 |
| 140576 | S100A16 | GSM4909301 | Human | Breast | IDC | 9.95e-62 | -9.02e-01 | 0.1577 |
| 140576 | S100A16 | GSM4909302 | Human | Breast | IDC | 4.56e-05 | 1.96e-01 | 0.1545 |
| 140576 | S100A16 | GSM4909304 | Human | Breast | IDC | 2.00e-02 | 2.60e-01 | 0.1636 |
| 140576 | S100A16 | GSM4909306 | Human | Breast | IDC | 1.30e-04 | 3.62e-01 | 0.1564 |
| 140576 | S100A16 | GSM4909309 | Human | Breast | IDC | 2.30e-03 | -3.37e-01 | 0.0483 |
| 140576 | S100A16 | GSM4909311 | Human | Breast | IDC | 1.45e-47 | -5.10e-01 | 0.1534 |
| 140576 | S100A16 | GSM4909312 | Human | Breast | IDC | 1.41e-13 | -2.70e-01 | 0.1552 |
| 140576 | S100A16 | GSM4909313 | Human | Breast | IDC | 4.75e-02 | -3.66e-03 | 0.0391 |
| 140576 | S100A16 | GSM4909315 | Human | Breast | IDC | 8.62e-41 | -7.43e-01 | 0.21 |
| 140576 | S100A16 | GSM4909316 | Human | Breast | IDC | 9.79e-18 | -8.96e-01 | 0.21 |
| 140576 | S100A16 | GSM4909317 | Human | Breast | IDC | 6.55e-08 | 3.61e-01 | 0.1355 |
| 140576 | S100A16 | GSM4909318 | Human | Breast | IDC | 2.05e-18 | 6.40e-01 | 0.2031 |
| Page: 1 2 3 4 5 6 7 8 9 10 11 12 13 14 15 16 |
| Tissue | Expression Dynamics | Abbreviation |
| Breast | 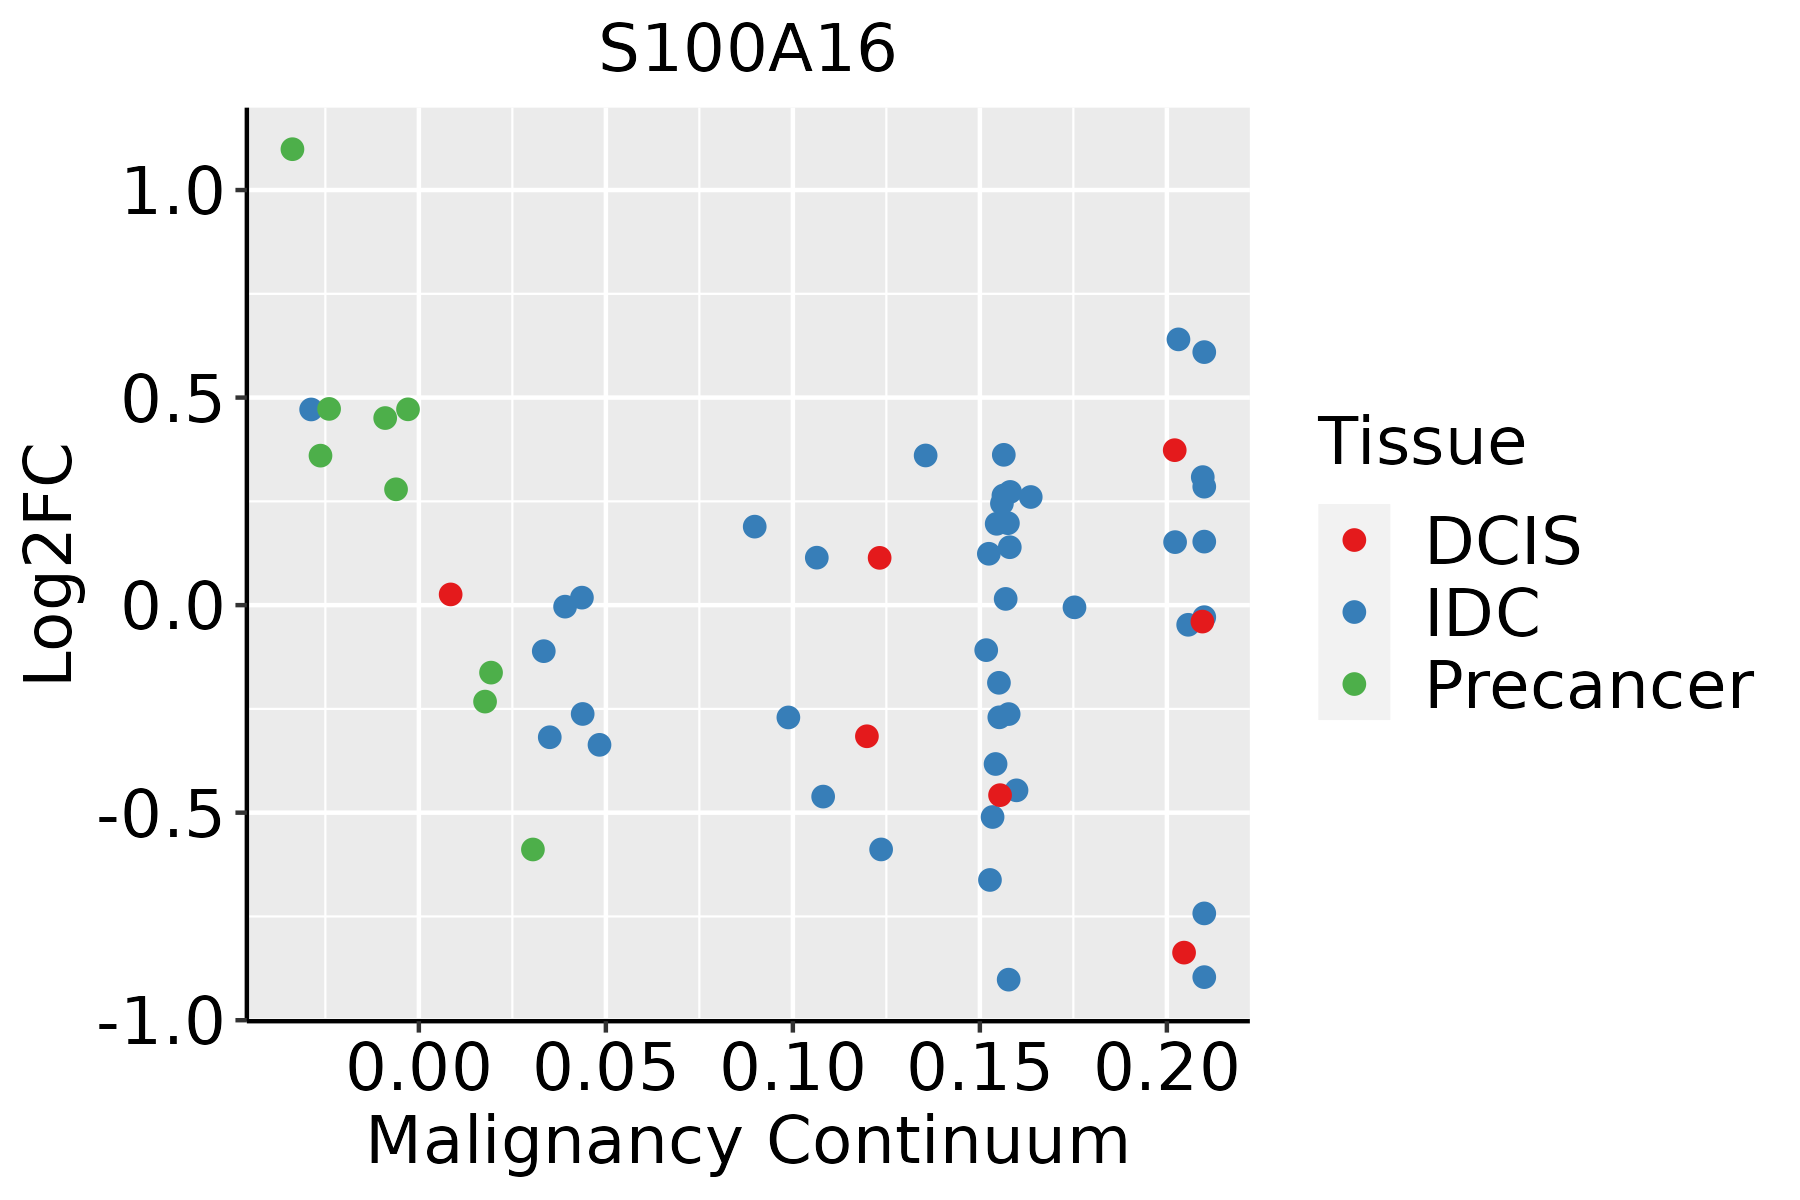 | IDC: Invasive ductal carcinoma |
| DCIS: Ductal carcinoma in situ | ||
| Precancer(BRCA1-mut): Precancerous lesion from BRCA1 mutation carriers | ||
| Cervix | 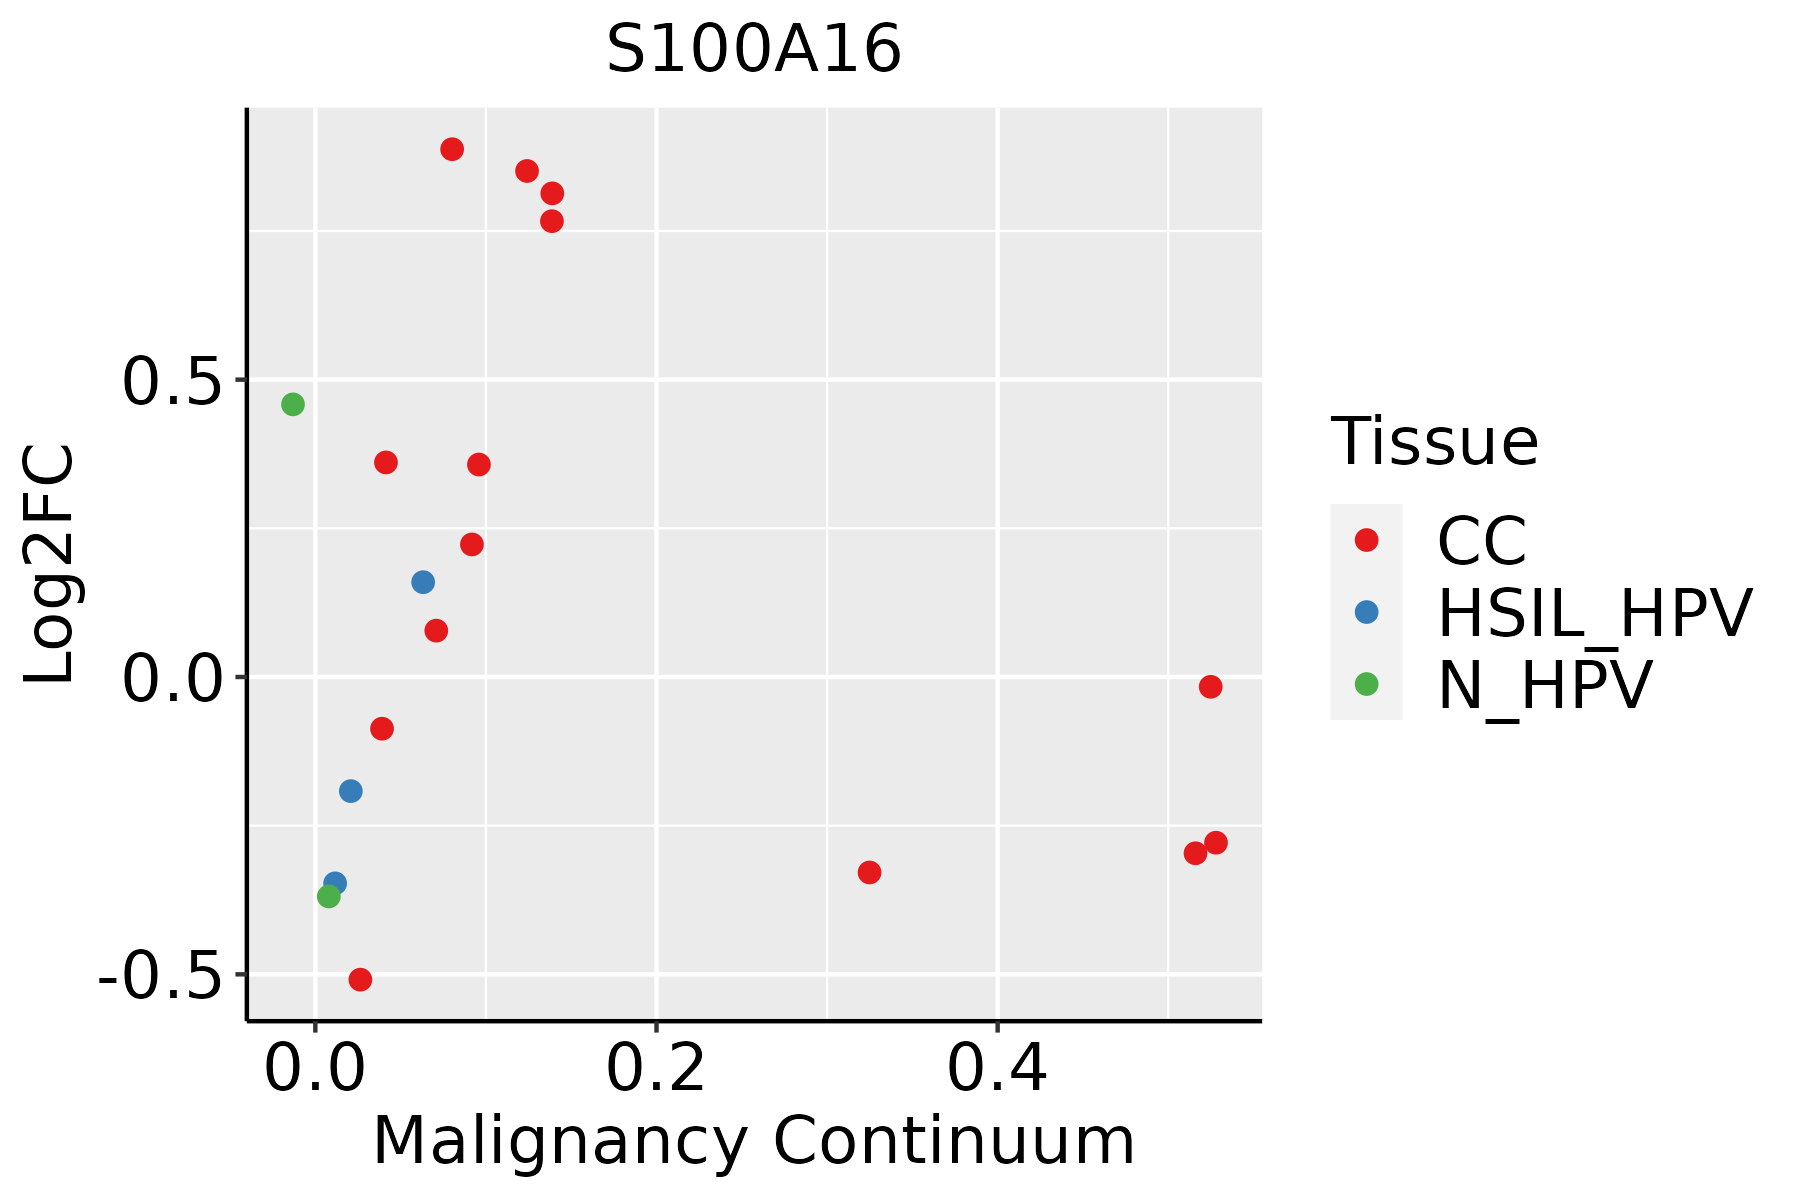 | CC: Cervix cancer |
| HSIL_HPV: HPV-infected high-grade squamous intraepithelial lesions | ||
| N_HPV: HPV-infected normal cervix | ||
| Colorectum (GSE201348) | 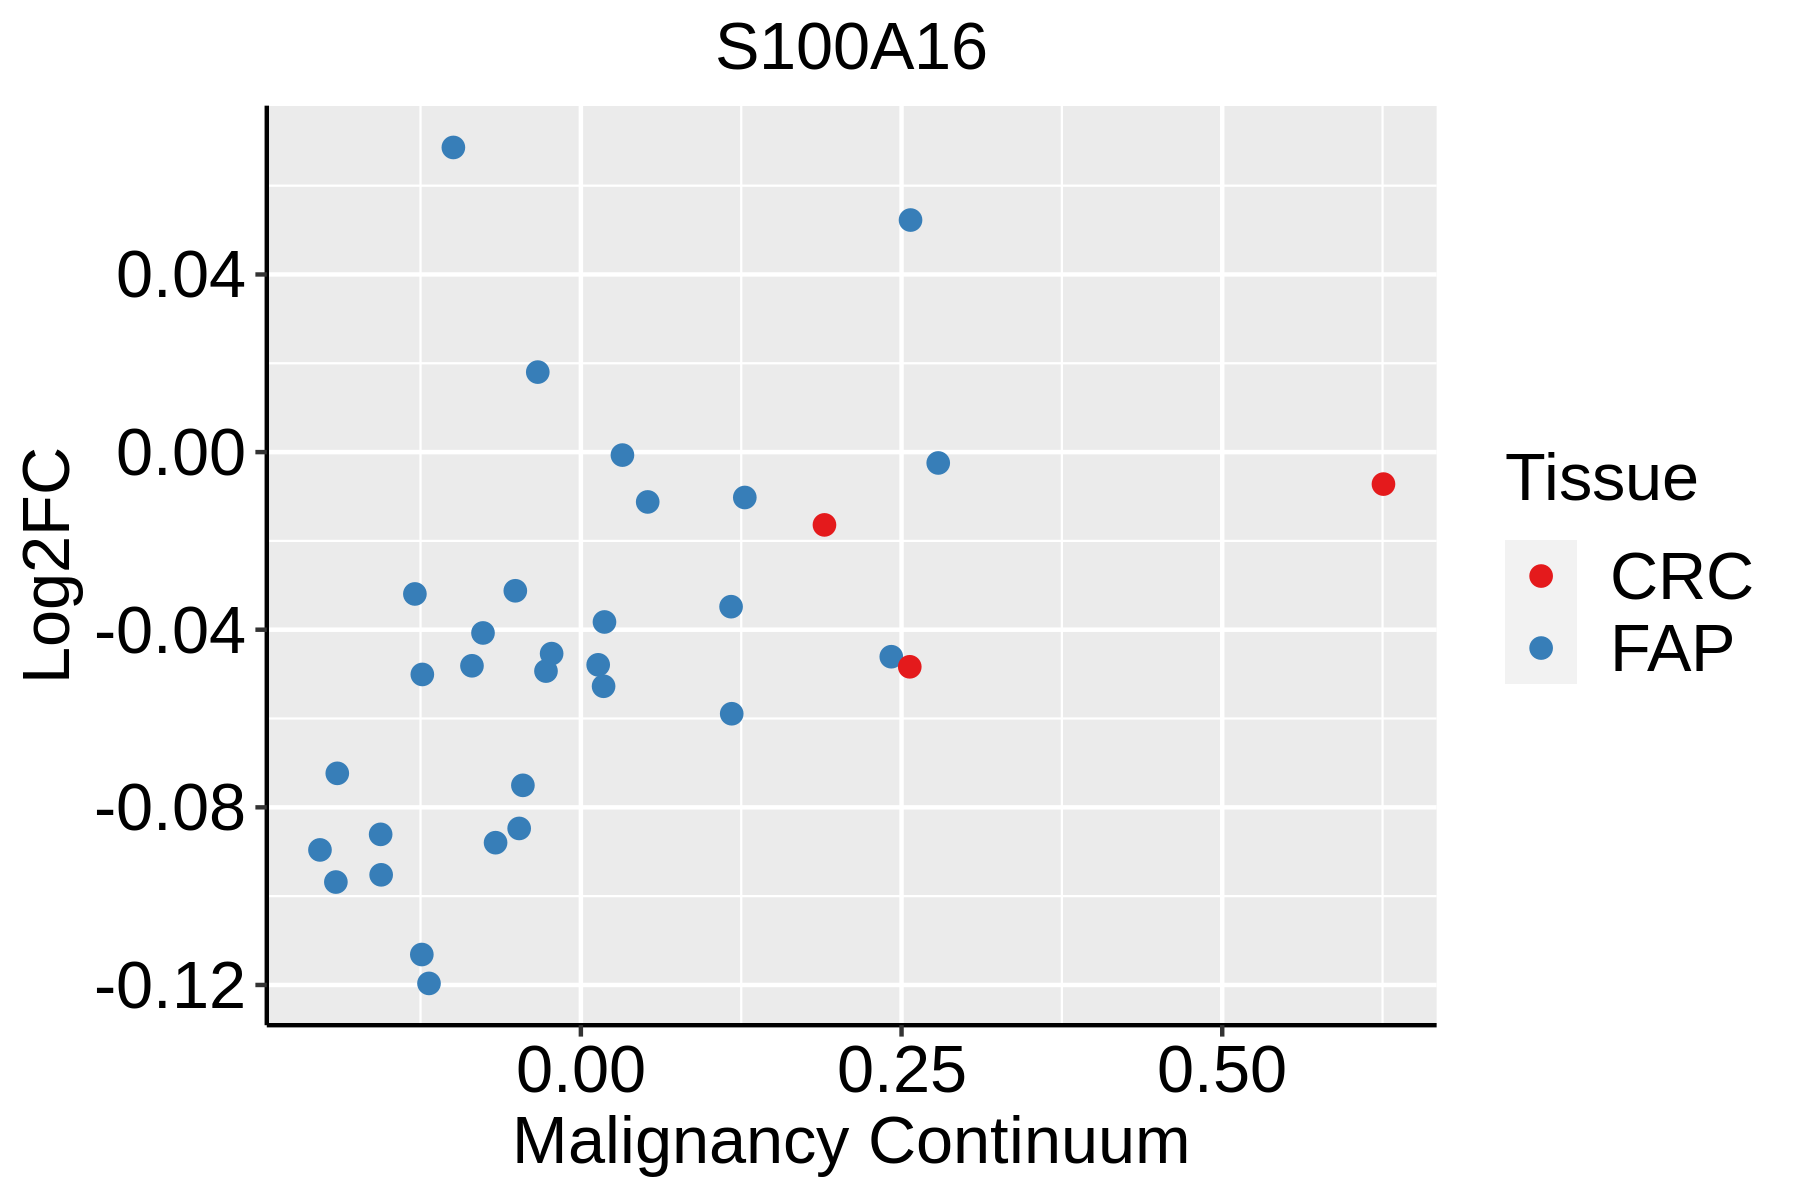 | FAP: Familial adenomatous polyposis |
| CRC: Colorectal cancer | ||
| Colorectum (HTA11) |  | AD: Adenomas |
| SER: Sessile serrated lesions | ||
| MSI-H: Microsatellite-high colorectal cancer | ||
| MSS: Microsatellite stable colorectal cancer | ||
| Endometrium |  | AEH: Atypical endometrial hyperplasia |
| EEC: Endometrioid Cancer | ||
| Esophagus | 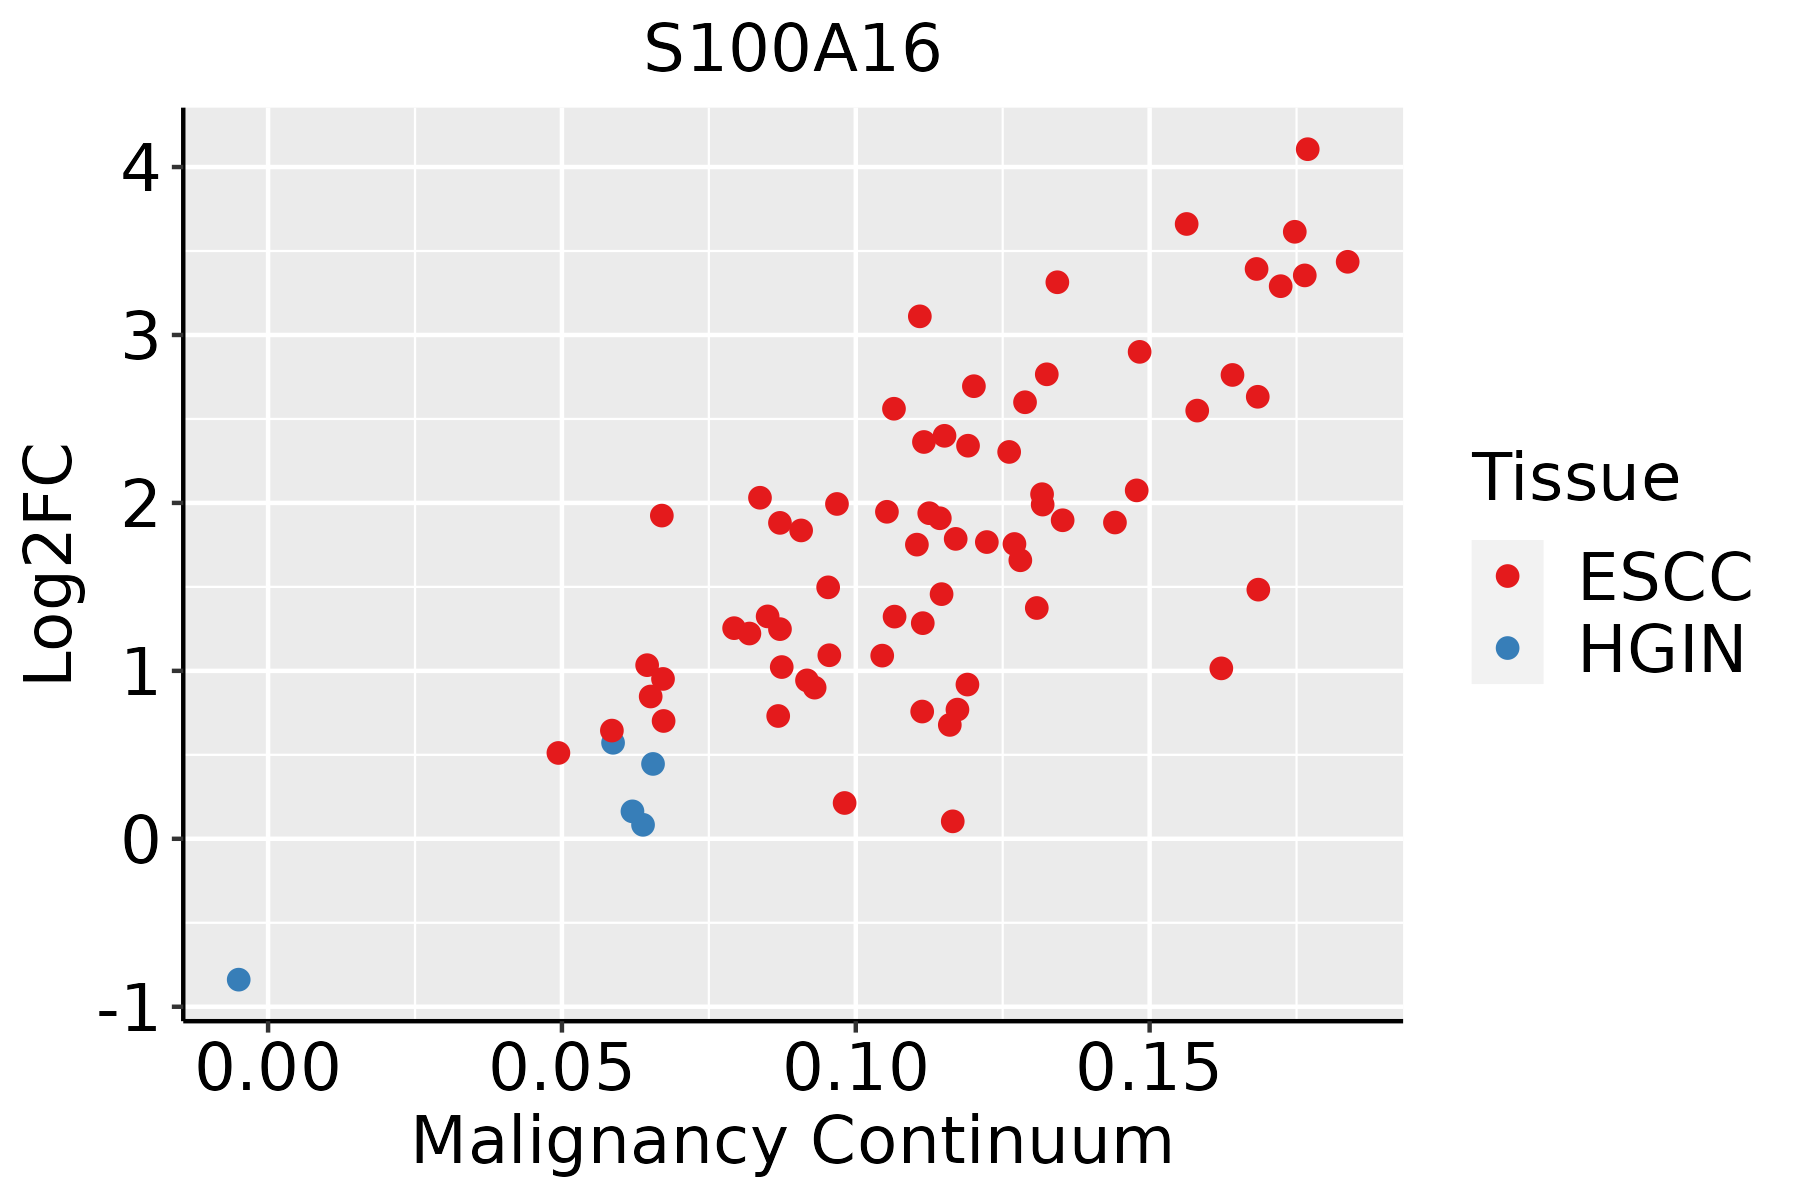 | ESCC: Esophageal squamous cell carcinoma |
| HGIN: High-grade intraepithelial neoplasias | ||
| LGIN: Low-grade intraepithelial neoplasias | ||
| GC | 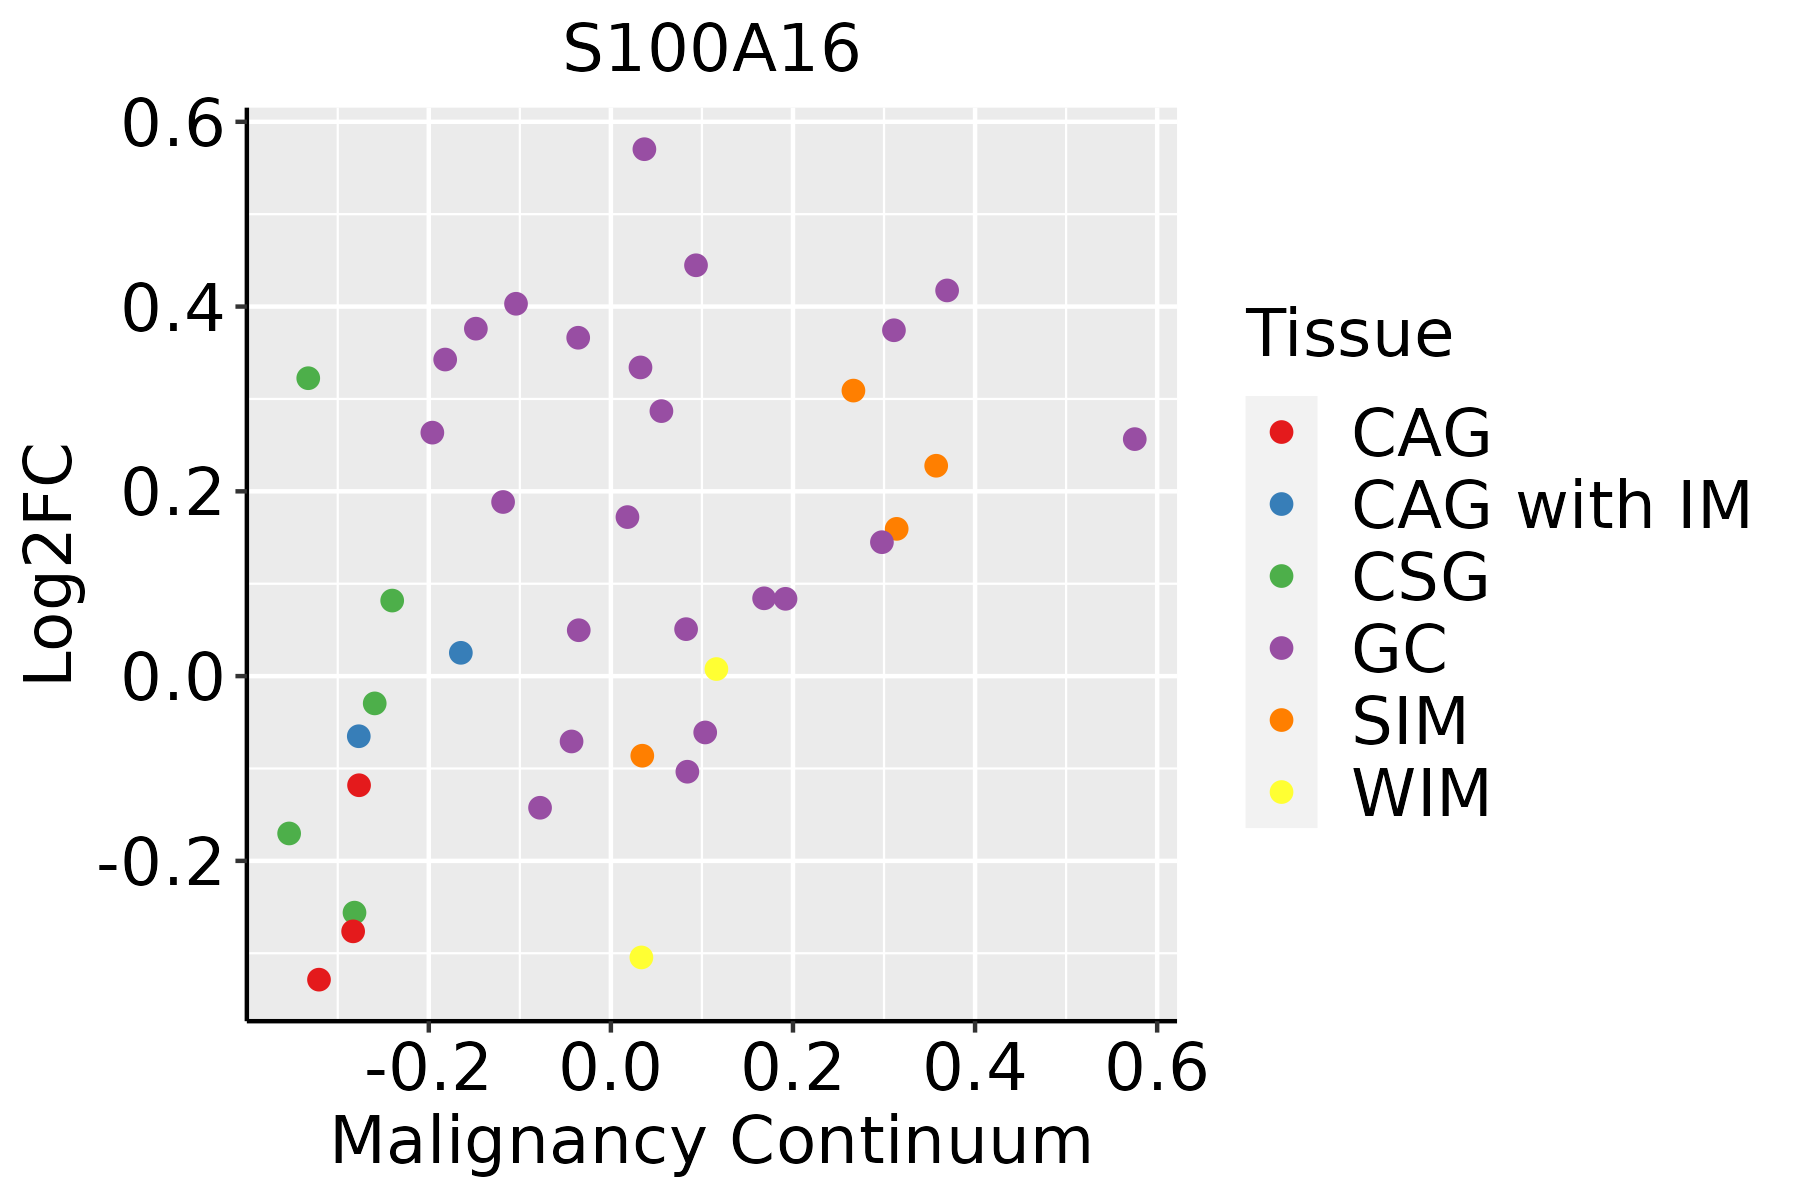 | CAG: Chronic atrophic gastritis |
| CAG with IM: Chronic atrophic gastritis with intestinal metaplasia | ||
| CSG: Chronic superficial gastritis | ||
| GC: Gastric cancer | ||
| SIM: Severe intestinal metaplasia | ||
| WIM: Wild intestinal metaplasia | ||
| Liver | 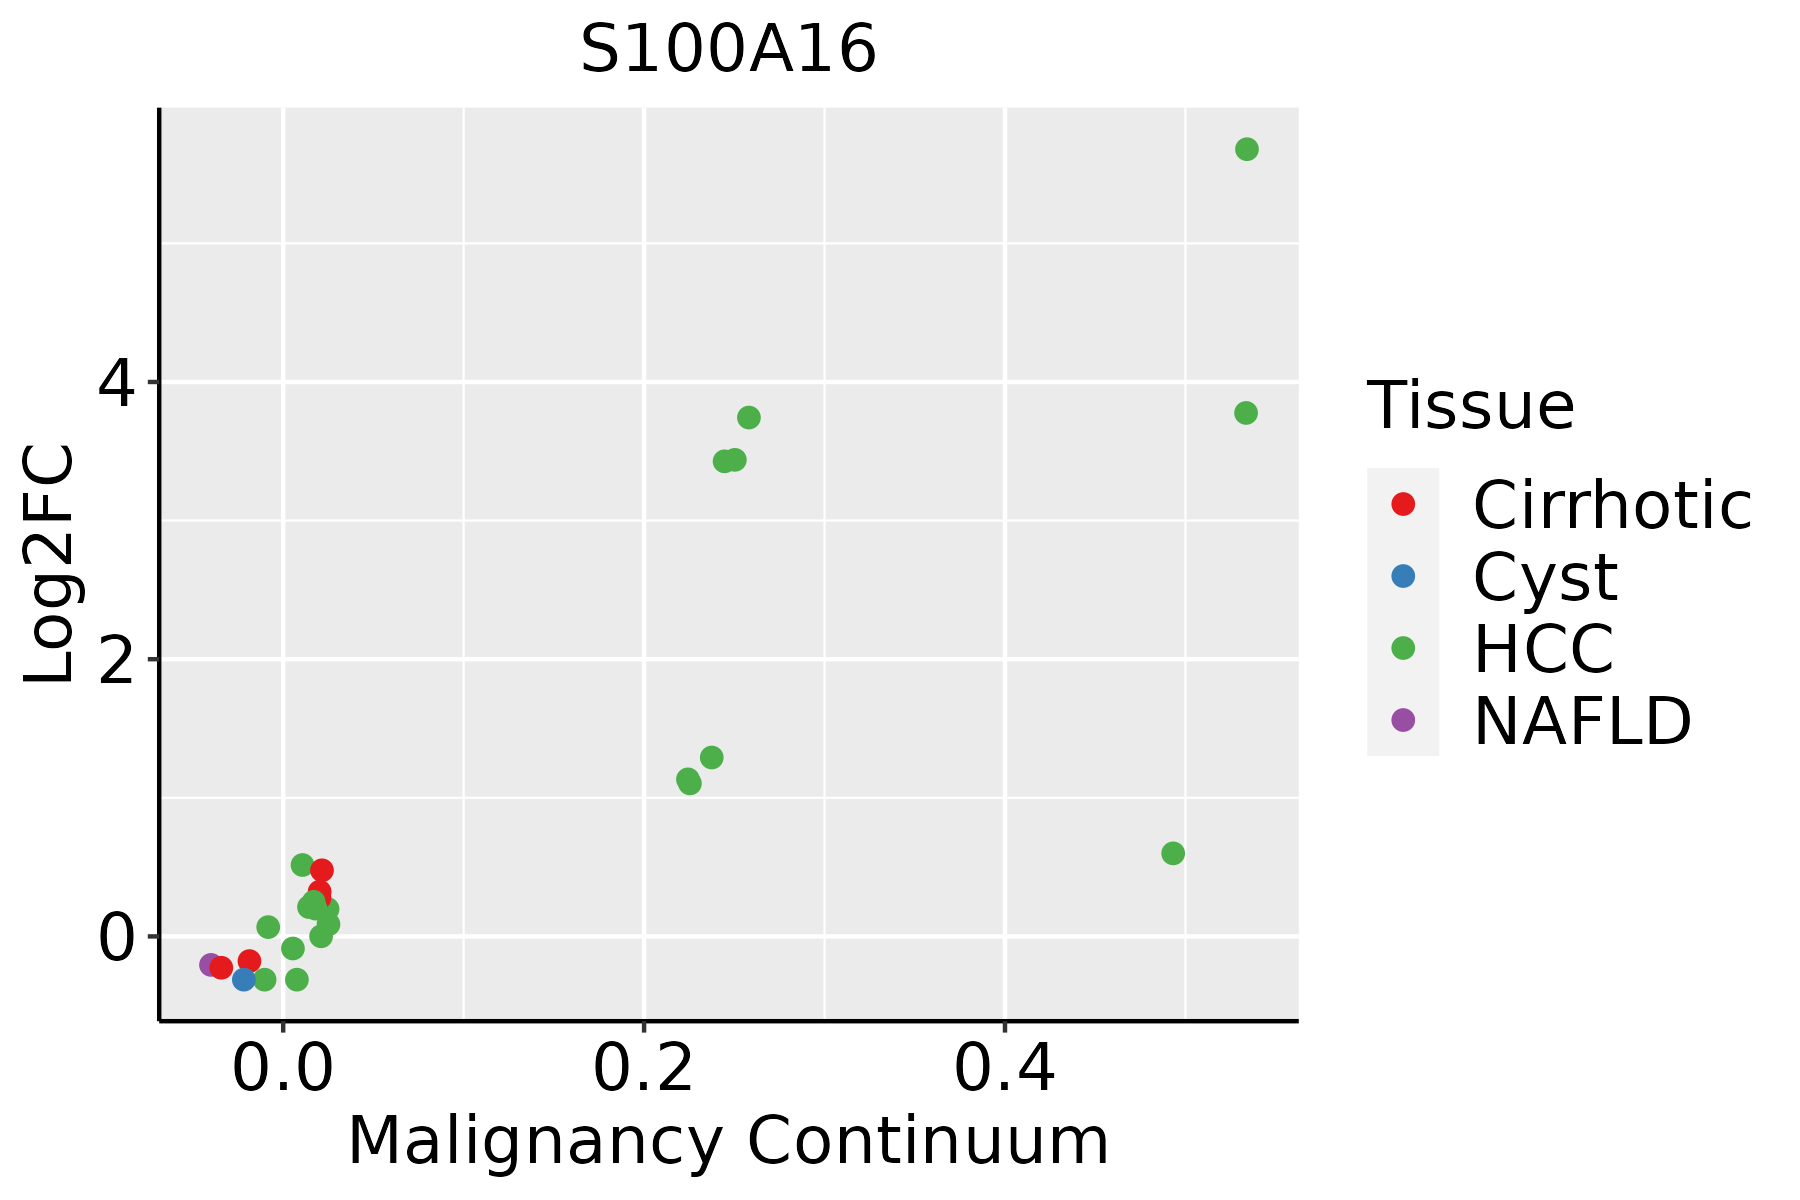 | HCC: Hepatocellular carcinoma |
| NAFLD: Non-alcoholic fatty liver disease | ||
| Oral Cavity | 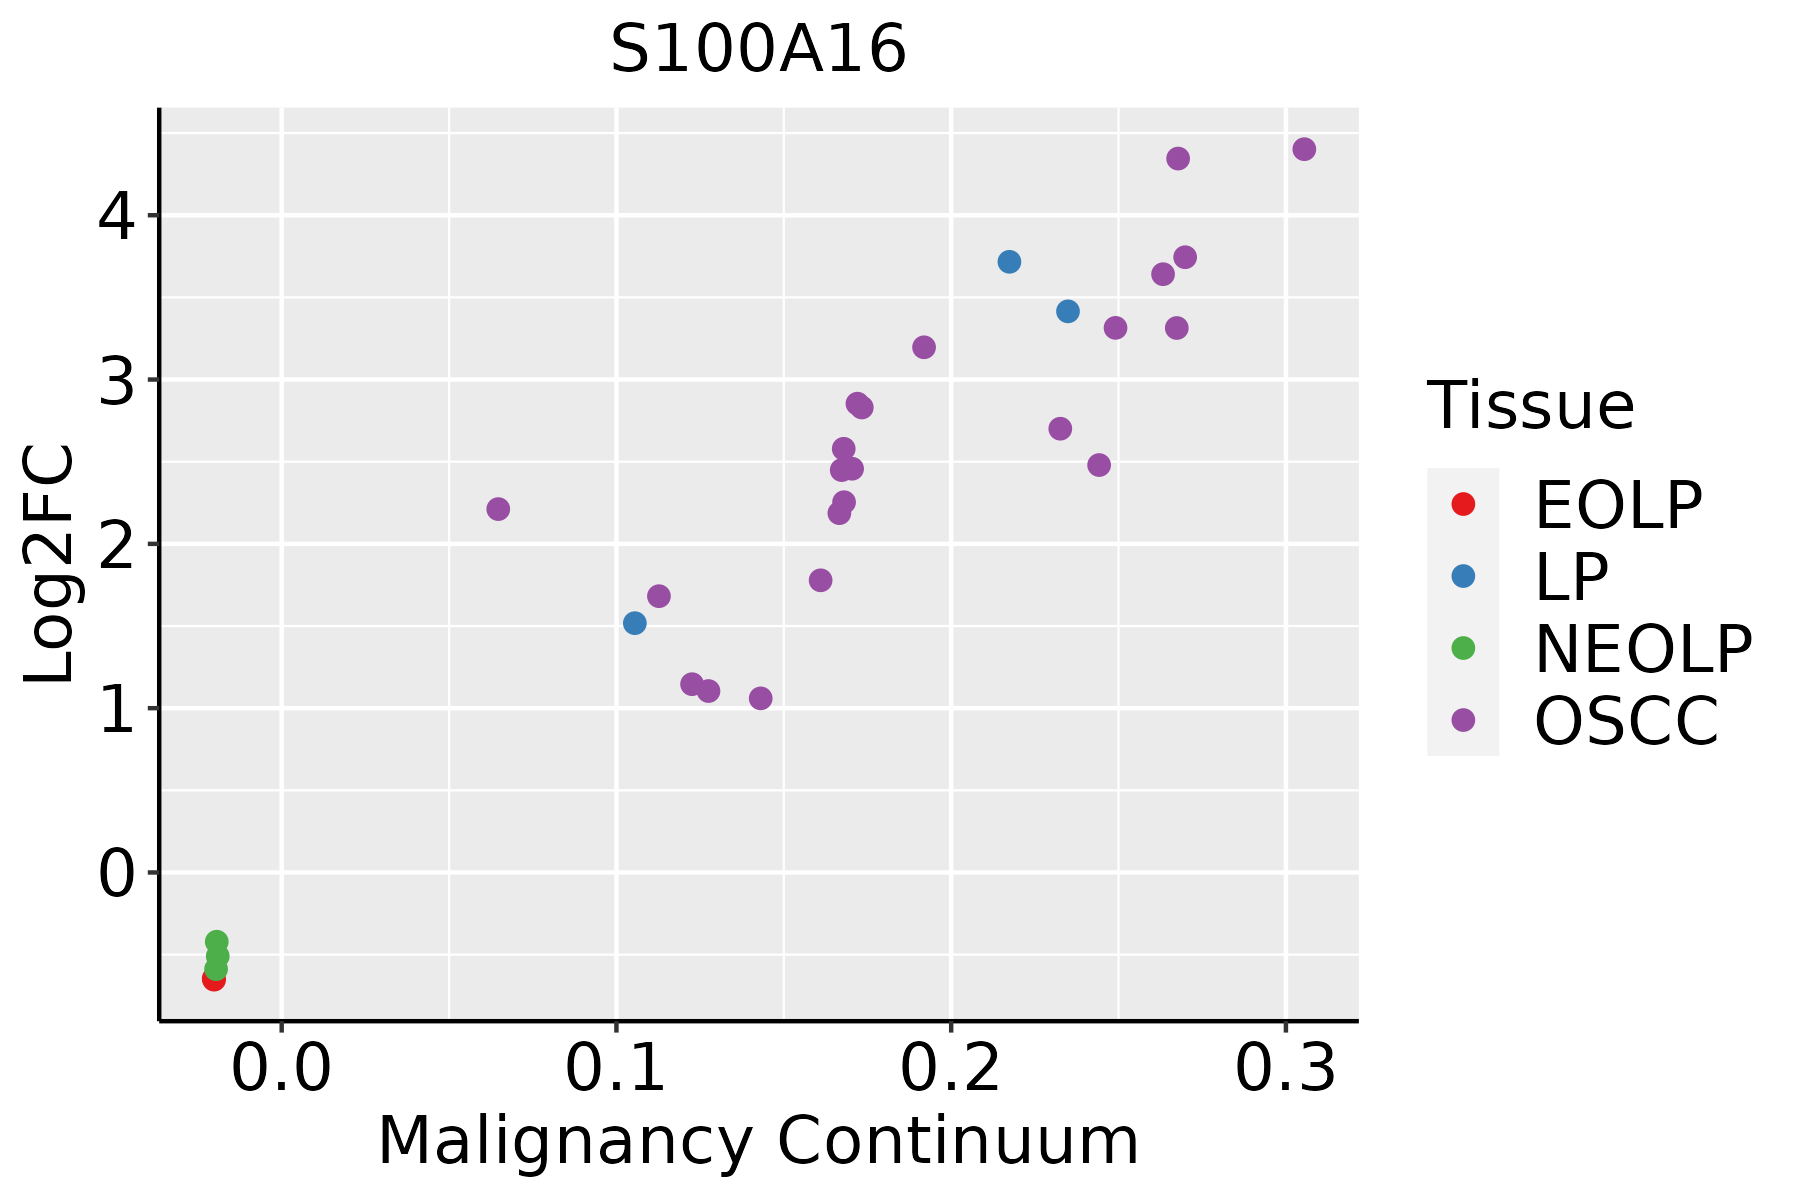 | EOLP: Erosive Oral lichen planus |
| LP: leukoplakia | ||
| NEOLP: Non-erosive oral lichen planus | ||
| OSCC: Oral squamous cell carcinoma | ||
| Prostate |  | BPH: Benign Prostatic Hyperplasia |
| Skin |  | AK: Actinic keratosis |
| cSCC: Cutaneous squamous cell carcinoma | ||
| SCCIS:squamous cell carcinoma in situ | ||
| Thyroid |  | ATC: Anaplastic thyroid cancer |
| HT: Hashimoto's thyroiditis | ||
| PTC: Papillary thyroid cancer |
| ∗log2FC in expression of this searched gene in stem-like cells from each diseased tissue sample relative to stem-like cells in normal samples in each tissue plotted against the malignancy continuum. Samples are colored based on if they are from different disease stage. |
Top |
Malignant transformation related pathway analysis |
| Find out the enriched GO biological processes and KEGG pathways involved in transition from healthy to precancer to cancer |
| Tissue | Disease Stage | Enriched GO biological Processes |
| Colorectum | AD |  |
| Colorectum | SER |  |
| Colorectum | MSS |  |
| Colorectum | MSI-H |  |
| Colorectum | FAP |  |
| ∗Top 15 enriched GO BP terms are showed in the bar plot of each disease state in each tissue. Each row represents a significant GO biological process which is colored according to the -log10(p.adjust). |
| Page: 1 2 3 4 5 6 7 8 9 |
| GO ID | Tissue | Disease Stage | Description | Gene Ratio | Bg Ratio | pvalue | p.adjust | Count |
| GO:00100389 | Breast | Precancer | response to metal ion | 47/1080 | 373/18723 | 3.88e-07 | 1.79e-05 | 47 |
| GO:00515925 | Breast | Precancer | response to calcium ion | 18/1080 | 149/18723 | 2.37e-03 | 2.19e-02 | 18 |
| GO:001003814 | Breast | IDC | response to metal ion | 65/1434 | 373/18723 | 2.95e-10 | 3.42e-08 | 65 |
| GO:005159213 | Breast | IDC | response to calcium ion | 21/1434 | 149/18723 | 4.79e-03 | 3.67e-02 | 21 |
| GO:001003824 | Breast | DCIS | response to metal ion | 65/1390 | 373/18723 | 8.03e-11 | 9.88e-09 | 65 |
| GO:005159223 | Breast | DCIS | response to calcium ion | 21/1390 | 149/18723 | 3.34e-03 | 2.81e-02 | 21 |
| GO:001003810 | Cervix | CC | response to metal ion | 67/2311 | 373/18723 | 9.67e-04 | 8.10e-03 | 67 |
| GO:00515926 | Cervix | CC | response to calcium ion | 31/2311 | 149/18723 | 2.31e-03 | 1.65e-02 | 31 |
| GO:001003815 | Cervix | HSIL_HPV | response to metal ion | 36/737 | 373/18723 | 7.19e-07 | 3.65e-05 | 36 |
| GO:005159214 | Cervix | HSIL_HPV | response to calcium ion | 14/737 | 149/18723 | 2.29e-03 | 2.28e-02 | 14 |
| GO:001003825 | Cervix | N_HPV | response to metal ion | 27/534 | 373/18723 | 1.00e-05 | 3.46e-04 | 27 |
| GO:005159224 | Cervix | N_HPV | response to calcium ion | 12/534 | 149/18723 | 1.18e-03 | 1.33e-02 | 12 |
| GO:0010038 | Colorectum | AD | response to metal ion | 106/3918 | 373/18723 | 3.22e-04 | 3.83e-03 | 106 |
| GO:00100381 | Colorectum | SER | response to metal ion | 84/2897 | 373/18723 | 1.87e-04 | 3.44e-03 | 84 |
| GO:00100382 | Colorectum | MSS | response to metal ion | 90/3467 | 373/18723 | 3.76e-03 | 2.76e-02 | 90 |
| GO:00100383 | Colorectum | MSI-H | response to metal ion | 41/1319 | 373/18723 | 3.09e-03 | 3.87e-02 | 41 |
| GO:001003816 | Endometrium | AEH | response to metal ion | 65/2100 | 373/18723 | 2.02e-04 | 2.54e-03 | 65 |
| GO:00515927 | Endometrium | AEH | response to calcium ion | 28/2100 | 149/18723 | 4.22e-03 | 2.79e-02 | 28 |
| GO:001003817 | Endometrium | EEC | response to metal ion | 66/2168 | 373/18723 | 2.86e-04 | 3.23e-03 | 66 |
| GO:005159215 | Endometrium | EEC | response to calcium ion | 28/2168 | 149/18723 | 6.52e-03 | 3.81e-02 | 28 |
| Page: 1 2 3 |
| Pathway ID | Tissue | Disease Stage | Description | Gene Ratio | Bg Ratio | pvalue | p.adjust | qvalue | Count |
| Page: 1 |
Top |
Cell-cell communication analysis |
| Identification of potential cell-cell interactions between two cell types and their ligand-receptor pairs for different disease states |
| Ligand | Receptor | LRpair | Pathway | Tissue | Disease Stage |
| Page: 1 |
Top |
Single-cell gene regulatory network inference analysis |
| Find out the significant the regulons (TFs) and the target genes of each regulon across cell types for different disease states |
| TF | Cell Type | Tissue | Disease Stage | Target Gene | RSS | Regulon Activity |
| ∗The dot plots of a searched regulon are shown for all cell subpopulations in each disease state of each tissue based on the regulon specific score inferred using pySCENIC and by calculating the average expression. |
| Page: 1 |
Top |
Somatic mutation of malignant transformation related genes |
| Annotation of somatic variants for genes involved in malignant transformation |
| Hugo Symbol | Variant Class | Variant Classification | dbSNP RS | HGVSc | HGVSp | HGVSp Short | SWISSPROT | BIOTYPE | SIFT | PolyPhen | Tumor Sample Barcode | Tissue | Histology | Sex | Age | Stage | Therapy Types | Drugs | Outcome |
| S100A16 | SNV | Missense_Mutation | c.246N>C | p.Leu82Phe | p.L82F | Q96FQ6 | protein_coding | tolerated(0.06) | possibly_damaging(0.488) | TCGA-IR-A3LA-01 | Cervix | cervical & endocervical cancer | Female | <65 | I/II | Chemotherapy | cisplatin | CR | |
| S100A16 | SNV | Missense_Mutation | c.253G>A | p.Gly85Ser | p.G85S | Q96FQ6 | protein_coding | tolerated(0.22) | possibly_damaging(0.77) | TCGA-AA-3864-01 | Colorectum | colon adenocarcinoma | Male | >=65 | I/II | Unknown | Unknown | SD | |
| S100A16 | SNV | Missense_Mutation | rs201595733 | c.271G>A | p.Ala91Thr | p.A91T | Q96FQ6 | protein_coding | tolerated(0.08) | probably_damaging(0.934) | TCGA-CM-6162-01 | Colorectum | colon adenocarcinoma | Female | <65 | III/IV | Chemotherapy | oxaliplatin | SD |
| S100A16 | SNV | Missense_Mutation | rs757073911 | c.152N>T | p.Ser51Leu | p.S51L | Q96FQ6 | protein_coding | deleterious(0.03) | benign(0) | TCGA-A5-A0G2-01 | Endometrium | uterine corpus endometrioid carcinoma | Female | <65 | III/IV | Unknown | Unknown | SD |
| S100A16 | SNV | Missense_Mutation | rs773071655 | c.218G>A | p.Arg73His | p.R73H | Q96FQ6 | protein_coding | tolerated(0.08) | possibly_damaging(0.489) | TCGA-B5-A3FC-01 | Endometrium | uterine corpus endometrioid carcinoma | Female | <65 | I/II | Unknown | Unknown | SD |
| S100A16 | SNV | Missense_Mutation | rs142651762 | c.17C>T | p.Thr6Met | p.T6M | Q96FQ6 | protein_coding | deleterious(0) | probably_damaging(0.977) | TCGA-D1-A167-01 | Endometrium | uterine corpus endometrioid carcinoma | Female | >=65 | I/II | Unknown | Unknown | SD |
| S100A16 | SNV | Missense_Mutation | c.271N>T | p.Ala91Ser | p.A91S | Q96FQ6 | protein_coding | tolerated(0.21) | probably_damaging(0.956) | TCGA-55-8207-01 | Lung | lung adenocarcinoma | Male | >=65 | I/II | Unknown | Unknown | SD | |
| S100A16 | SNV | Missense_Mutation | novel | c.25G>A | p.Glu9Lys | p.E9K | Q96FQ6 | protein_coding | deleterious(0) | benign(0.122) | TCGA-CV-A45W-01 | Oral cavity | head & neck squamous cell carcinoma | Male | >=65 | I/II | Unknown | Unknown | SD |
| S100A16 | SNV | Missense_Mutation | rs142272783 | c.115N>T | p.Arg39Cys | p.R39C | Q96FQ6 | protein_coding | deleterious(0) | benign(0.003) | TCGA-CG-5726-01 | Stomach | stomach adenocarcinoma | Male | >=65 | I/II | Unknown | Unknown | SD |
| Page: 1 |
Top |
Related drugs of malignant transformation related genes |
| Identification of chemicals and drugs interact with genes involved in malignant transfromation |
| (DGIdb 4.0) |
| Entrez ID | Symbol | Category | Interaction Types | Drug Claim Name | Drug Name | PMIDs |
| Page: 1 |

Copyright 2023-Present -The University of Texas Health Science Center at Houston |