
|
|||||
|
 | |
| |
| |
| |
| |
| |
|
Gene: S100A14 |
Gene summary for S100A14 |
| Gene information | Species | Human | Gene symbol | S100A14 | Gene ID | 57402 |
| Gene name | S100 calcium binding protein A14 | |
| Gene Alias | BCMP84 | |
| Cytomap | 1q21.3 | |
| Gene Type | protein-coding | GO ID | GO:0002221 | UniProtAcc | Q9HCY8 |
Top |
Malignant transformation analysis |
| Identification of the aberrant gene expression in precancerous and cancerous lesions by comparing the gene expression of stem-like cells in diseased tissues with normal stem cells |
| Entrez ID | Symbol | Replicates | Species | Organ | Tissue | Adj P-value | Log2FC | Malignancy |
| 57402 | S100A14 | GSM4909281 | Human | Breast | IDC | 6.64e-05 | -1.90e-01 | 0.21 |
| 57402 | S100A14 | GSM4909285 | Human | Breast | IDC | 2.26e-15 | -3.47e-01 | 0.21 |
| 57402 | S100A14 | GSM4909286 | Human | Breast | IDC | 9.77e-24 | -5.47e-01 | 0.1081 |
| 57402 | S100A14 | GSM4909288 | Human | Breast | IDC | 2.64e-07 | -6.19e-01 | 0.0988 |
| 57402 | S100A14 | GSM4909289 | Human | Breast | IDC | 2.26e-03 | -5.93e-01 | 0.1064 |
| 57402 | S100A14 | GSM4909293 | Human | Breast | IDC | 1.47e-02 | -1.06e-02 | 0.1581 |
| 57402 | S100A14 | GSM4909296 | Human | Breast | IDC | 1.31e-03 | -1.85e-01 | 0.1524 |
| 57402 | S100A14 | GSM4909297 | Human | Breast | IDC | 2.58e-18 | 2.97e-01 | 0.1517 |
| 57402 | S100A14 | GSM4909298 | Human | Breast | IDC | 1.47e-03 | 2.05e-01 | 0.1551 |
| 57402 | S100A14 | GSM4909299 | Human | Breast | IDC | 5.34e-11 | -4.18e-01 | 0.035 |
| 57402 | S100A14 | GSM4909300 | Human | Breast | IDC | 3.99e-03 | -3.97e-01 | 0.0334 |
| 57402 | S100A14 | GSM4909301 | Human | Breast | IDC | 1.23e-59 | -1.03e+00 | 0.1577 |
| 57402 | S100A14 | GSM4909302 | Human | Breast | IDC | 1.26e-02 | 2.44e-01 | 0.1545 |
| 57402 | S100A14 | GSM4909303 | Human | Breast | IDC | 2.71e-02 | -4.71e-01 | 0.0438 |
| 57402 | S100A14 | GSM4909304 | Human | Breast | IDC | 8.03e-21 | 5.40e-01 | 0.1636 |
| 57402 | S100A14 | GSM4909306 | Human | Breast | IDC | 1.56e-05 | 3.93e-01 | 0.1564 |
| 57402 | S100A14 | GSM4909309 | Human | Breast | IDC | 7.03e-12 | -5.47e-01 | 0.0483 |
| 57402 | S100A14 | GSM4909311 | Human | Breast | IDC | 6.16e-29 | -4.81e-01 | 0.1534 |
| 57402 | S100A14 | GSM4909312 | Human | Breast | IDC | 5.37e-05 | -3.02e-01 | 0.1552 |
| 57402 | S100A14 | GSM4909315 | Human | Breast | IDC | 1.82e-45 | -9.65e-01 | 0.21 |
| Page: 1 2 3 4 5 6 7 8 9 10 11 12 13 14 15 |
| Tissue | Expression Dynamics | Abbreviation |
| Breast |  | IDC: Invasive ductal carcinoma |
| DCIS: Ductal carcinoma in situ | ||
| Precancer(BRCA1-mut): Precancerous lesion from BRCA1 mutation carriers | ||
| Cervix | 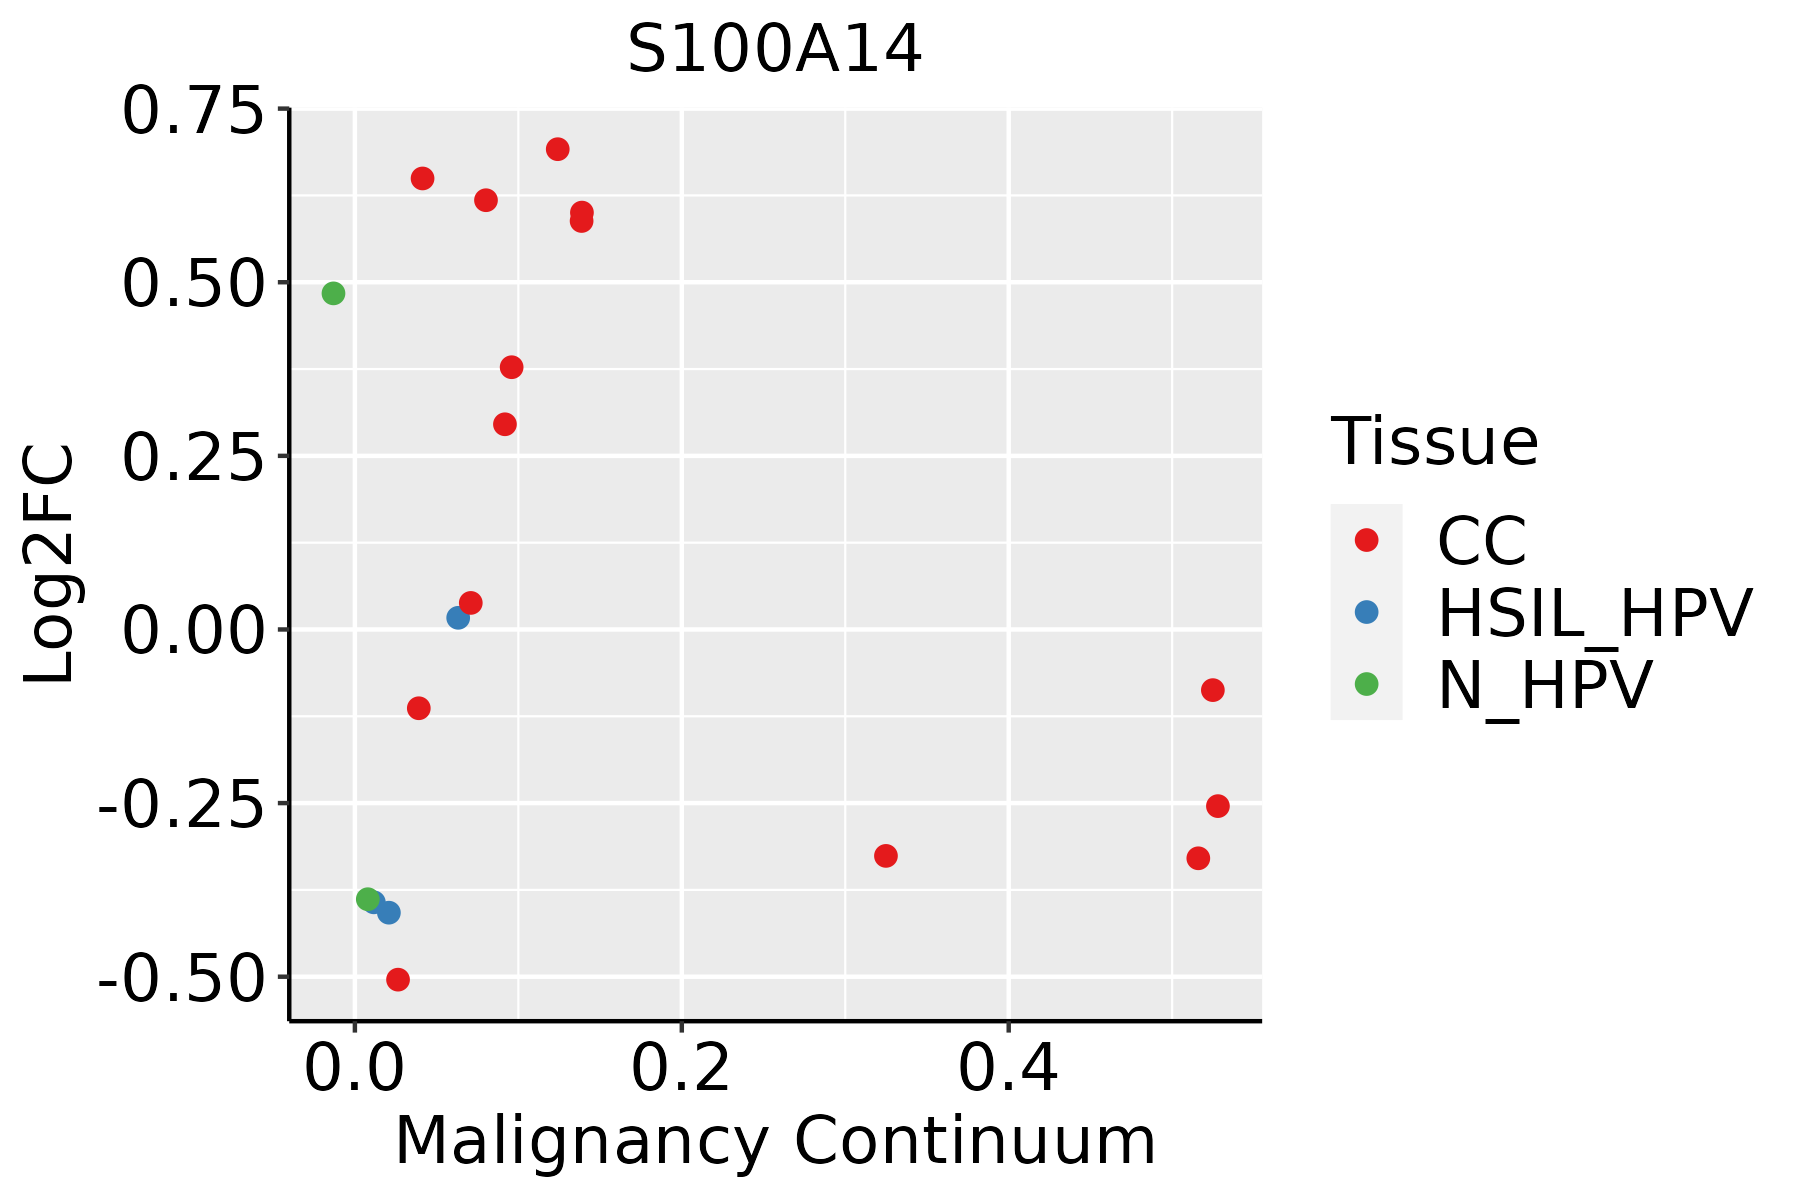 | CC: Cervix cancer |
| HSIL_HPV: HPV-infected high-grade squamous intraepithelial lesions | ||
| N_HPV: HPV-infected normal cervix | ||
| Colorectum (GSE201348) |  | FAP: Familial adenomatous polyposis |
| CRC: Colorectal cancer | ||
| Colorectum (HTA11) |  | AD: Adenomas |
| SER: Sessile serrated lesions | ||
| MSI-H: Microsatellite-high colorectal cancer | ||
| MSS: Microsatellite stable colorectal cancer | ||
| Esophagus |  | ESCC: Esophageal squamous cell carcinoma |
| HGIN: High-grade intraepithelial neoplasias | ||
| LGIN: Low-grade intraepithelial neoplasias | ||
| GC |  | CAG: Chronic atrophic gastritis |
| CAG with IM: Chronic atrophic gastritis with intestinal metaplasia | ||
| CSG: Chronic superficial gastritis | ||
| GC: Gastric cancer | ||
| SIM: Severe intestinal metaplasia | ||
| WIM: Wild intestinal metaplasia | ||
| Liver |  | HCC: Hepatocellular carcinoma |
| NAFLD: Non-alcoholic fatty liver disease | ||
| Oral Cavity | 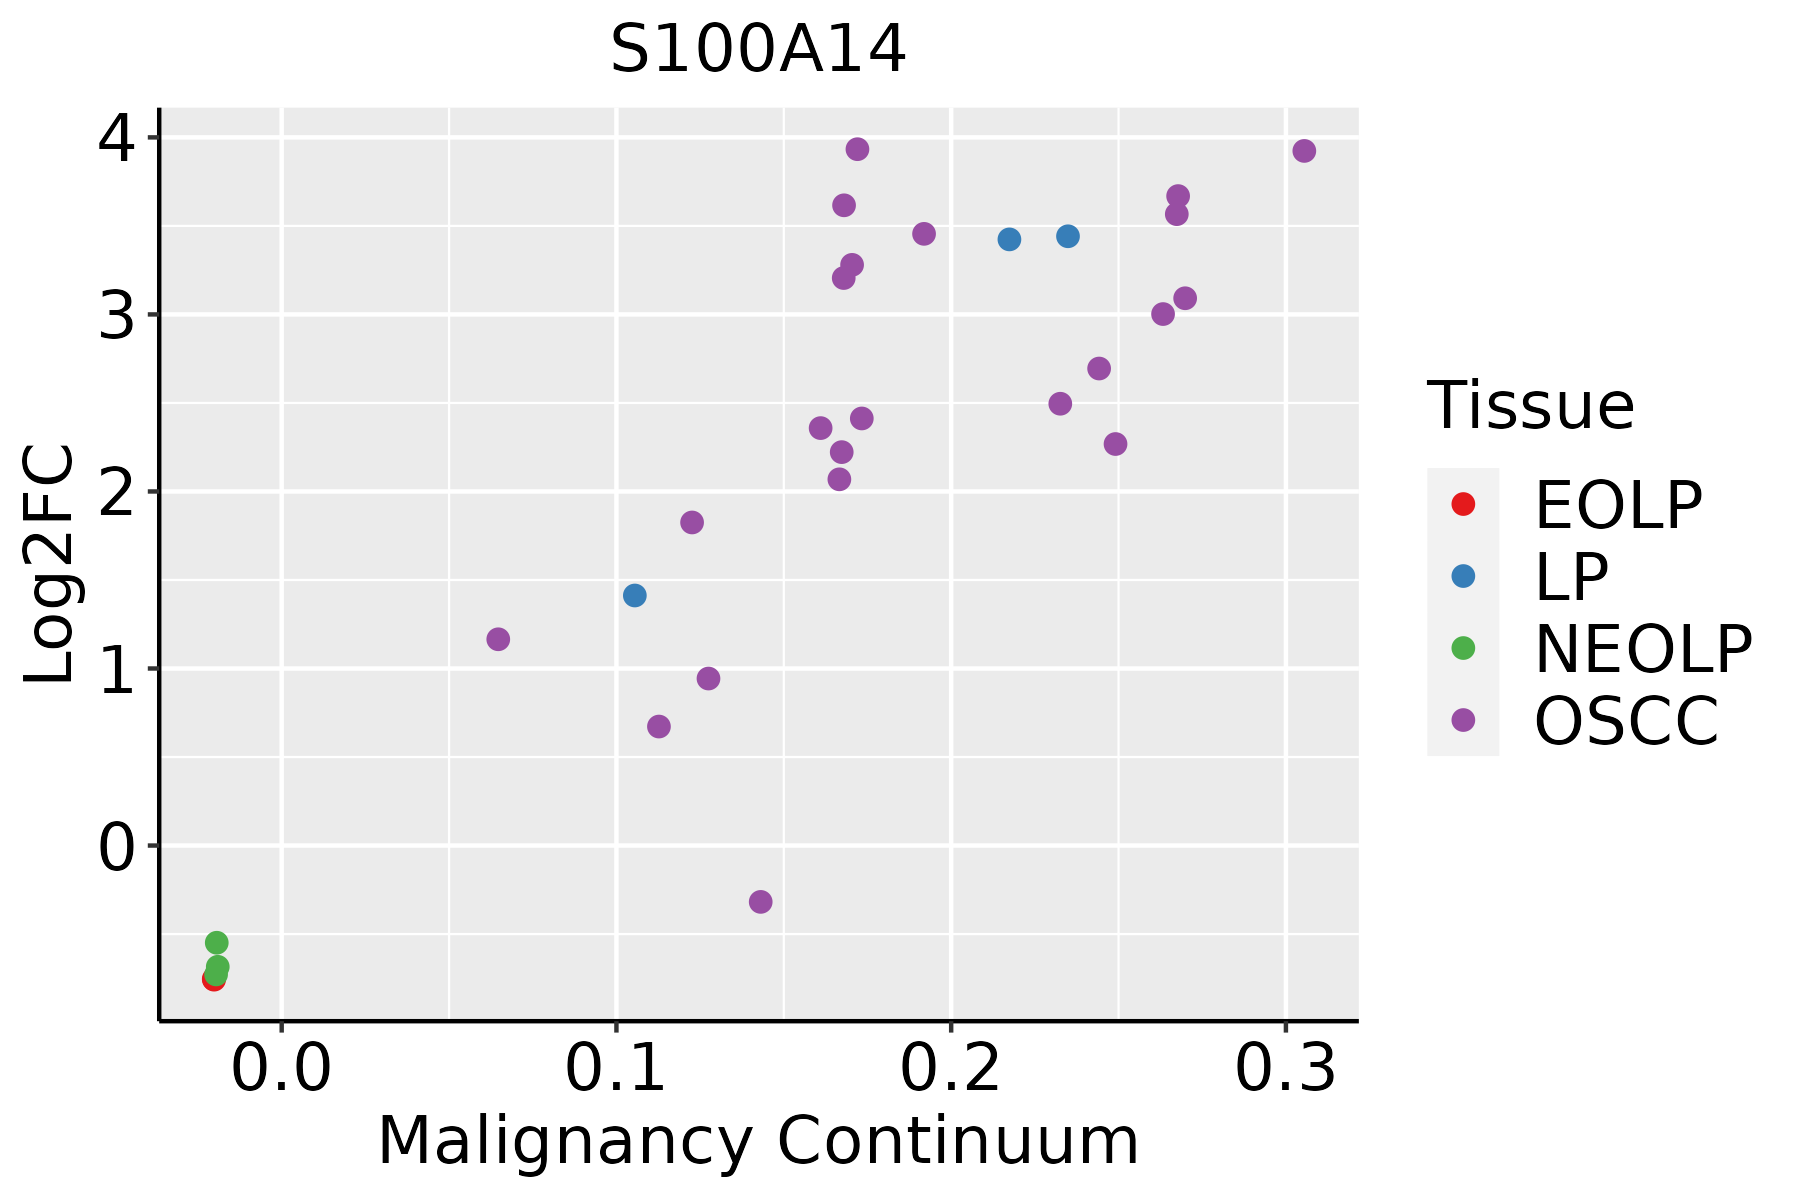 | EOLP: Erosive Oral lichen planus |
| LP: leukoplakia | ||
| NEOLP: Non-erosive oral lichen planus | ||
| OSCC: Oral squamous cell carcinoma | ||
| Prostate |  | BPH: Benign Prostatic Hyperplasia |
| Skin | 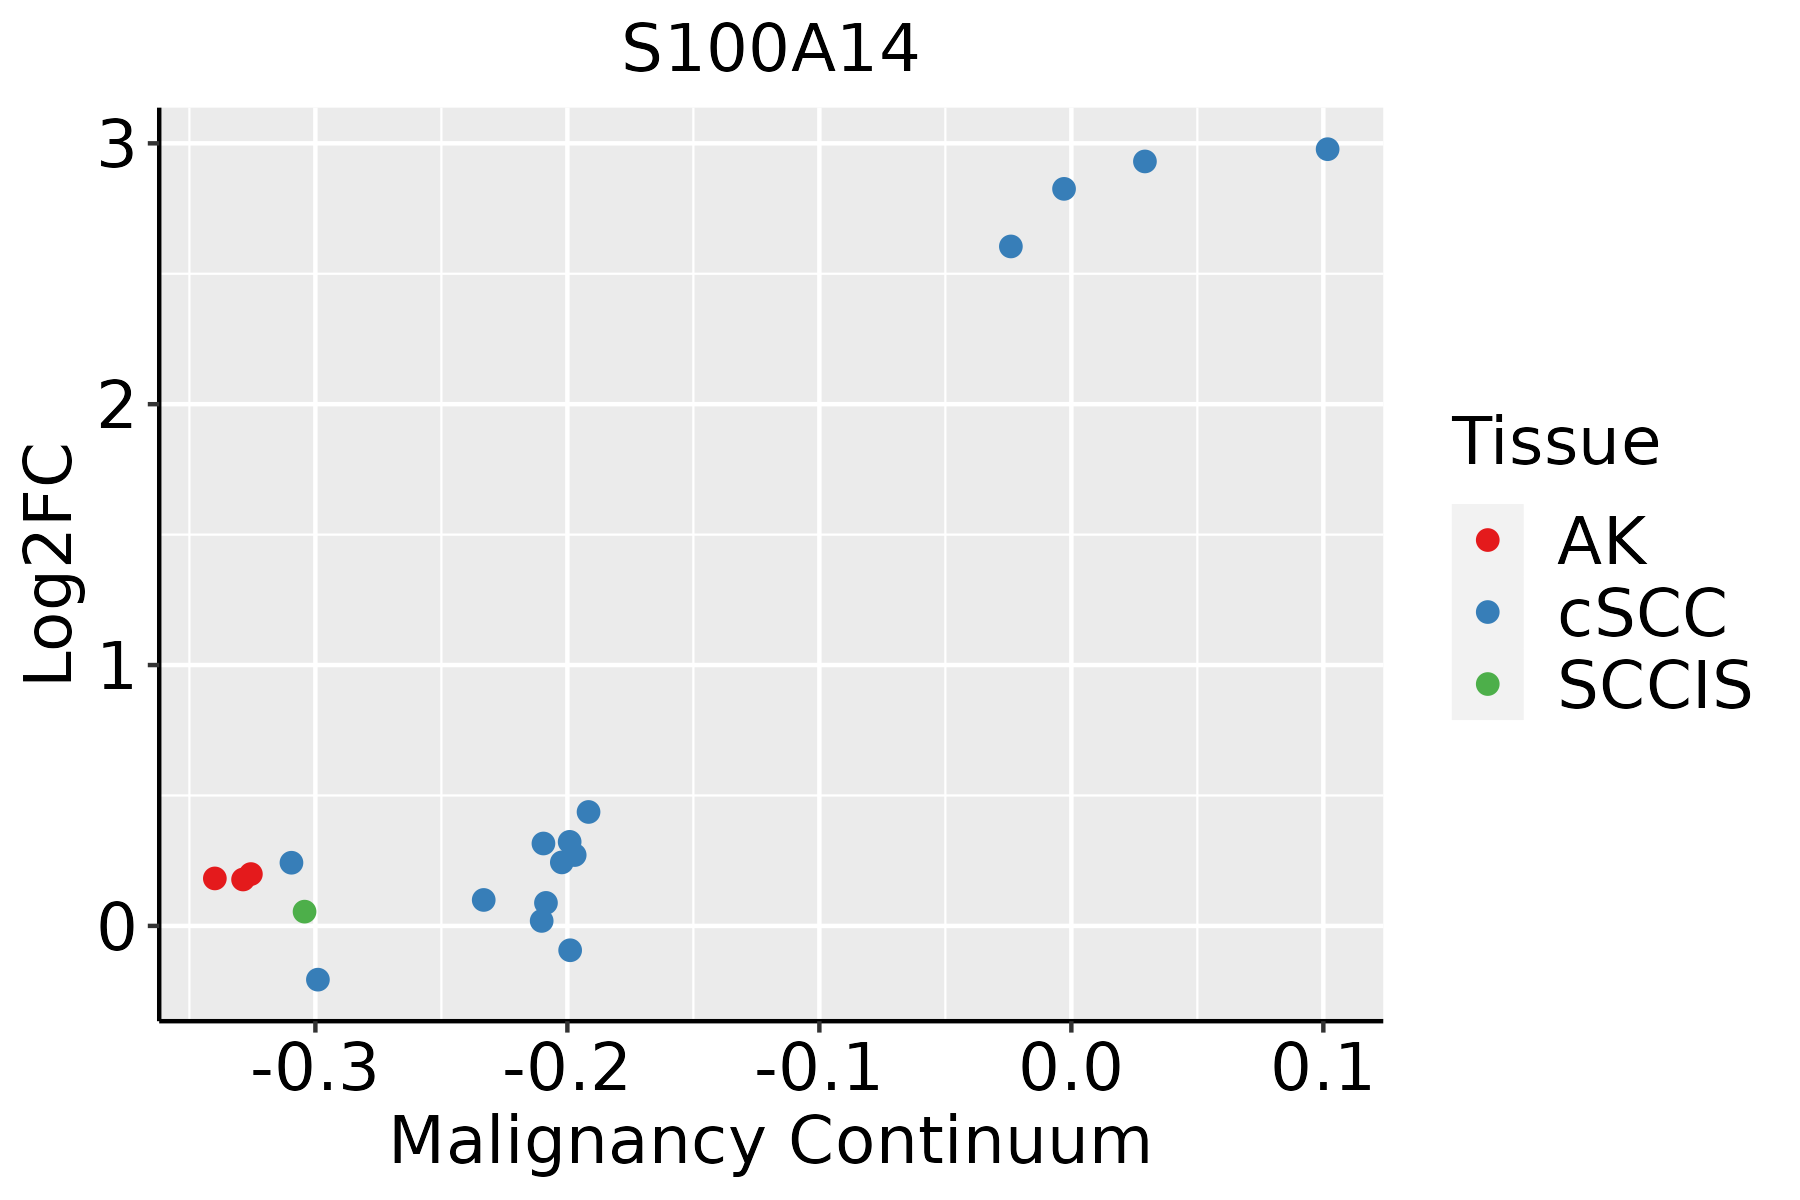 | AK: Actinic keratosis |
| cSCC: Cutaneous squamous cell carcinoma | ||
| SCCIS:squamous cell carcinoma in situ | ||
| Thyroid | 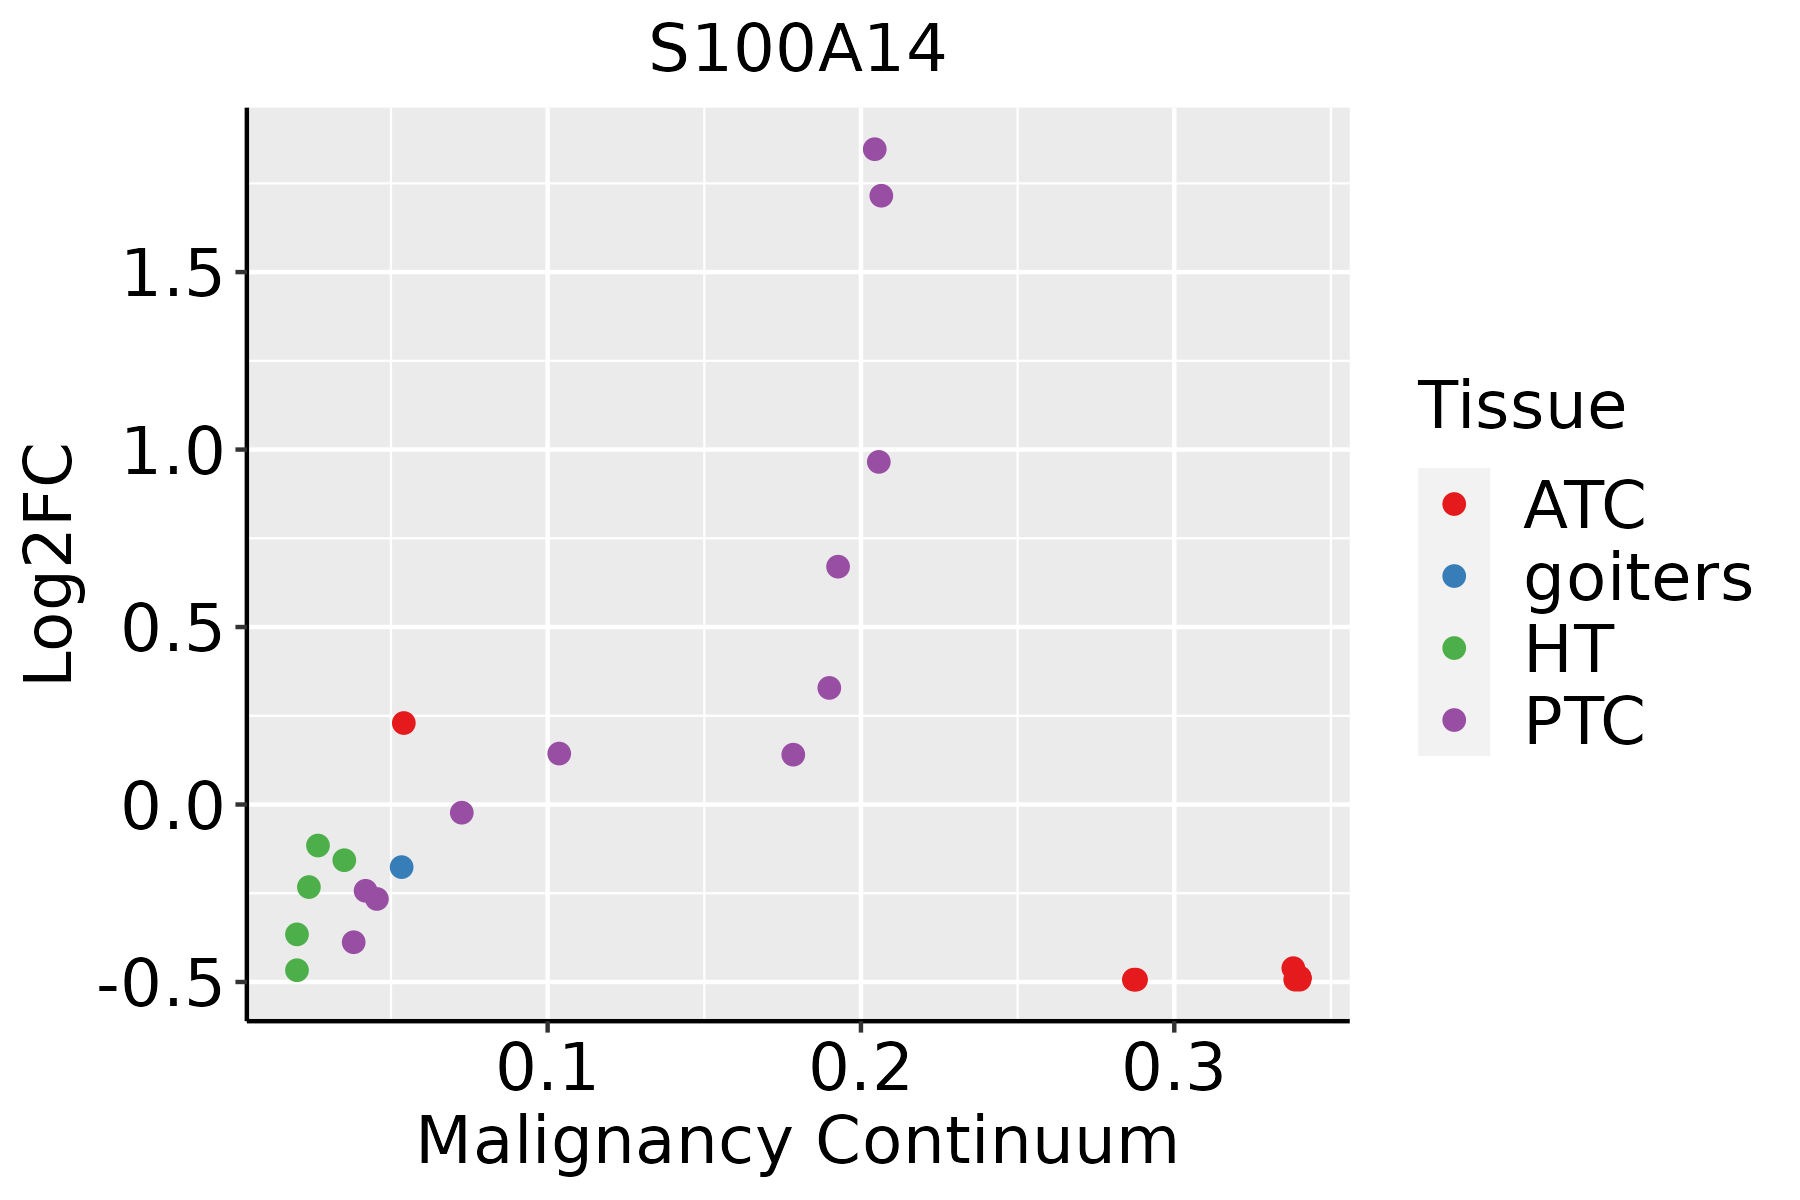 | ATC: Anaplastic thyroid cancer |
| HT: Hashimoto's thyroiditis | ||
| PTC: Papillary thyroid cancer |
| ∗log2FC in expression of this searched gene in stem-like cells from each diseased tissue sample relative to stem-like cells in normal samples in each tissue plotted against the malignancy continuum. Samples are colored based on if they are from different disease stage. |
Top |
Malignant transformation related pathway analysis |
| Find out the enriched GO biological processes and KEGG pathways involved in transition from healthy to precancer to cancer |
| Tissue | Disease Stage | Enriched GO biological Processes |
| Colorectum | AD |  |
| Colorectum | SER |  |
| Colorectum | MSS |  |
| Colorectum | MSI-H |  |
| Colorectum | FAP |  |
| ∗Top 15 enriched GO BP terms are showed in the bar plot of each disease state in each tissue. Each row represents a significant GO biological process which is colored according to the -log10(p.adjust). |
| Page: 1 2 3 4 5 6 7 8 9 |
| GO ID | Tissue | Disease Stage | Description | Gene Ratio | Bg Ratio | pvalue | p.adjust | Count |
| GO:00975297 | Breast | Precancer | myeloid leukocyte migration | 34/1080 | 220/18723 | 1.42e-07 | 7.82e-06 | 34 |
| GO:00509006 | Breast | Precancer | leukocyte migration | 47/1080 | 369/18723 | 2.82e-07 | 1.39e-05 | 47 |
| GO:00305956 | Breast | Precancer | leukocyte chemotaxis | 34/1080 | 230/18723 | 4.16e-07 | 1.89e-05 | 34 |
| GO:00603266 | Breast | Precancer | cell chemotaxis | 41/1080 | 310/18723 | 5.99e-07 | 2.55e-05 | 41 |
| GO:00716217 | Breast | Precancer | granulocyte chemotaxis | 23/1080 | 125/18723 | 6.73e-07 | 2.77e-05 | 23 |
| GO:00975307 | Breast | Precancer | granulocyte migration | 24/1080 | 148/18723 | 4.04e-06 | 1.26e-04 | 24 |
| GO:00022378 | Breast | Precancer | response to molecule of bacterial origin | 43/1080 | 363/18723 | 6.05e-06 | 1.72e-04 | 43 |
| GO:00324968 | Breast | Precancer | response to lipopolysaccharide | 41/1080 | 343/18723 | 7.94e-06 | 2.17e-04 | 41 |
| GO:00321034 | Breast | Precancer | positive regulation of response to external stimulus | 46/1080 | 427/18723 | 3.41e-05 | 7.40e-04 | 46 |
| GO:00026856 | Breast | Precancer | regulation of leukocyte migration | 27/1080 | 210/18723 | 7.93e-05 | 1.54e-03 | 27 |
| GO:00716744 | Breast | Precancer | mononuclear cell migration | 24/1080 | 196/18723 | 4.03e-04 | 5.44e-03 | 24 |
| GO:00026887 | Breast | Precancer | regulation of leukocyte chemotaxis | 17/1080 | 122/18723 | 6.34e-04 | 7.86e-03 | 17 |
| GO:00026877 | Breast | Precancer | positive regulation of leukocyte migration | 18/1080 | 135/18723 | 7.60e-04 | 9.04e-03 | 18 |
| GO:00716774 | Breast | Precancer | positive regulation of mononuclear cell migration | 11/1080 | 65/18723 | 1.13e-03 | 1.25e-02 | 11 |
| GO:00025483 | Breast | Precancer | monocyte chemotaxis | 11/1080 | 70/18723 | 2.11e-03 | 2.00e-02 | 11 |
| GO:00026905 | Breast | Precancer | positive regulation of leukocyte chemotaxis | 13/1080 | 94/18723 | 2.83e-03 | 2.49e-02 | 13 |
| GO:00509212 | Breast | Precancer | positive regulation of chemotaxis | 17/1080 | 141/18723 | 3.15e-03 | 2.65e-02 | 17 |
| GO:00716246 | Breast | Precancer | positive regulation of granulocyte chemotaxis | 6/1080 | 27/18723 | 3.78e-03 | 3.04e-02 | 6 |
| GO:00509201 | Breast | Precancer | regulation of chemotaxis | 23/1080 | 223/18723 | 5.05e-03 | 3.80e-02 | 23 |
| GO:0090025 | Breast | Precancer | regulation of monocyte chemotaxis | 6/1080 | 29/18723 | 5.49e-03 | 4.01e-02 | 6 |
| Page: 1 2 3 4 5 6 7 8 9 10 11 12 13 14 15 16 17 18 19 20 21 |
| Pathway ID | Tissue | Disease Stage | Description | Gene Ratio | Bg Ratio | pvalue | p.adjust | qvalue | Count |
| Page: 1 |
Top |
Cell-cell communication analysis |
| Identification of potential cell-cell interactions between two cell types and their ligand-receptor pairs for different disease states |
| Ligand | Receptor | LRpair | Pathway | Tissue | Disease Stage |
| Page: 1 |
Top |
Single-cell gene regulatory network inference analysis |
| Find out the significant the regulons (TFs) and the target genes of each regulon across cell types for different disease states |
| TF | Cell Type | Tissue | Disease Stage | Target Gene | RSS | Regulon Activity |
| ∗The dot plots of a searched regulon are shown for all cell subpopulations in each disease state of each tissue based on the regulon specific score inferred using pySCENIC and by calculating the average expression. |
| Page: 1 |
Top |
Somatic mutation of malignant transformation related genes |
| Annotation of somatic variants for genes involved in malignant transformation |
| Hugo Symbol | Variant Class | Variant Classification | dbSNP RS | HGVSc | HGVSp | HGVSp Short | SWISSPROT | BIOTYPE | SIFT | PolyPhen | Tumor Sample Barcode | Tissue | Histology | Sex | Age | Stage | Therapy Types | Drugs | Outcome |
| S100A14 | SNV | Missense_Mutation | rs375384960 | c.140N>A | p.Arg47Gln | p.R47Q | Q9HCY8 | protein_coding | tolerated(0.63) | benign(0.001) | TCGA-EA-A410-01 | Cervix | cervical & endocervical cancer | Female | <65 | I/II | Unknown | Unknown | SD |
| S100A14 | SNV | Missense_Mutation | novel | c.69N>C | p.Glu23Asp | p.E23D | Q9HCY8 | protein_coding | tolerated(0.12) | probably_damaging(0.983) | TCGA-VS-A9UB-01 | Cervix | cervical & endocervical cancer | Female | <65 | I/II | Chemotherapy | cisplatin | CR |
| S100A14 | SNV | Missense_Mutation | c.20N>T | p.Ala7Val | p.A7V | Q9HCY8 | protein_coding | deleterious(0.03) | benign(0.2) | TCGA-A6-6653-01 | Colorectum | colon adenocarcinoma | Male | >=65 | I/II | Unknown | Unknown | SD | |
| S100A14 | SNV | Missense_Mutation | c.81G>T | p.Lys27Asn | p.K27N | Q9HCY8 | protein_coding | tolerated(0.58) | benign(0.218) | TCGA-B5-A0JY-01 | Endometrium | uterine corpus endometrioid carcinoma | Female | <65 | III/IV | Chemotherapy | doxorubicin | SD | |
| S100A14 | SNV | Missense_Mutation | rs770628756 | c.25G>A | p.Ala9Thr | p.A9T | Q9HCY8 | protein_coding | tolerated(0.3) | benign(0.003) | TCGA-B5-A3FC-01 | Endometrium | uterine corpus endometrioid carcinoma | Female | <65 | I/II | Unknown | Unknown | SD |
| S100A14 | SNV | Missense_Mutation | novel | c.77N>C | p.Ile26Thr | p.I26T | Q9HCY8 | protein_coding | tolerated(0.13) | probably_damaging(0.987) | TCGA-E6-A1LX-01 | Endometrium | uterine corpus endometrioid carcinoma | Female | <65 | I/II | Unknown | Unknown | SD |
| S100A14 | SNV | Missense_Mutation | novel | c.41N>G | p.Glu14Gly | p.E14G | Q9HCY8 | protein_coding | deleterious(0.02) | benign(0.034) | TCGA-EO-A22R-01 | Endometrium | uterine corpus endometrioid carcinoma | Female | <65 | I/II | Unknown | Unknown | SD |
| S100A14 | SNV | Missense_Mutation | novel | c.78N>G | p.Ile26Met | p.I26M | Q9HCY8 | protein_coding | deleterious(0) | probably_damaging(0.995) | TCGA-CV-6961-01 | Oral cavity | head & neck squamous cell carcinoma | Male | <65 | I/II | Unknown | Unknown | PD |
| S100A14 | deletion | Frame_Shift_Del | novel | c.168delN | p.Leu57SerfsTer31 | p.L57Sfs*31 | Q9HCY8 | protein_coding | TCGA-BA-A4II-01 | Oral cavity | head & neck squamous cell carcinoma | Male | <65 | I/II | Unknown | Unknown | PD | ||
| S100A14 | SNV | Missense_Mutation | c.14N>T | p.Arg5Leu | p.R5L | Q9HCY8 | protein_coding | tolerated(0.68) | benign(0.019) | TCGA-G9-6351-01 | Prostate | prostate adenocarcinoma | Male | <65 | 7 | Unknown | Unknown | SD |
| Page: 1 2 |
Top |
Related drugs of malignant transformation related genes |
| Identification of chemicals and drugs interact with genes involved in malignant transfromation |
| (DGIdb 4.0) |
| Entrez ID | Symbol | Category | Interaction Types | Drug Claim Name | Drug Name | PMIDs |
| Page: 1 |

Copyright 2023-Present -The University of Texas Health Science Center at Houston |