
|
|||||
|
 | |
| |
| |
| |
| |
| |
|
Gene: S100A11 |
Gene summary for S100A11 |
| Gene information | Species | Human | Gene symbol | S100A11 | Gene ID | 6282 |
| Gene name | S100 calcium binding protein A11 | |
| Gene Alias | HEL-S-43 | |
| Cytomap | 1q21.3 | |
| Gene Type | protein-coding | GO ID | GO:0006260 | UniProtAcc | P31949 |
Top |
Malignant transformation analysis |
| Identification of the aberrant gene expression in precancerous and cancerous lesions by comparing the gene expression of stem-like cells in diseased tissues with normal stem cells |
| Entrez ID | Symbol | Replicates | Species | Organ | Tissue | Adj P-value | Log2FC | Malignancy |
| 6282 | S100A11 | GSM4909281 | Human | Breast | IDC | 2.27e-03 | 2.07e-01 | 0.21 |
| 6282 | S100A11 | GSM4909282 | Human | Breast | IDC | 4.31e-41 | 4.57e-01 | -0.0288 |
| 6282 | S100A11 | GSM4909285 | Human | Breast | IDC | 2.11e-68 | 5.92e-01 | 0.21 |
| 6282 | S100A11 | GSM4909286 | Human | Breast | IDC | 2.78e-44 | -6.93e-01 | 0.1081 |
| 6282 | S100A11 | GSM4909287 | Human | Breast | IDC | 3.47e-07 | 2.44e-01 | 0.2057 |
| 6282 | S100A11 | GSM4909293 | Human | Breast | IDC | 1.31e-09 | 2.63e-01 | 0.1581 |
| 6282 | S100A11 | GSM4909294 | Human | Breast | IDC | 3.79e-58 | 5.58e-01 | 0.2022 |
| 6282 | S100A11 | GSM4909297 | Human | Breast | IDC | 3.76e-09 | -4.59e-01 | 0.1517 |
| 6282 | S100A11 | GSM4909298 | Human | Breast | IDC | 2.47e-14 | -2.05e-01 | 0.1551 |
| 6282 | S100A11 | GSM4909301 | Human | Breast | IDC | 4.01e-32 | -8.08e-01 | 0.1577 |
| 6282 | S100A11 | GSM4909302 | Human | Breast | IDC | 2.89e-03 | 1.91e-01 | 0.1545 |
| 6282 | S100A11 | GSM4909304 | Human | Breast | IDC | 1.26e-07 | 2.24e-01 | 0.1636 |
| 6282 | S100A11 | GSM4909308 | Human | Breast | IDC | 1.34e-05 | -8.15e-02 | 0.158 |
| 6282 | S100A11 | GSM4909309 | Human | Breast | IDC | 3.69e-03 | 1.51e-01 | 0.0483 |
| 6282 | S100A11 | GSM4909311 | Human | Breast | IDC | 8.60e-21 | -2.62e-01 | 0.1534 |
| 6282 | S100A11 | GSM4909315 | Human | Breast | IDC | 5.35e-94 | 6.74e-01 | 0.21 |
| 6282 | S100A11 | GSM4909316 | Human | Breast | IDC | 2.97e-34 | 5.91e-01 | 0.21 |
| 6282 | S100A11 | GSM4909317 | Human | Breast | IDC | 5.47e-07 | 2.82e-01 | 0.1355 |
| 6282 | S100A11 | GSM4909319 | Human | Breast | IDC | 1.14e-46 | -7.63e-01 | 0.1563 |
| 6282 | S100A11 | brca1 | Human | Breast | Precancer | 4.93e-138 | 7.81e-01 | -0.0338 |
| Page: 1 2 3 4 5 6 7 8 9 10 11 12 13 14 15 16 17 18 19 |
| Tissue | Expression Dynamics | Abbreviation |
| Breast | 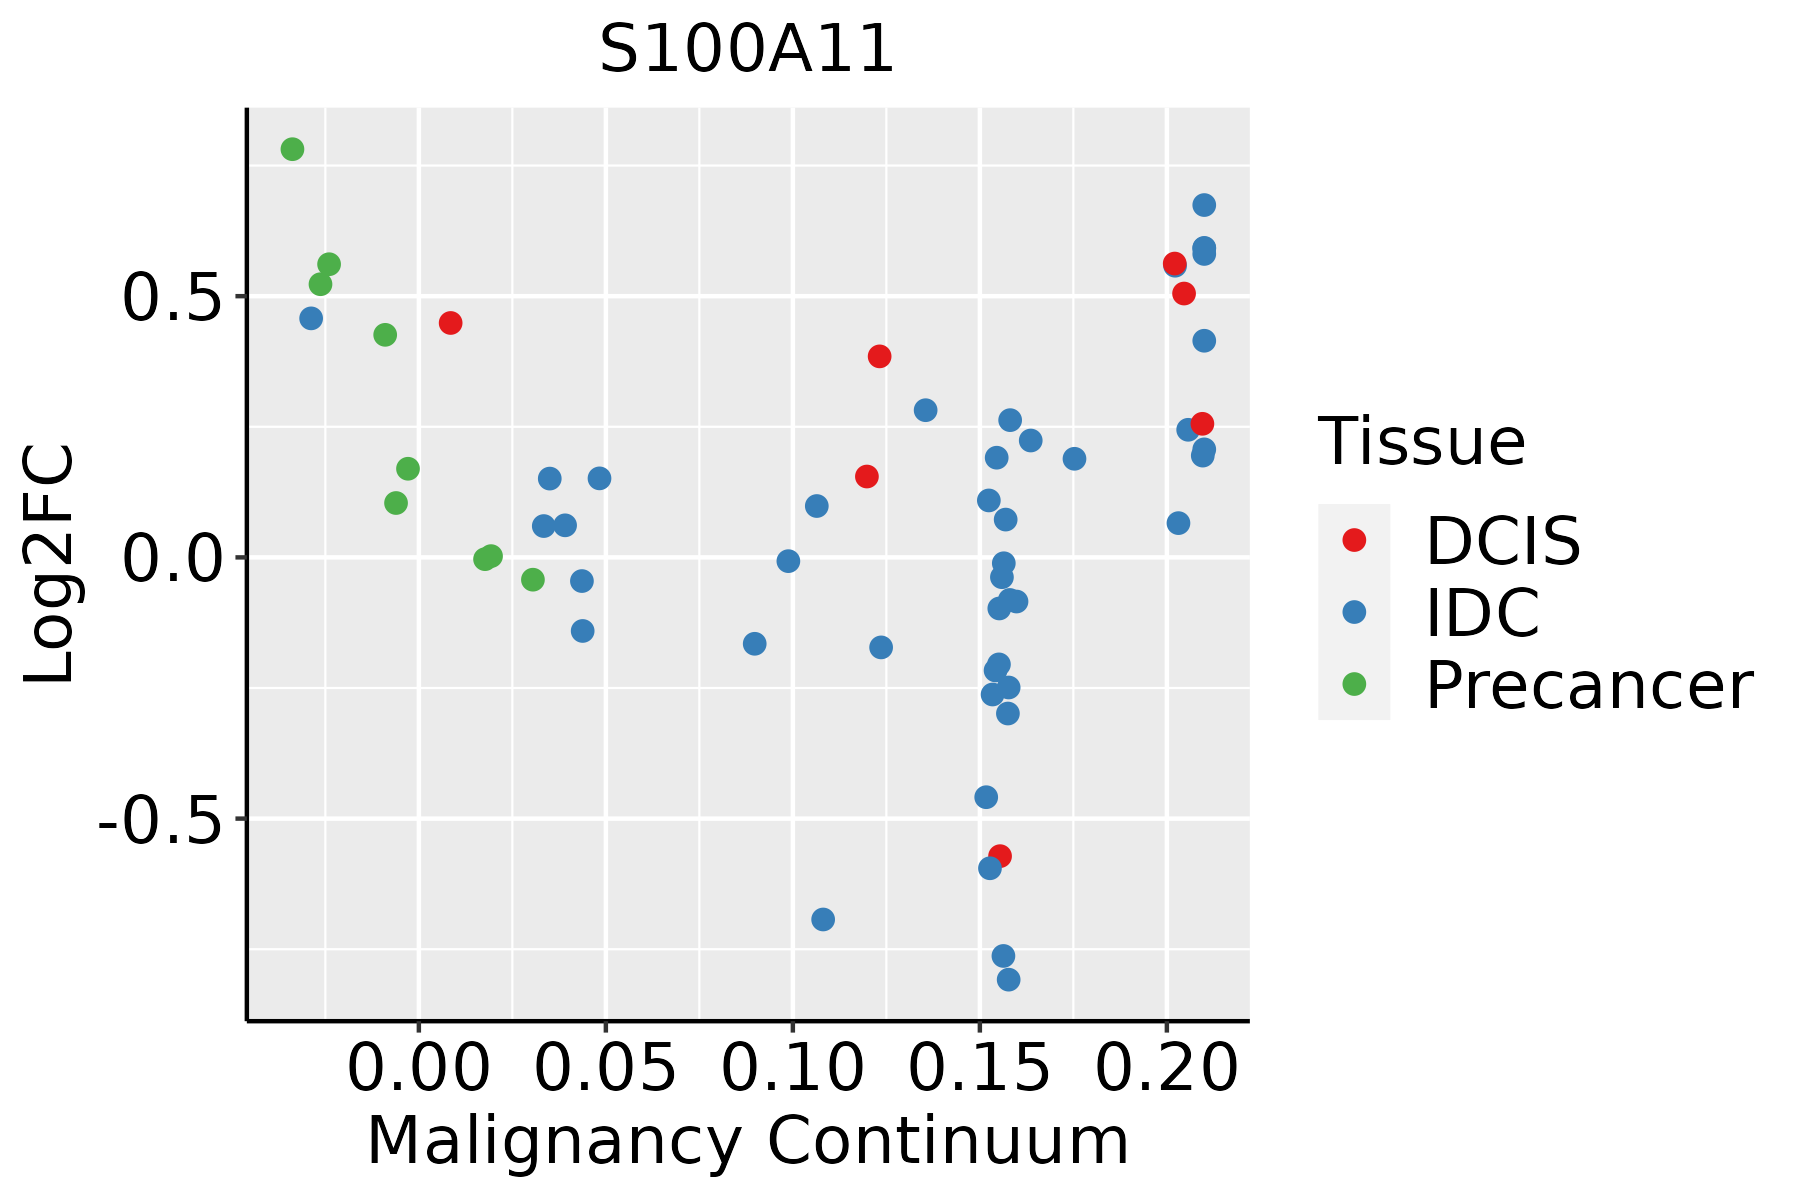 | IDC: Invasive ductal carcinoma |
| DCIS: Ductal carcinoma in situ | ||
| Precancer(BRCA1-mut): Precancerous lesion from BRCA1 mutation carriers | ||
| Cervix | 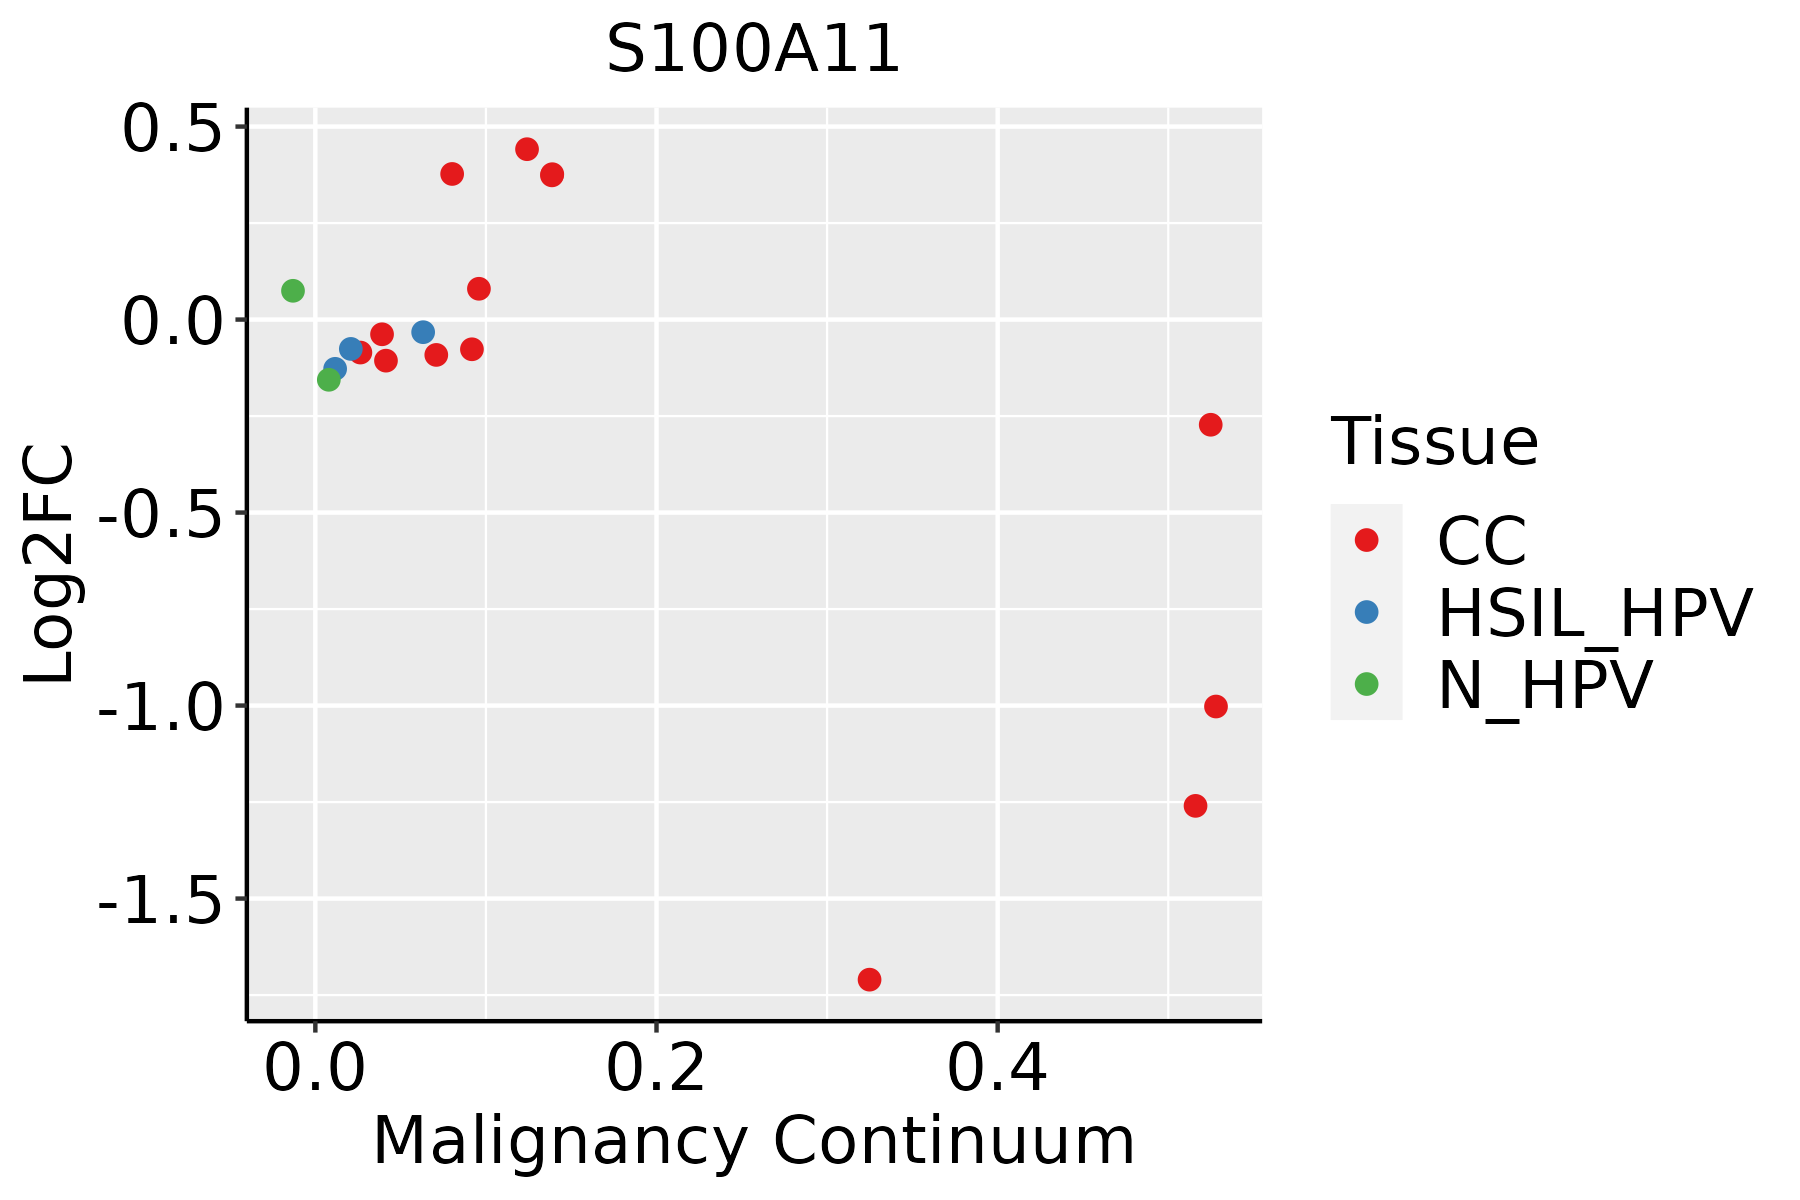 | CC: Cervix cancer |
| HSIL_HPV: HPV-infected high-grade squamous intraepithelial lesions | ||
| N_HPV: HPV-infected normal cervix | ||
| Colorectum (GSE201348) |  | FAP: Familial adenomatous polyposis |
| CRC: Colorectal cancer | ||
| Colorectum (HTA11) | 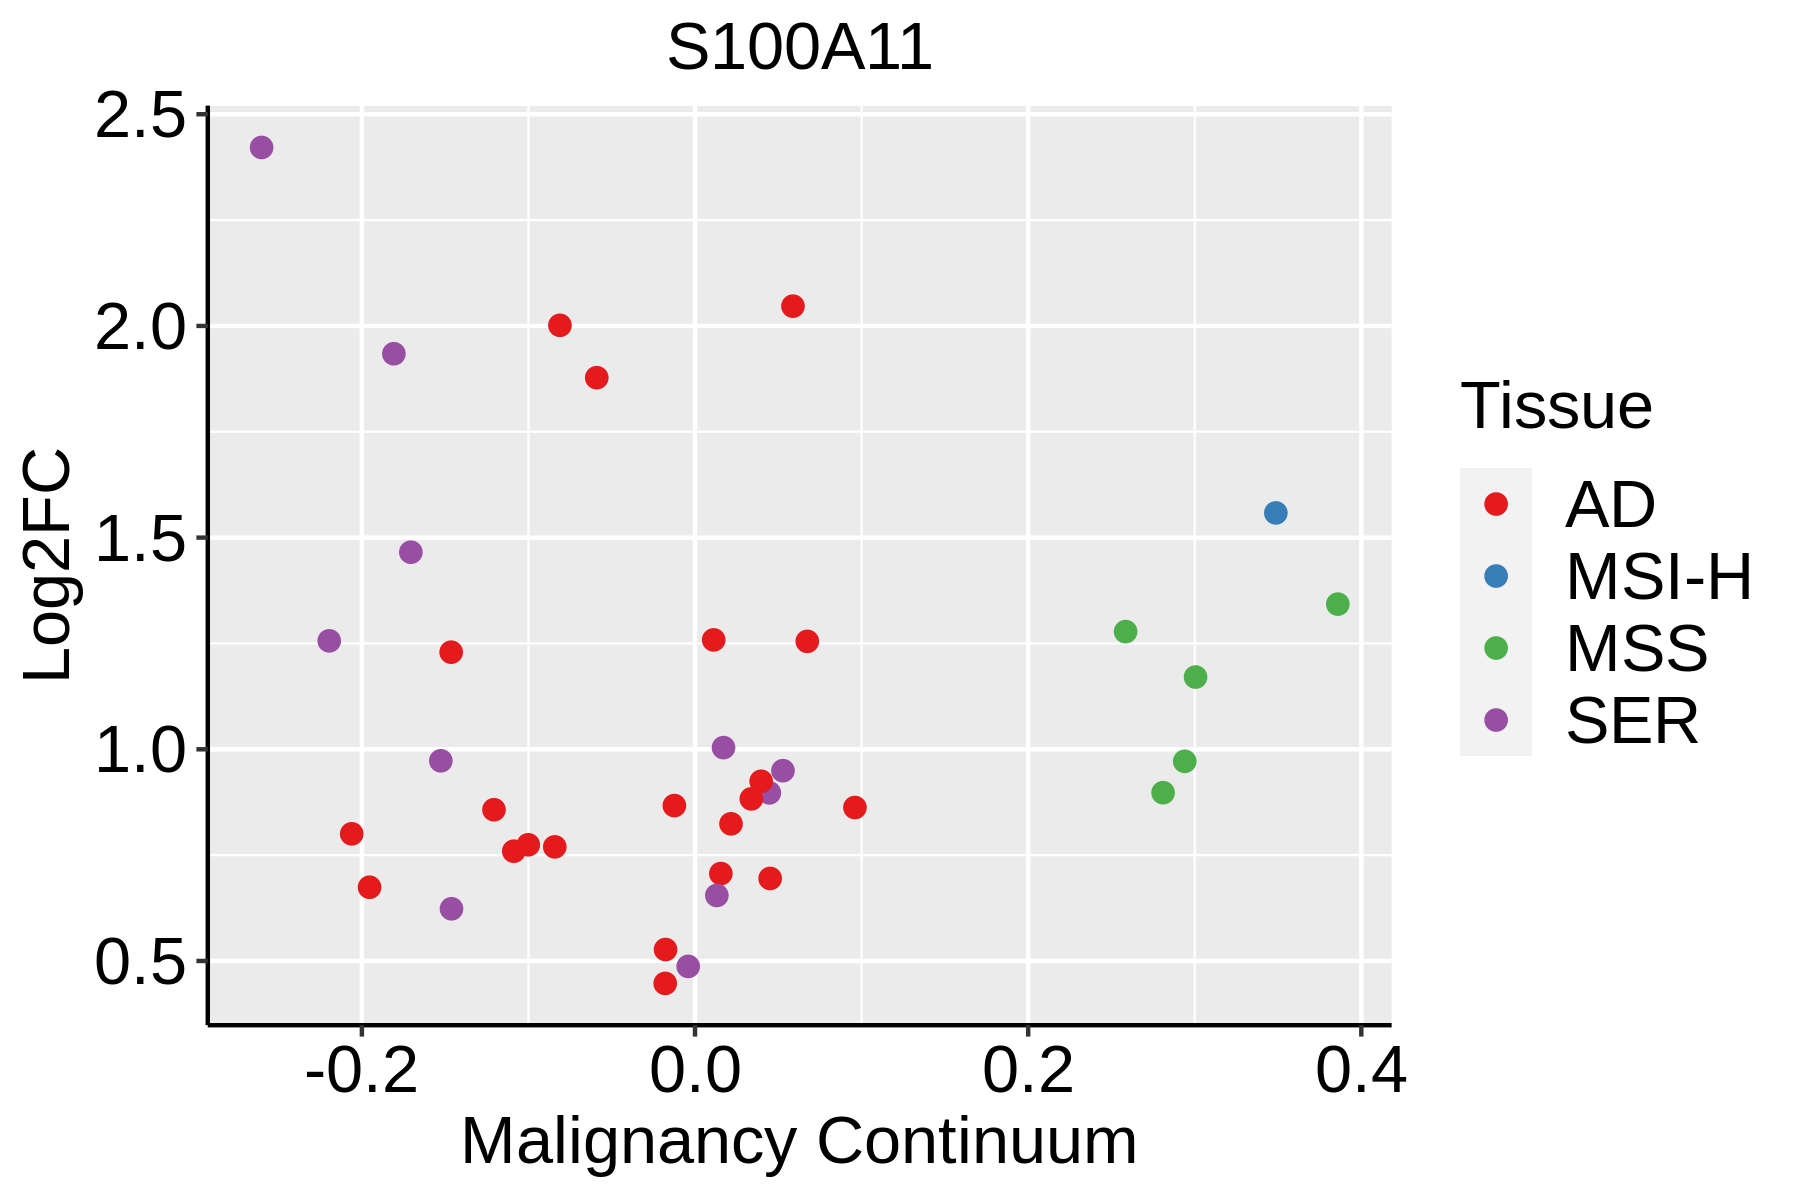 | AD: Adenomas |
| SER: Sessile serrated lesions | ||
| MSI-H: Microsatellite-high colorectal cancer | ||
| MSS: Microsatellite stable colorectal cancer | ||
| Endometrium | 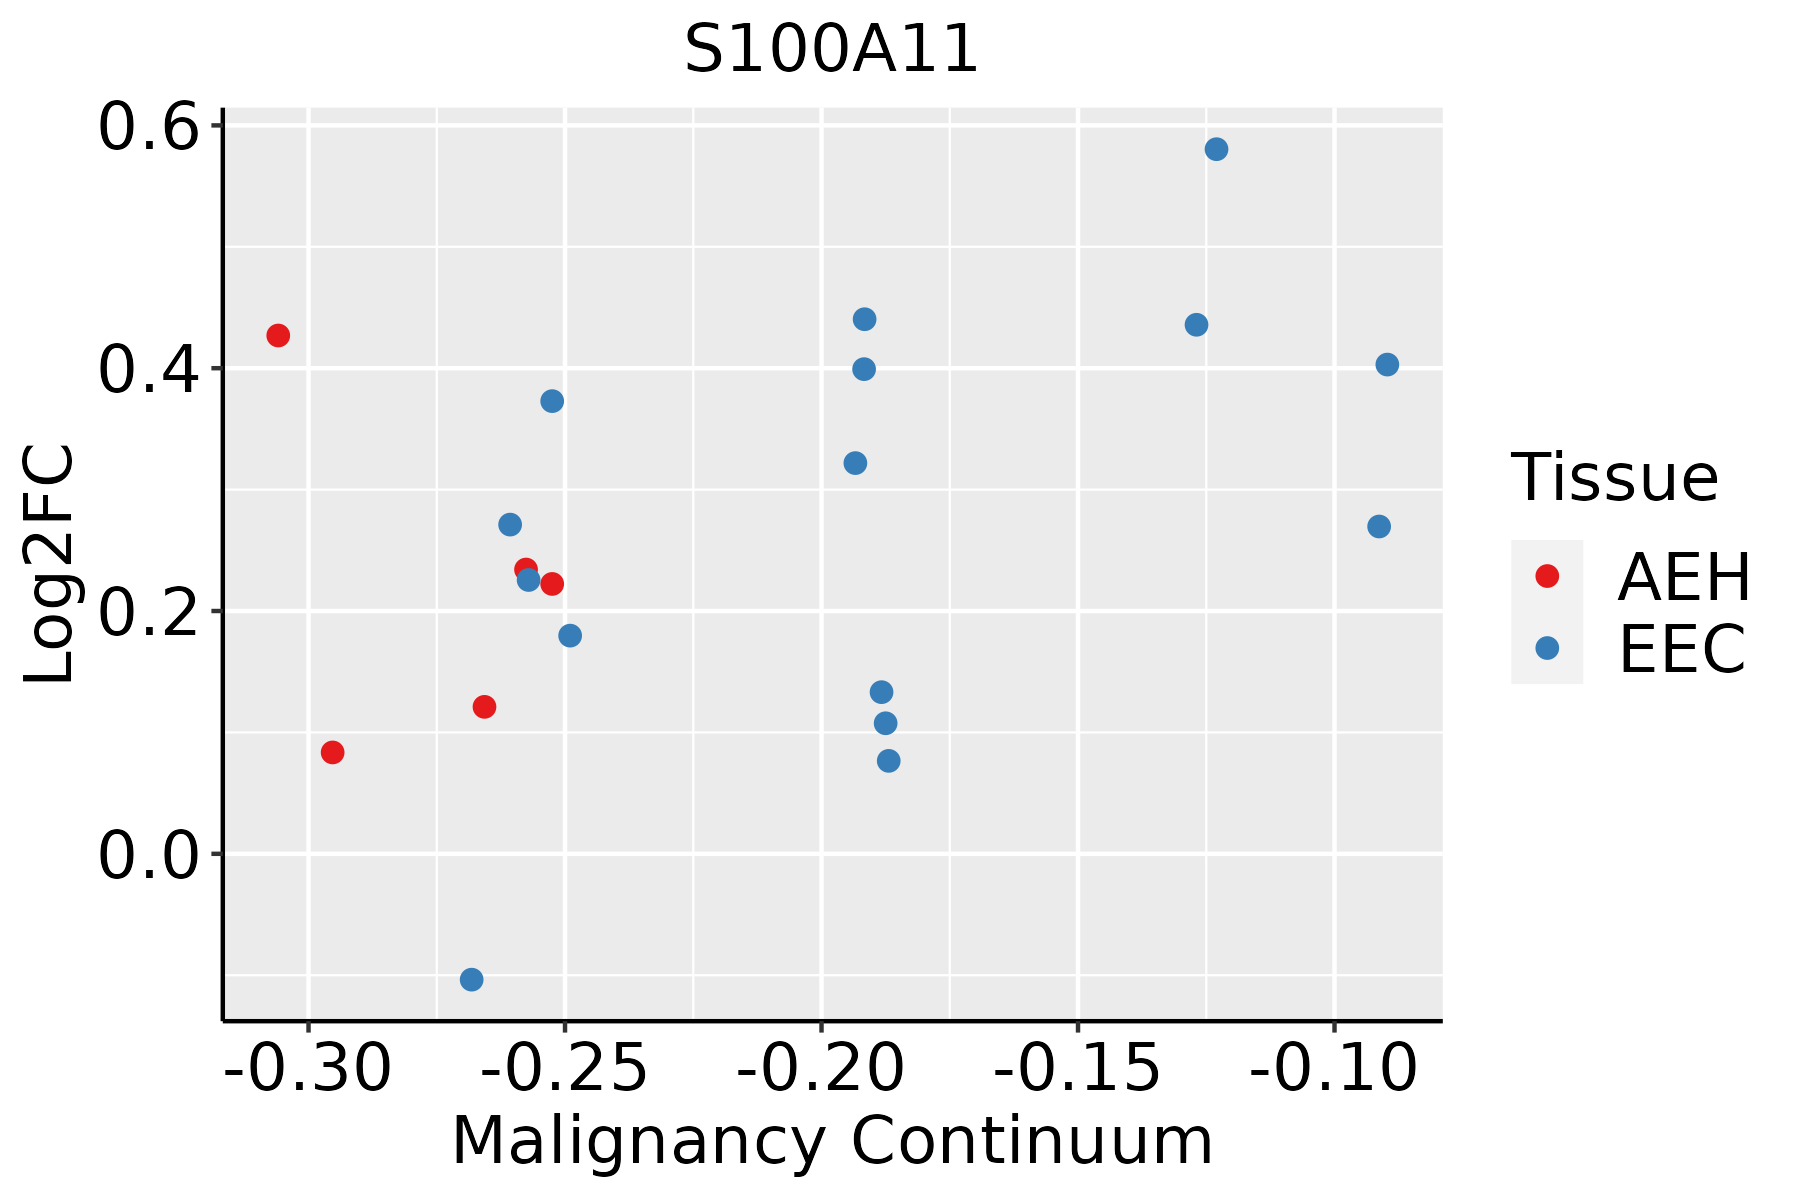 | AEH: Atypical endometrial hyperplasia |
| EEC: Endometrioid Cancer | ||
| Esophagus | 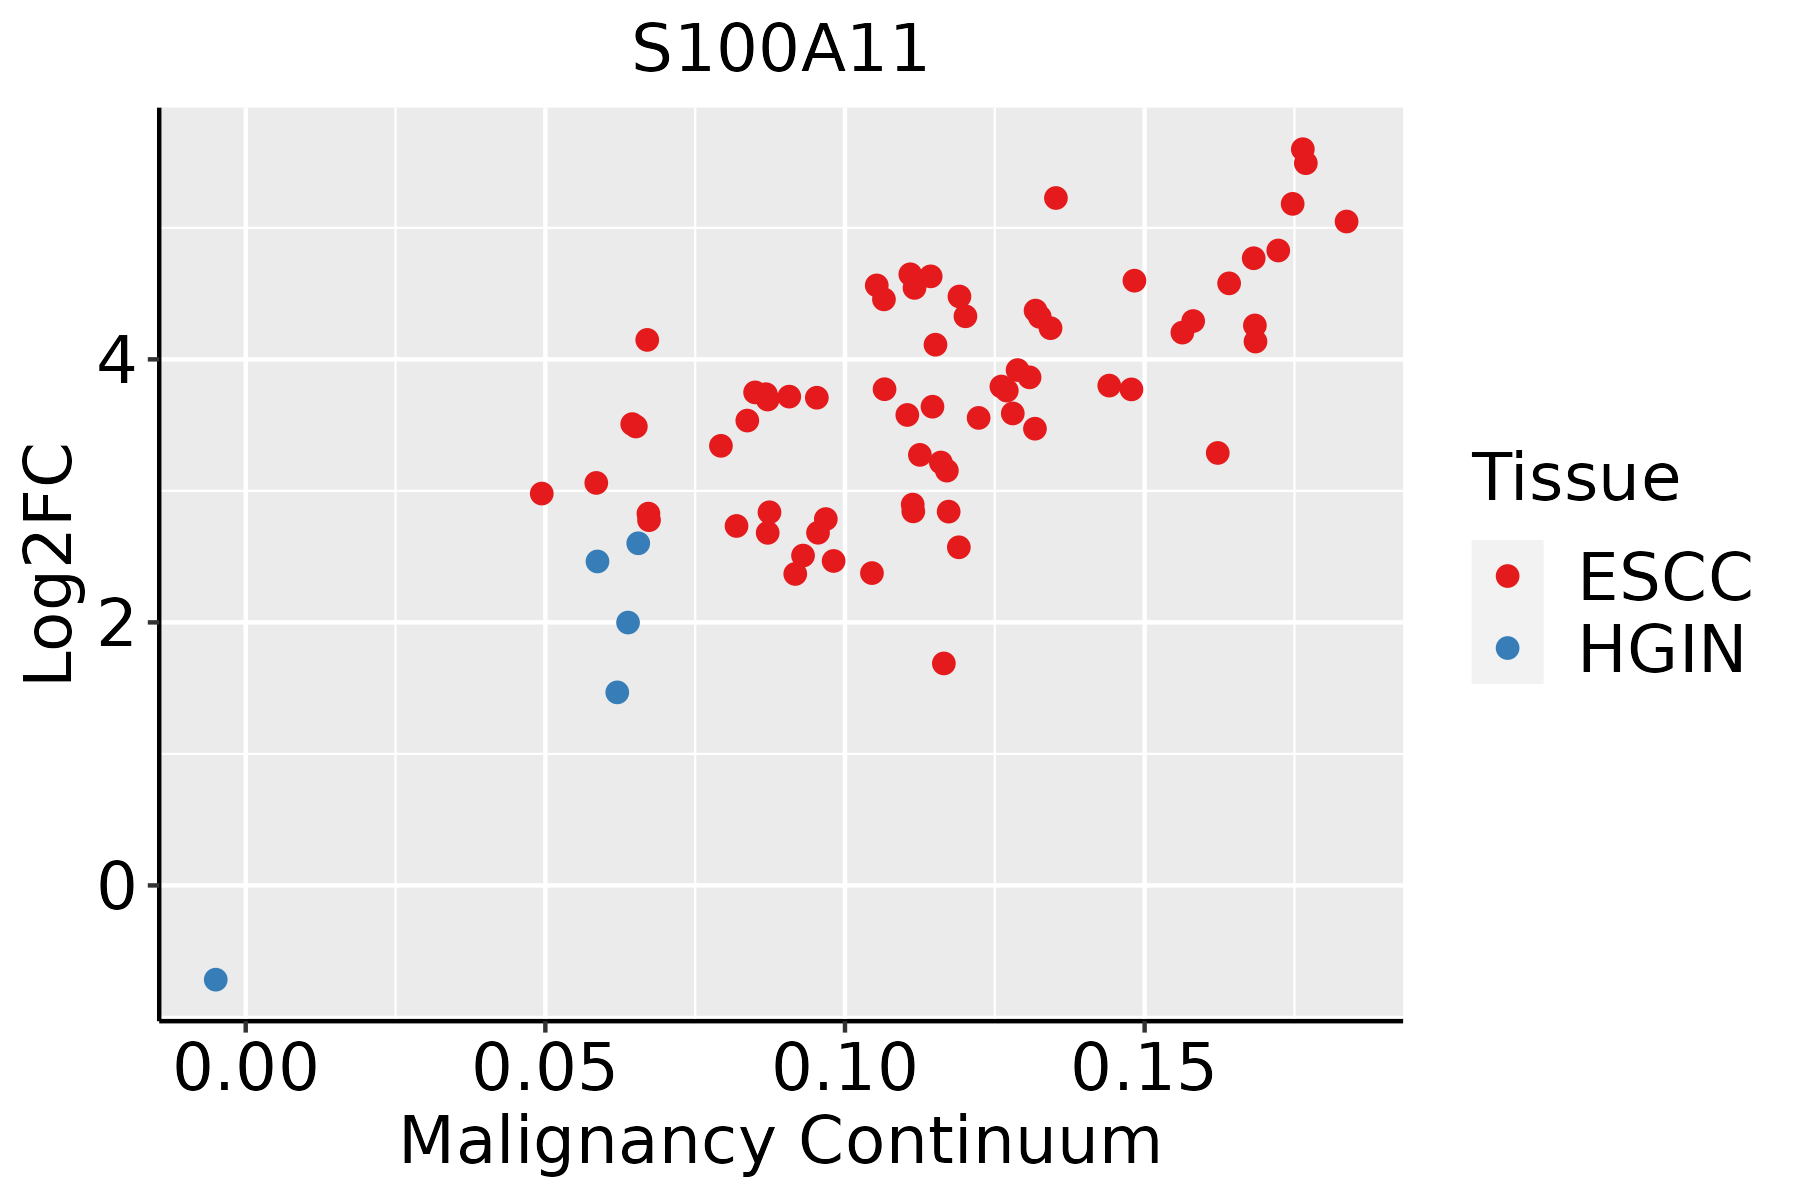 | ESCC: Esophageal squamous cell carcinoma |
| HGIN: High-grade intraepithelial neoplasias | ||
| LGIN: Low-grade intraepithelial neoplasias | ||
| GC | 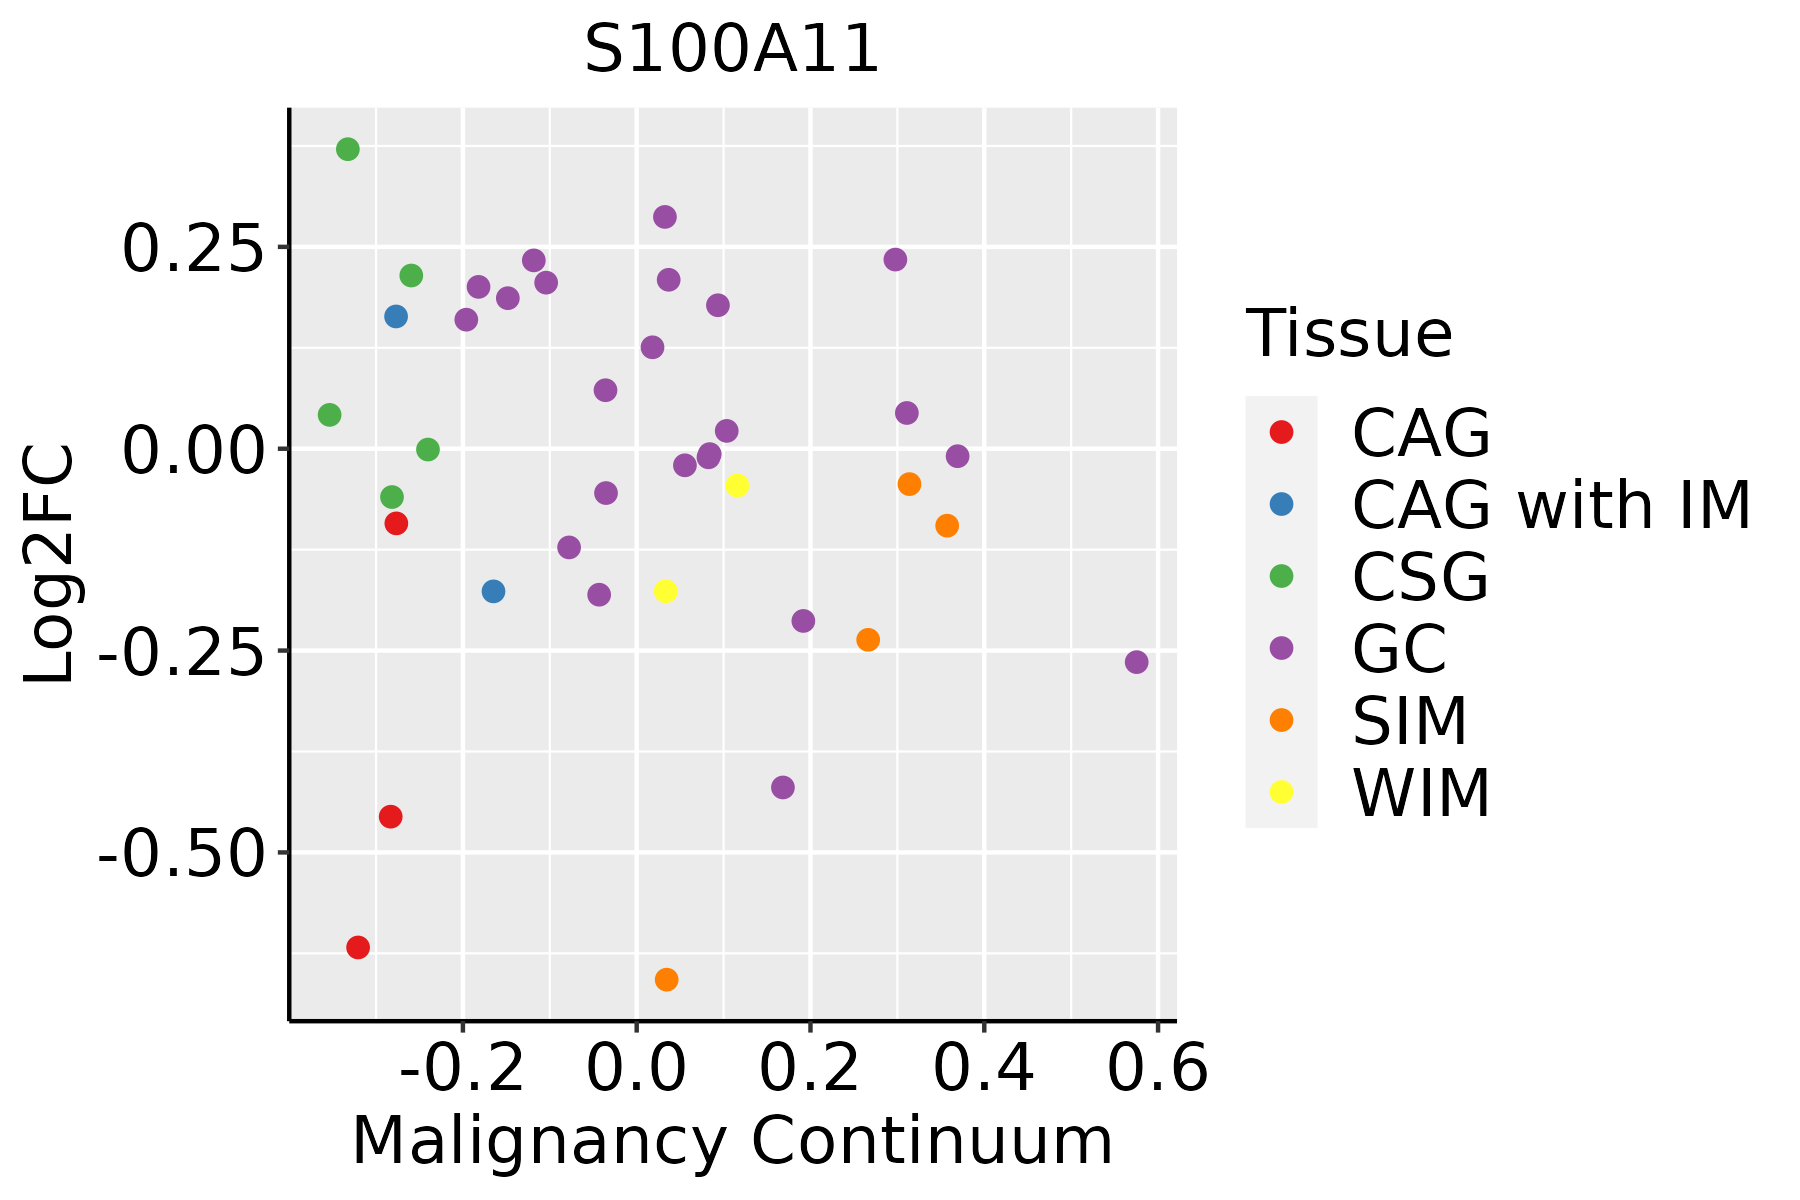 | CAG: Chronic atrophic gastritis |
| CAG with IM: Chronic atrophic gastritis with intestinal metaplasia | ||
| CSG: Chronic superficial gastritis | ||
| GC: Gastric cancer | ||
| SIM: Severe intestinal metaplasia | ||
| WIM: Wild intestinal metaplasia | ||
| Liver | 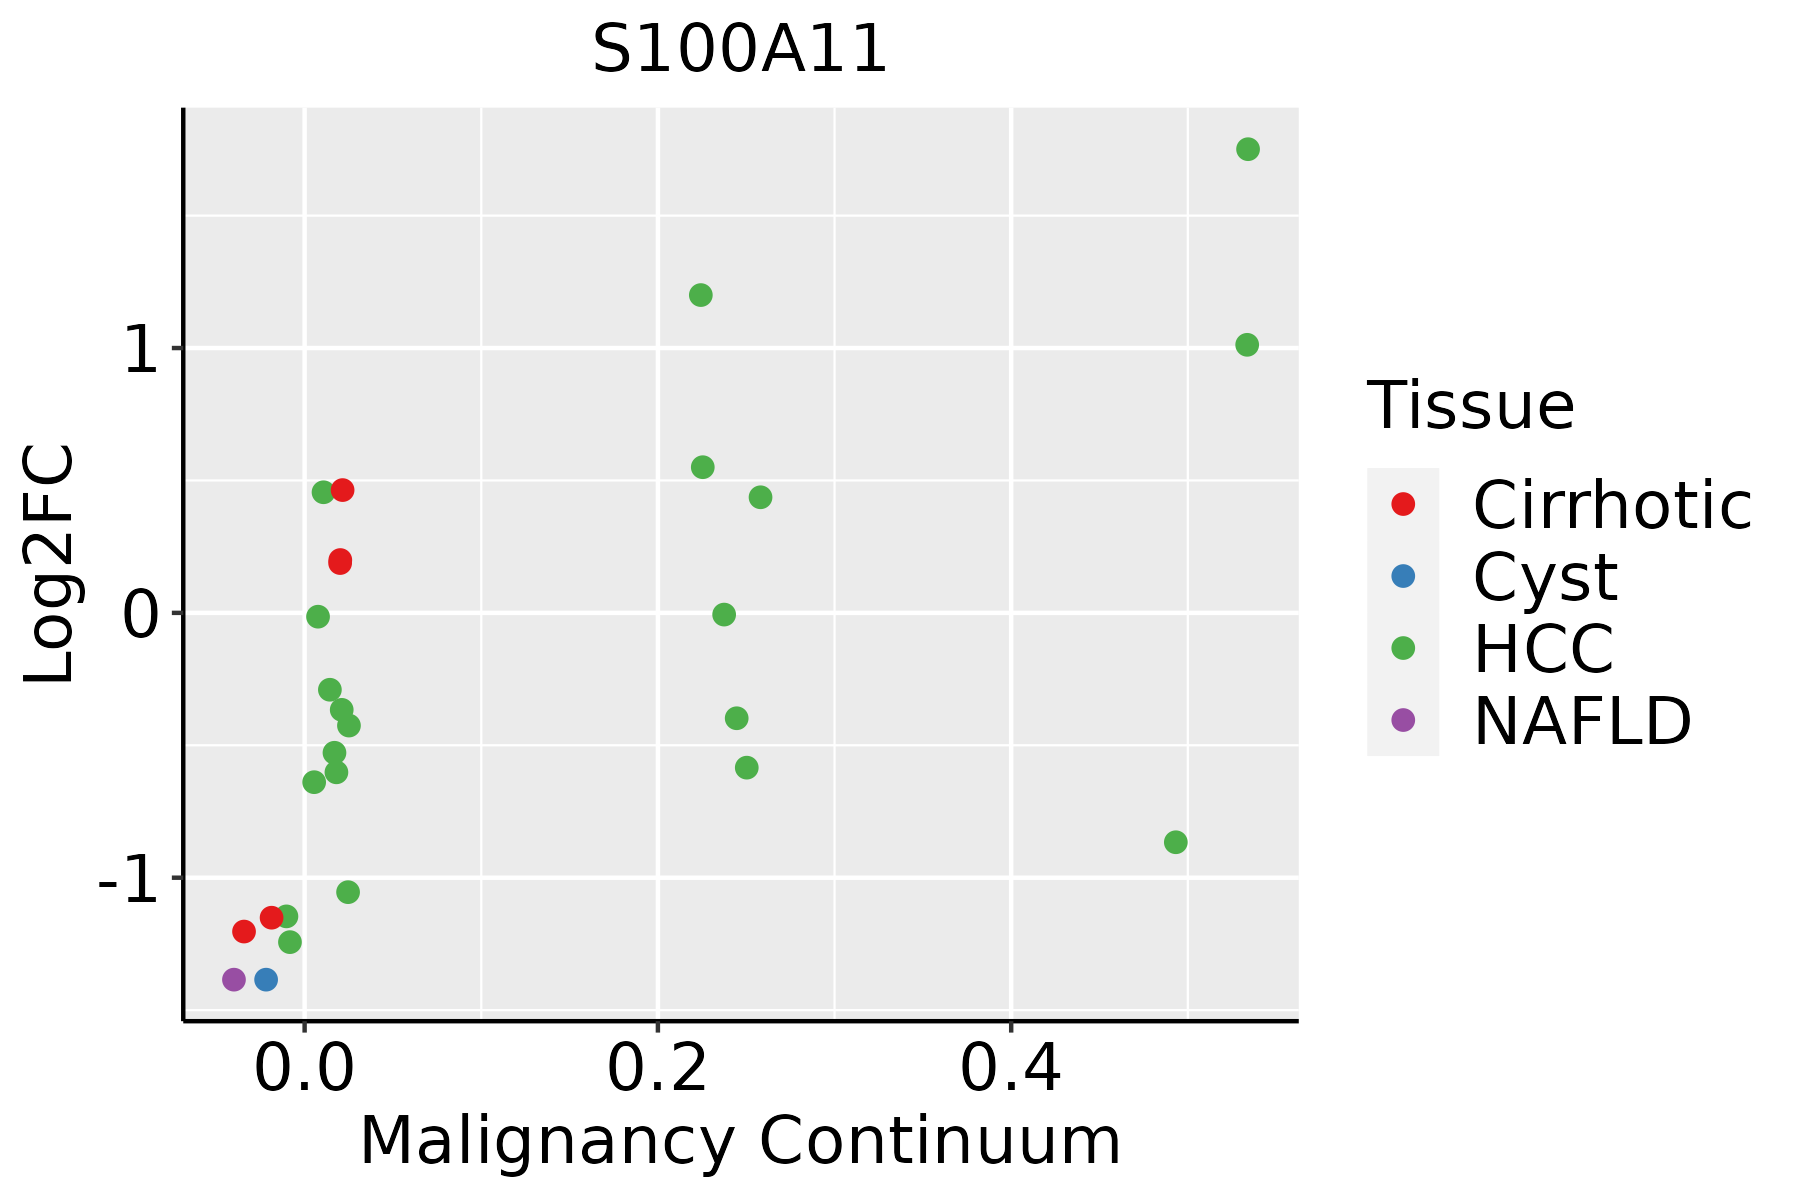 | HCC: Hepatocellular carcinoma |
| NAFLD: Non-alcoholic fatty liver disease | ||
| Lung |  | AAH: Atypical adenomatous hyperplasia |
| AIS: Adenocarcinoma in situ | ||
| IAC: Invasive lung adenocarcinoma | ||
| MIA: Minimally invasive adenocarcinoma | ||
| Oral Cavity | 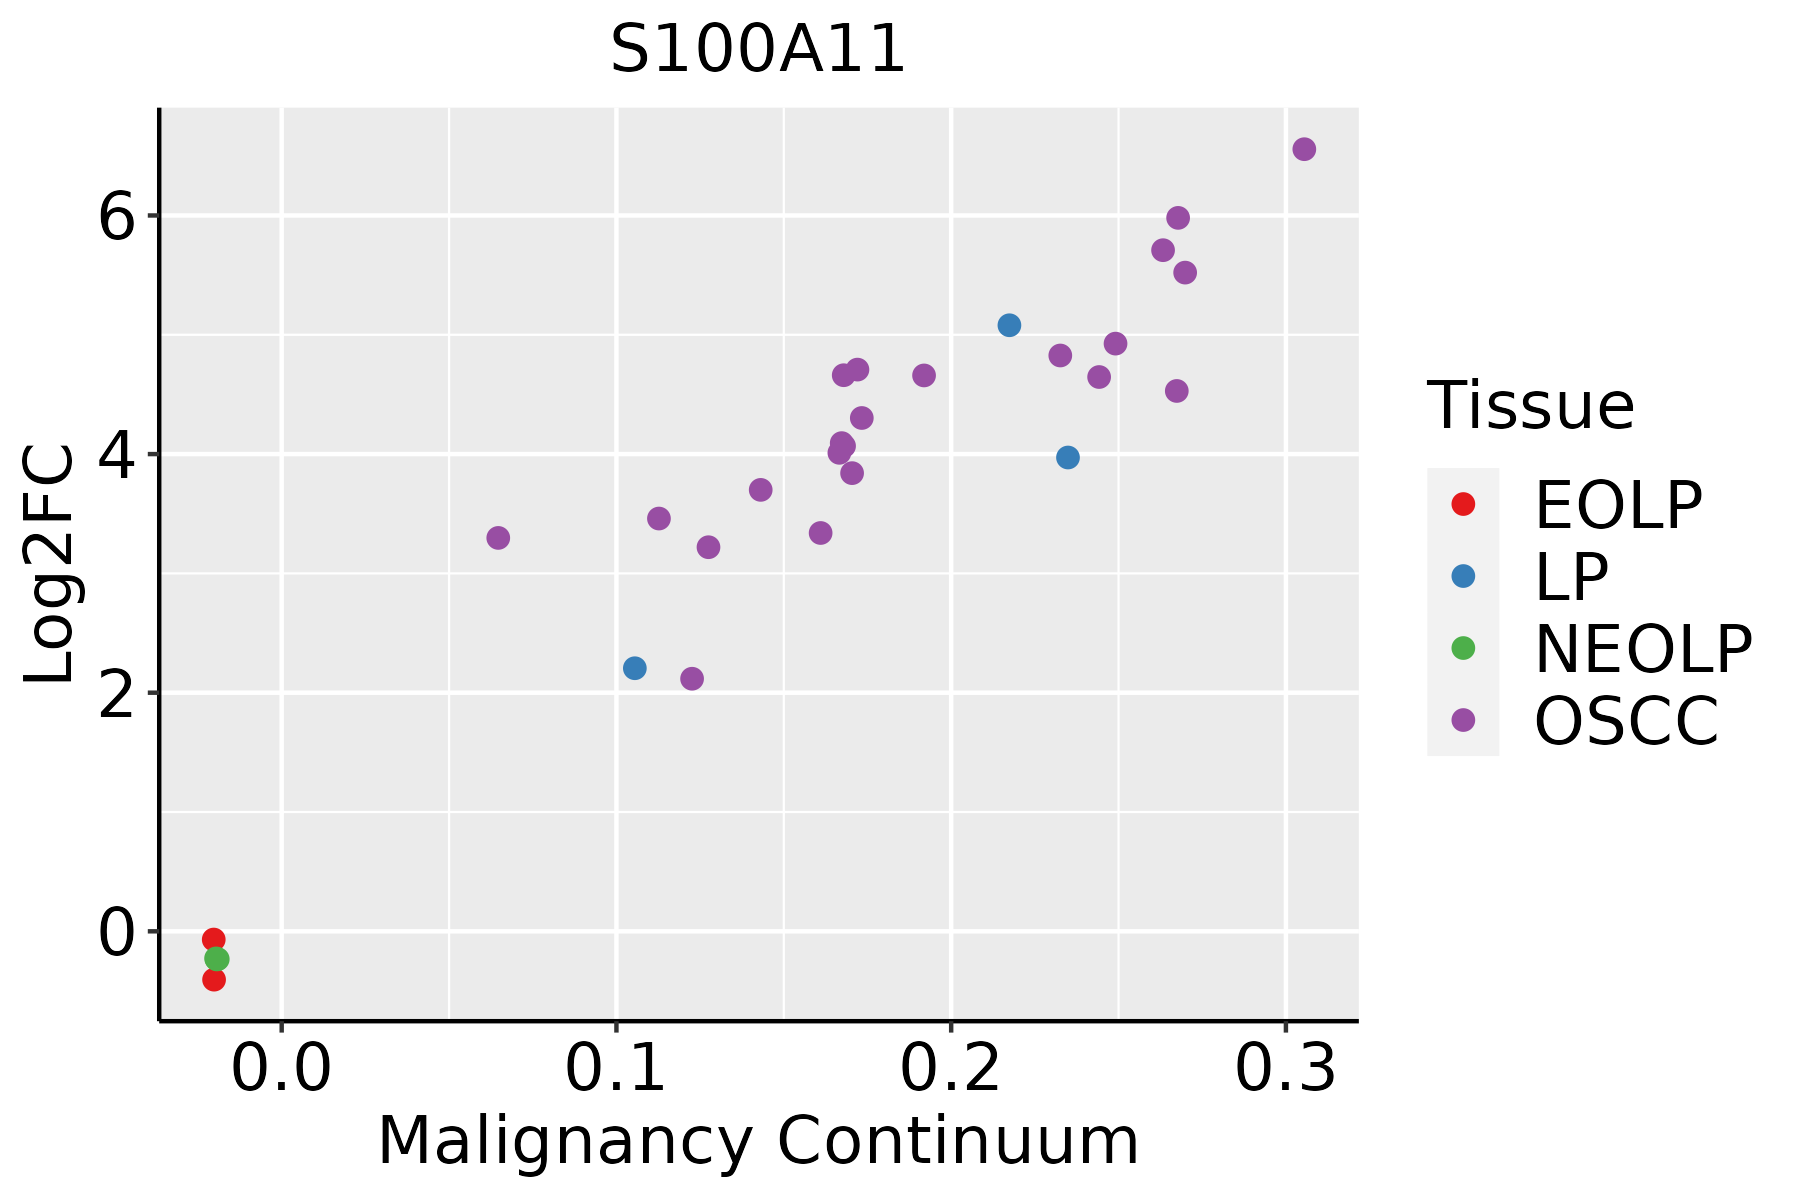 | EOLP: Erosive Oral lichen planus |
| LP: leukoplakia | ||
| NEOLP: Non-erosive oral lichen planus | ||
| OSCC: Oral squamous cell carcinoma | ||
| Prostate | 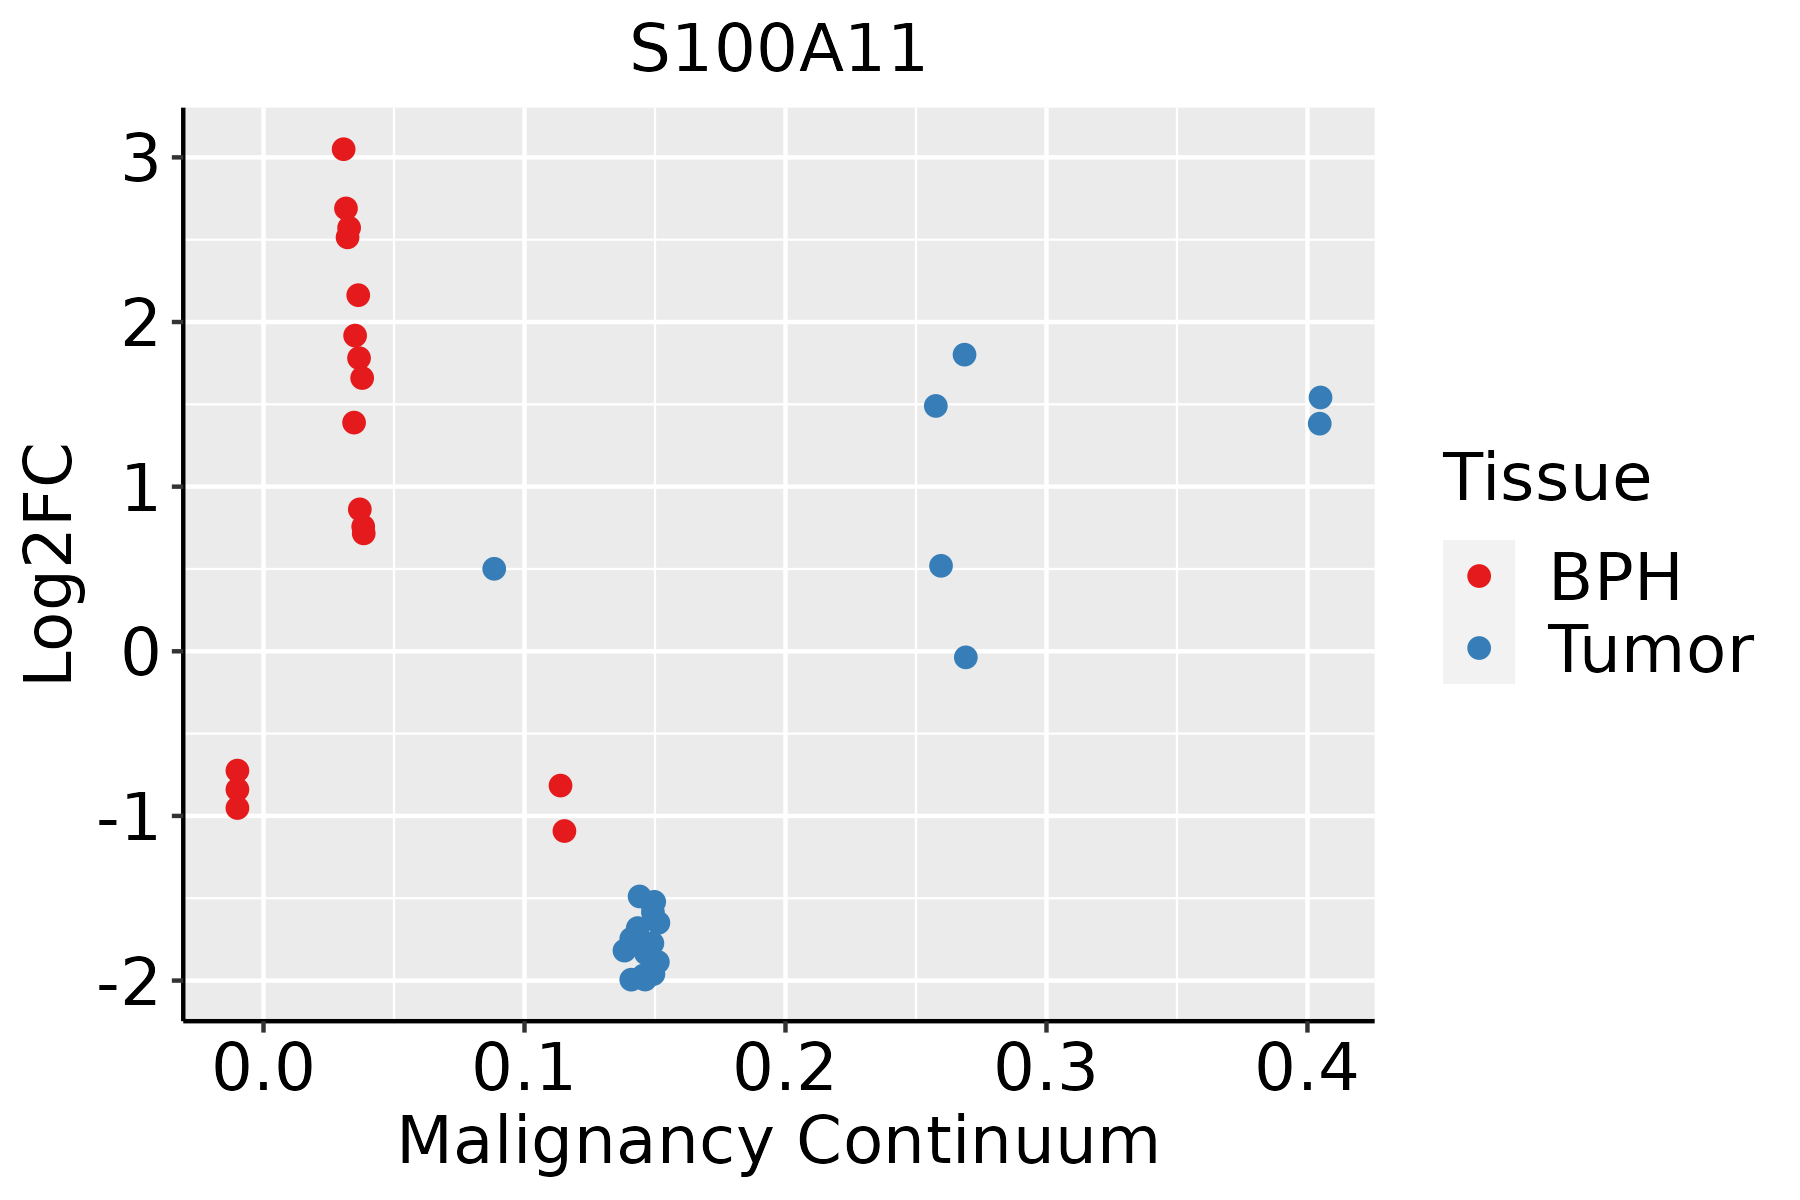 | BPH: Benign Prostatic Hyperplasia |
| Skin |  | AK: Actinic keratosis |
| cSCC: Cutaneous squamous cell carcinoma | ||
| SCCIS:squamous cell carcinoma in situ | ||
| Thyroid | 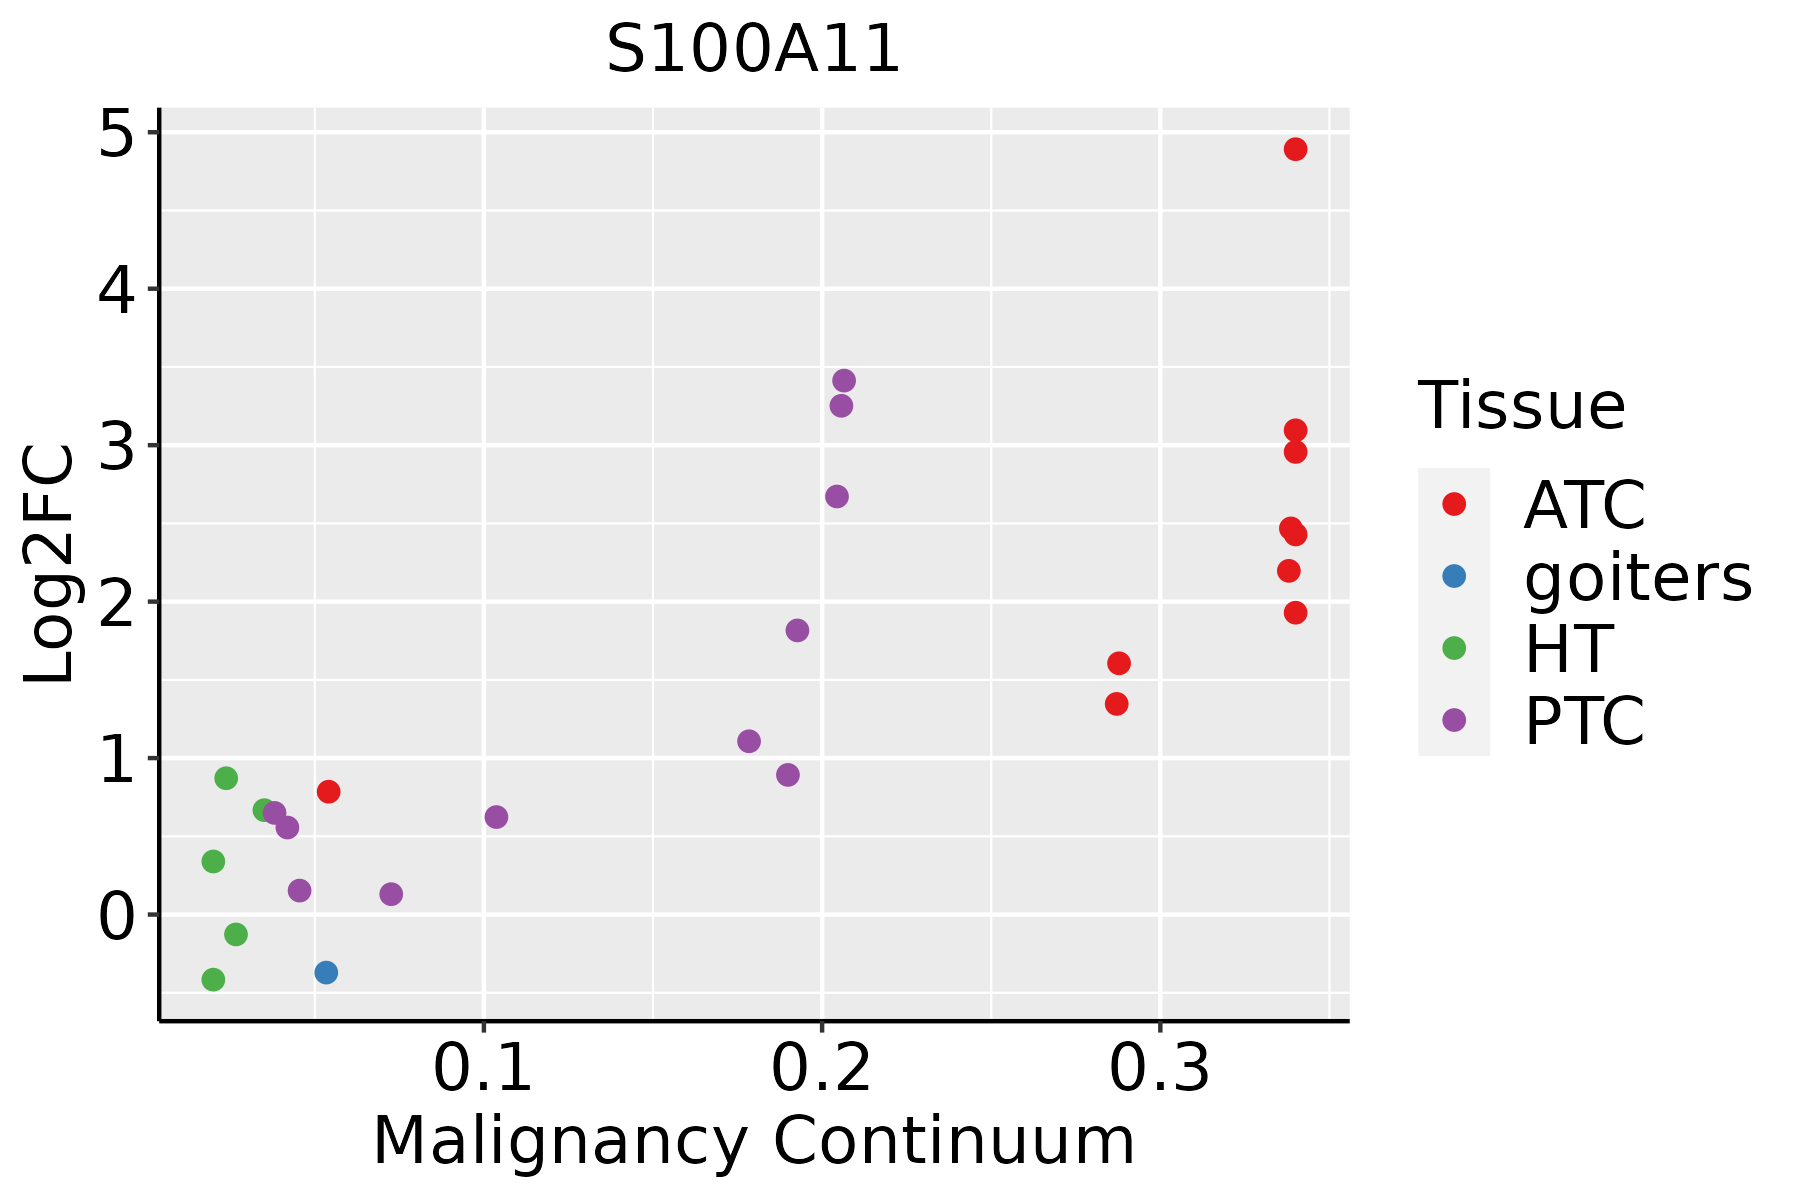 | ATC: Anaplastic thyroid cancer |
| HT: Hashimoto's thyroiditis | ||
| PTC: Papillary thyroid cancer |
| ∗log2FC in expression of this searched gene in stem-like cells from each diseased tissue sample relative to stem-like cells in normal samples in each tissue plotted against the malignancy continuum. Samples are colored based on if they are from different disease stage. |
Top |
Malignant transformation related pathway analysis |
| Find out the enriched GO biological processes and KEGG pathways involved in transition from healthy to precancer to cancer |
| Tissue | Disease Stage | Enriched GO biological Processes |
| Colorectum | AD |  |
| Colorectum | SER |  |
| Colorectum | MSS |  |
| Colorectum | MSI-H |  |
| Colorectum | FAP |  |
| ∗Top 15 enriched GO BP terms are showed in the bar plot of each disease state in each tissue. Each row represents a significant GO biological process which is colored according to the -log10(p.adjust). |
| Page: 1 2 3 4 5 6 7 8 9 |
| GO ID | Tissue | Disease Stage | Description | Gene Ratio | Bg Ratio | pvalue | p.adjust | Count |
| GO:00062602 | Cervix | CC | DNA replication | 48/2311 | 260/18723 | 2.70e-03 | 1.85e-02 | 48 |
| GO:0006260 | Colorectum | MSI-H | DNA replication | 31/1319 | 260/18723 | 2.83e-03 | 3.63e-02 | 31 |
| GO:0006275 | Colorectum | CRC | regulation of DNA replication | 21/2078 | 107/18723 | 6.56e-03 | 4.70e-02 | 21 |
| GO:00149103 | Endometrium | AEH | regulation of smooth muscle cell migration | 19/2100 | 89/18723 | 4.12e-03 | 2.73e-02 | 19 |
| GO:00149092 | Endometrium | AEH | smooth muscle cell migration | 20/2100 | 97/18723 | 5.00e-03 | 3.14e-02 | 20 |
| GO:00062752 | Endometrium | AEH | regulation of DNA replication | 21/2100 | 107/18723 | 7.38e-03 | 4.20e-02 | 21 |
| GO:000627511 | Endometrium | EEC | regulation of DNA replication | 22/2168 | 107/18723 | 5.09e-03 | 3.20e-02 | 22 |
| GO:001491011 | Endometrium | EEC | regulation of smooth muscle cell migration | 19/2168 | 89/18723 | 5.83e-03 | 3.49e-02 | 19 |
| GO:001490911 | Endometrium | EEC | smooth muscle cell migration | 20/2168 | 97/18723 | 7.11e-03 | 4.07e-02 | 20 |
| GO:00062604 | Esophagus | ESCC | DNA replication | 181/8552 | 260/18723 | 3.55e-15 | 2.05e-13 | 181 |
| GO:00062754 | Esophagus | ESCC | regulation of DNA replication | 73/8552 | 107/18723 | 1.97e-06 | 2.28e-05 | 73 |
| GO:0014911 | Liver | NAFLD | positive regulation of smooth muscle cell migration | 11/1882 | 47/18723 | 5.92e-03 | 4.47e-02 | 11 |
| GO:0014910 | Liver | NAFLD | regulation of smooth muscle cell migration | 17/1882 | 89/18723 | 6.91e-03 | 4.87e-02 | 17 |
| GO:00062601 | Liver | HCC | DNA replication | 146/7958 | 260/18723 | 5.68e-06 | 7.02e-05 | 146 |
| GO:00062751 | Liver | HCC | regulation of DNA replication | 60/7958 | 107/18723 | 3.15e-03 | 1.46e-02 | 60 |
| GO:00149102 | Lung | IAC | regulation of smooth muscle cell migration | 19/2061 | 89/18723 | 3.35e-03 | 2.87e-02 | 19 |
| GO:0014909 | Lung | IAC | smooth muscle cell migration | 20/2061 | 97/18723 | 4.05e-03 | 3.31e-02 | 20 |
| GO:00149091 | Lung | AIS | smooth muscle cell migration | 19/1849 | 97/18723 | 2.74e-03 | 2.75e-02 | 19 |
| GO:0014812 | Lung | AIS | muscle cell migration | 20/1849 | 110/18723 | 5.24e-03 | 4.49e-02 | 20 |
| GO:00149101 | Lung | AIS | regulation of smooth muscle cell migration | 17/1849 | 89/18723 | 5.80e-03 | 4.83e-02 | 17 |
| Page: 1 2 3 |
| Pathway ID | Tissue | Disease Stage | Description | Gene Ratio | Bg Ratio | pvalue | p.adjust | qvalue | Count |
| Page: 1 |
Top |
Cell-cell communication analysis |
| Identification of potential cell-cell interactions between two cell types and their ligand-receptor pairs for different disease states |
| Ligand | Receptor | LRpair | Pathway | Tissue | Disease Stage |
| Page: 1 |
Top |
Single-cell gene regulatory network inference analysis |
| Find out the significant the regulons (TFs) and the target genes of each regulon across cell types for different disease states |
| TF | Cell Type | Tissue | Disease Stage | Target Gene | RSS | Regulon Activity |
| ∗The dot plots of a searched regulon are shown for all cell subpopulations in each disease state of each tissue based on the regulon specific score inferred using pySCENIC and by calculating the average expression. |
| Page: 1 |
Top |
Somatic mutation of malignant transformation related genes |
| Annotation of somatic variants for genes involved in malignant transformation |
| Hugo Symbol | Variant Class | Variant Classification | dbSNP RS | HGVSc | HGVSp | HGVSp Short | SWISSPROT | BIOTYPE | SIFT | PolyPhen | Tumor Sample Barcode | Tissue | Histology | Sex | Age | Stage | Therapy Types | Drugs | Outcome |
| S100A11 | SNV | Missense_Mutation | c.211A>G | p.Ser71Gly | p.S71G | P31949 | protein_coding | tolerated(0.48) | benign(0.01) | TCGA-AD-5900-01 | Colorectum | colon adenocarcinoma | Male | >=65 | I/II | Unknown | Unknown | SD | |
| S100A11 | SNV | Missense_Mutation | novel | c.104N>T | p.Ser35Phe | p.S35F | P31949 | protein_coding | deleterious(0.01) | probably_damaging(0.93) | TCGA-A5-A0G2-01 | Endometrium | uterine corpus endometrioid carcinoma | Female | <65 | III/IV | Unknown | Unknown | SD |
| S100A11 | SNV | Missense_Mutation | c.74C>T | p.Ala25Val | p.A25V | P31949 | protein_coding | deleterious(0.02) | benign(0.194) | TCGA-AP-A051-01 | Endometrium | uterine corpus endometrioid carcinoma | Female | >=65 | I/II | Unknown | Unknown | SD | |
| S100A11 | SNV | Missense_Mutation | c.169N>T | p.Pro57Ser | p.P57S | P31949 | protein_coding | deleterious(0.01) | possibly_damaging(0.615) | TCGA-AX-A0J1-01 | Endometrium | uterine corpus endometrioid carcinoma | Female | >=65 | I/II | Unknown | Unknown | SD | |
| S100A11 | SNV | Missense_Mutation | novel | c.34C>T | p.Arg12Trp | p.R12W | P31949 | protein_coding | tolerated(0.16) | benign(0.003) | TCGA-AX-A1CE-01 | Endometrium | uterine corpus endometrioid carcinoma | Female | <65 | I/II | Unspecific | Paclitaxel | SD |
| S100A11 | SNV | Missense_Mutation | novel | c.59N>C | p.Val20Ala | p.V20A | P31949 | protein_coding | deleterious(0) | probably_damaging(0.915) | TCGA-B5-A3FA-01 | Endometrium | uterine corpus endometrioid carcinoma | Female | >=65 | I/II | Unknown | Unknown | SD |
| S100A11 | SNV | Missense_Mutation | c.8N>C | p.Lys3Thr | p.K3T | P31949 | protein_coding | deleterious_low_confidence(0) | benign(0.001) | TCGA-93-A4JQ-01 | Lung | lung adenocarcinoma | Male | <65 | I/II | Unknown | Unknown | SD | |
| S100A11 | SNV | Missense_Mutation | novel | c.178C>T | p.Leu60Phe | p.L60F | P31949 | protein_coding | tolerated(0.06) | benign(0.423) | TCGA-CV-7104-01 | Oral cavity | head & neck squamous cell carcinoma | Female | <65 | I/II | Unknown | Unknown | SD |
| Page: 1 |
Top |
Related drugs of malignant transformation related genes |
| Identification of chemicals and drugs interact with genes involved in malignant transfromation |
| (DGIdb 4.0) |
| Entrez ID | Symbol | Category | Interaction Types | Drug Claim Name | Drug Name | PMIDs |
| Page: 1 |

Copyright 2023-Present -The University of Texas Health Science Center at Houston |