
|
|||||
|
 | |
| |
| |
| |
| |
| |
|
Gene: S100A1 |
Gene summary for S100A1 |
| Gene information | Species | Human | Gene symbol | S100A1 | Gene ID | 6271 |
| Gene name | S100 calcium binding protein A1 | |
| Gene Alias | S100 | |
| Cytomap | 1q21.3 | |
| Gene Type | protein-coding | GO ID | GO:0000122 | UniProtAcc | A0A0S2Z4H2 |
Top |
Malignant transformation analysis |
| Identification of the aberrant gene expression in precancerous and cancerous lesions by comparing the gene expression of stem-like cells in diseased tissues with normal stem cells |
| Entrez ID | Symbol | Replicates | Species | Organ | Tissue | Adj P-value | Log2FC | Malignancy |
| 6271 | S100A1 | GSM4909281 | Human | Breast | IDC | 4.83e-13 | 5.49e-01 | 0.21 |
| 6271 | S100A1 | GSM4909282 | Human | Breast | IDC | 7.89e-10 | -4.04e-01 | -0.0288 |
| 6271 | S100A1 | GSM4909285 | Human | Breast | IDC | 7.27e-23 | 7.04e-01 | 0.21 |
| 6271 | S100A1 | GSM4909286 | Human | Breast | IDC | 4.99e-04 | 1.36e-01 | 0.1081 |
| 6271 | S100A1 | GSM4909287 | Human | Breast | IDC | 1.48e-34 | 8.57e-01 | 0.2057 |
| 6271 | S100A1 | GSM4909288 | Human | Breast | IDC | 4.16e-05 | 4.16e-01 | 0.0988 |
| 6271 | S100A1 | GSM4909290 | Human | Breast | IDC | 2.00e-14 | -5.19e-01 | 0.2096 |
| 6271 | S100A1 | GSM4909291 | Human | Breast | IDC | 1.04e-11 | -5.11e-01 | 0.1753 |
| 6271 | S100A1 | GSM4909293 | Human | Breast | IDC | 1.36e-12 | -4.50e-01 | 0.1581 |
| 6271 | S100A1 | GSM4909294 | Human | Breast | IDC | 1.10e-15 | -4.71e-01 | 0.2022 |
| 6271 | S100A1 | GSM4909296 | Human | Breast | IDC | 2.11e-14 | -3.24e-01 | 0.1524 |
| 6271 | S100A1 | GSM4909297 | Human | Breast | IDC | 8.78e-24 | -5.05e-01 | 0.1517 |
| 6271 | S100A1 | GSM4909301 | Human | Breast | IDC | 7.29e-29 | -5.50e-01 | 0.1577 |
| 6271 | S100A1 | GSM4909302 | Human | Breast | IDC | 8.39e-04 | -3.17e-01 | 0.1545 |
| 6271 | S100A1 | GSM4909304 | Human | Breast | IDC | 2.14e-19 | -4.84e-01 | 0.1636 |
| 6271 | S100A1 | GSM4909311 | Human | Breast | IDC | 8.60e-27 | 2.57e-02 | 0.1534 |
| 6271 | S100A1 | GSM4909312 | Human | Breast | IDC | 2.95e-05 | -4.19e-02 | 0.1552 |
| 6271 | S100A1 | GSM4909315 | Human | Breast | IDC | 2.35e-23 | -5.26e-01 | 0.21 |
| 6271 | S100A1 | GSM4909316 | Human | Breast | IDC | 1.98e-09 | -5.62e-01 | 0.21 |
| 6271 | S100A1 | GSM4909317 | Human | Breast | IDC | 2.78e-13 | -4.78e-01 | 0.1355 |
| Page: 1 2 3 |
| Tissue | Expression Dynamics | Abbreviation |
| Breast | 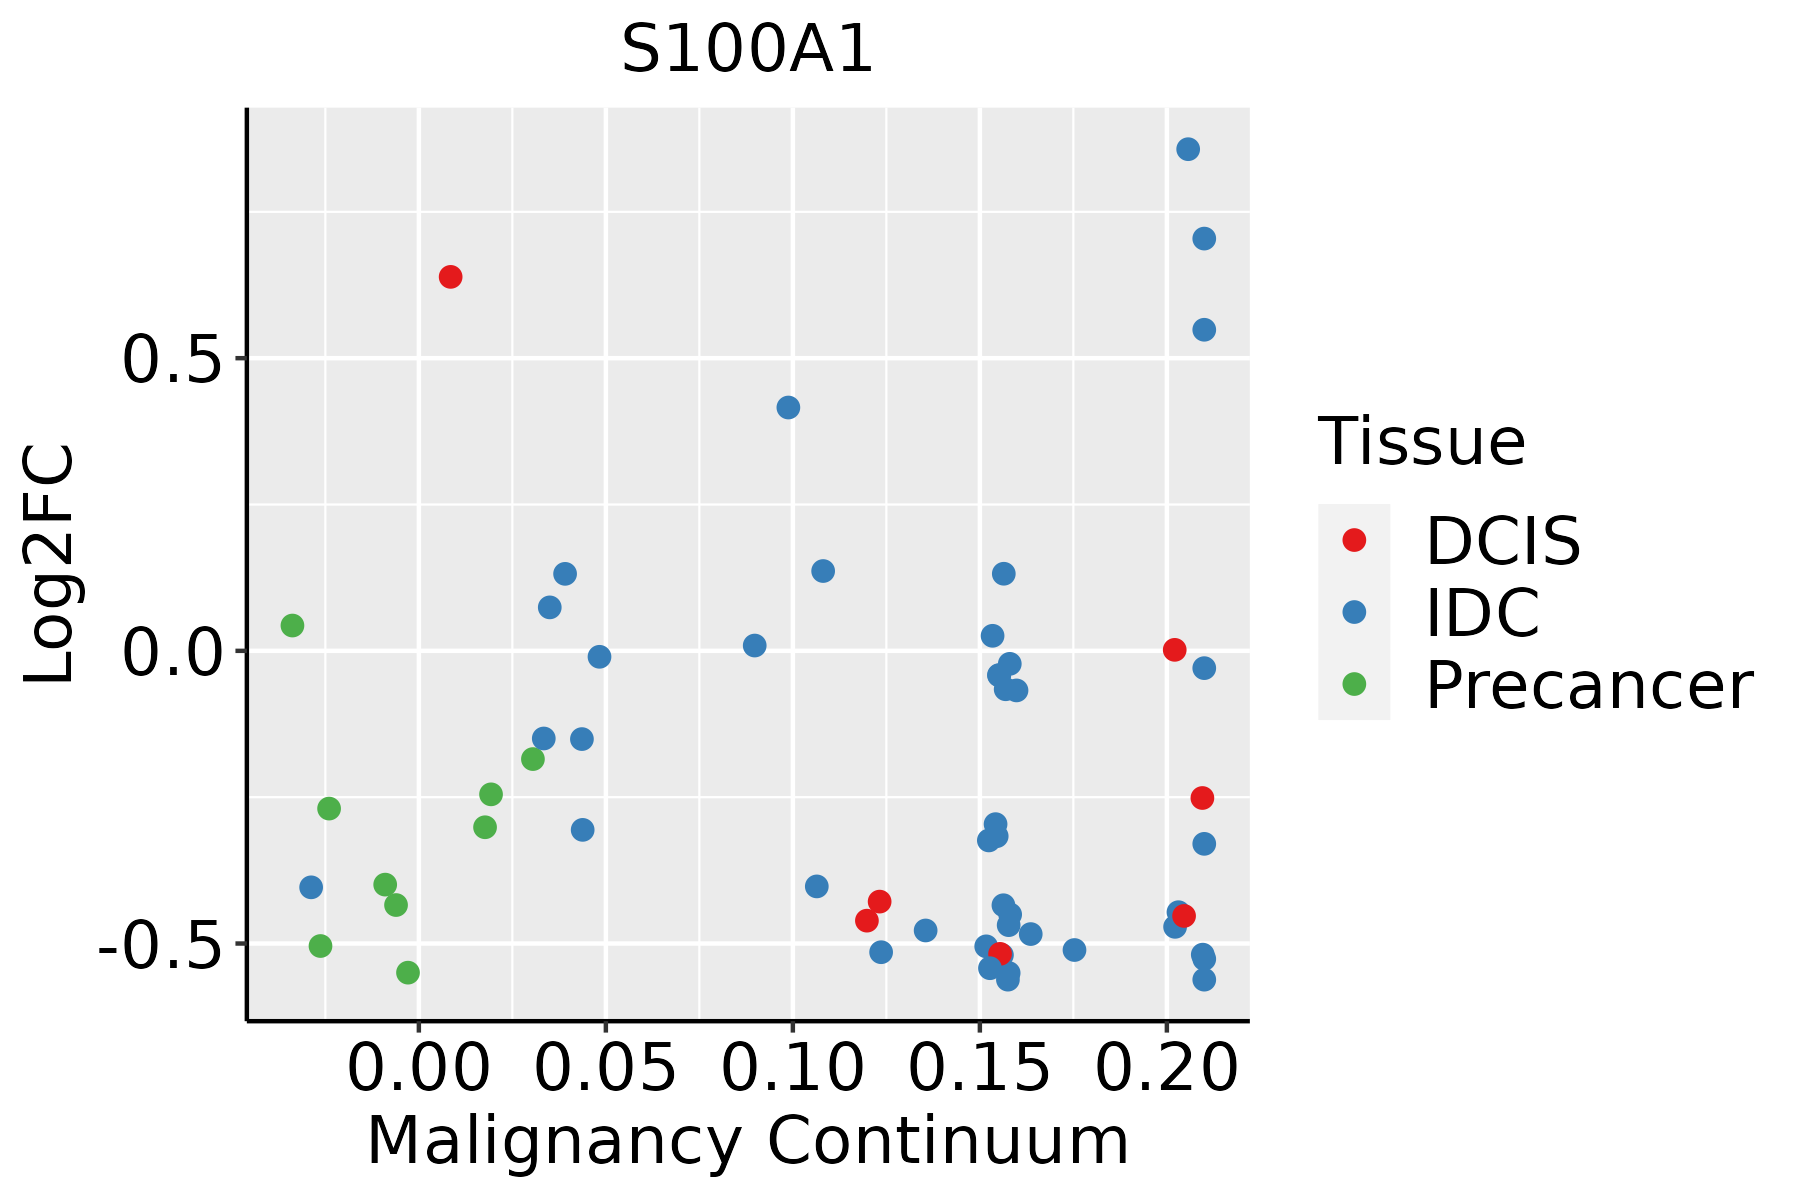 | IDC: Invasive ductal carcinoma |
| DCIS: Ductal carcinoma in situ | ||
| Precancer(BRCA1-mut): Precancerous lesion from BRCA1 mutation carriers | ||
| Esophagus | 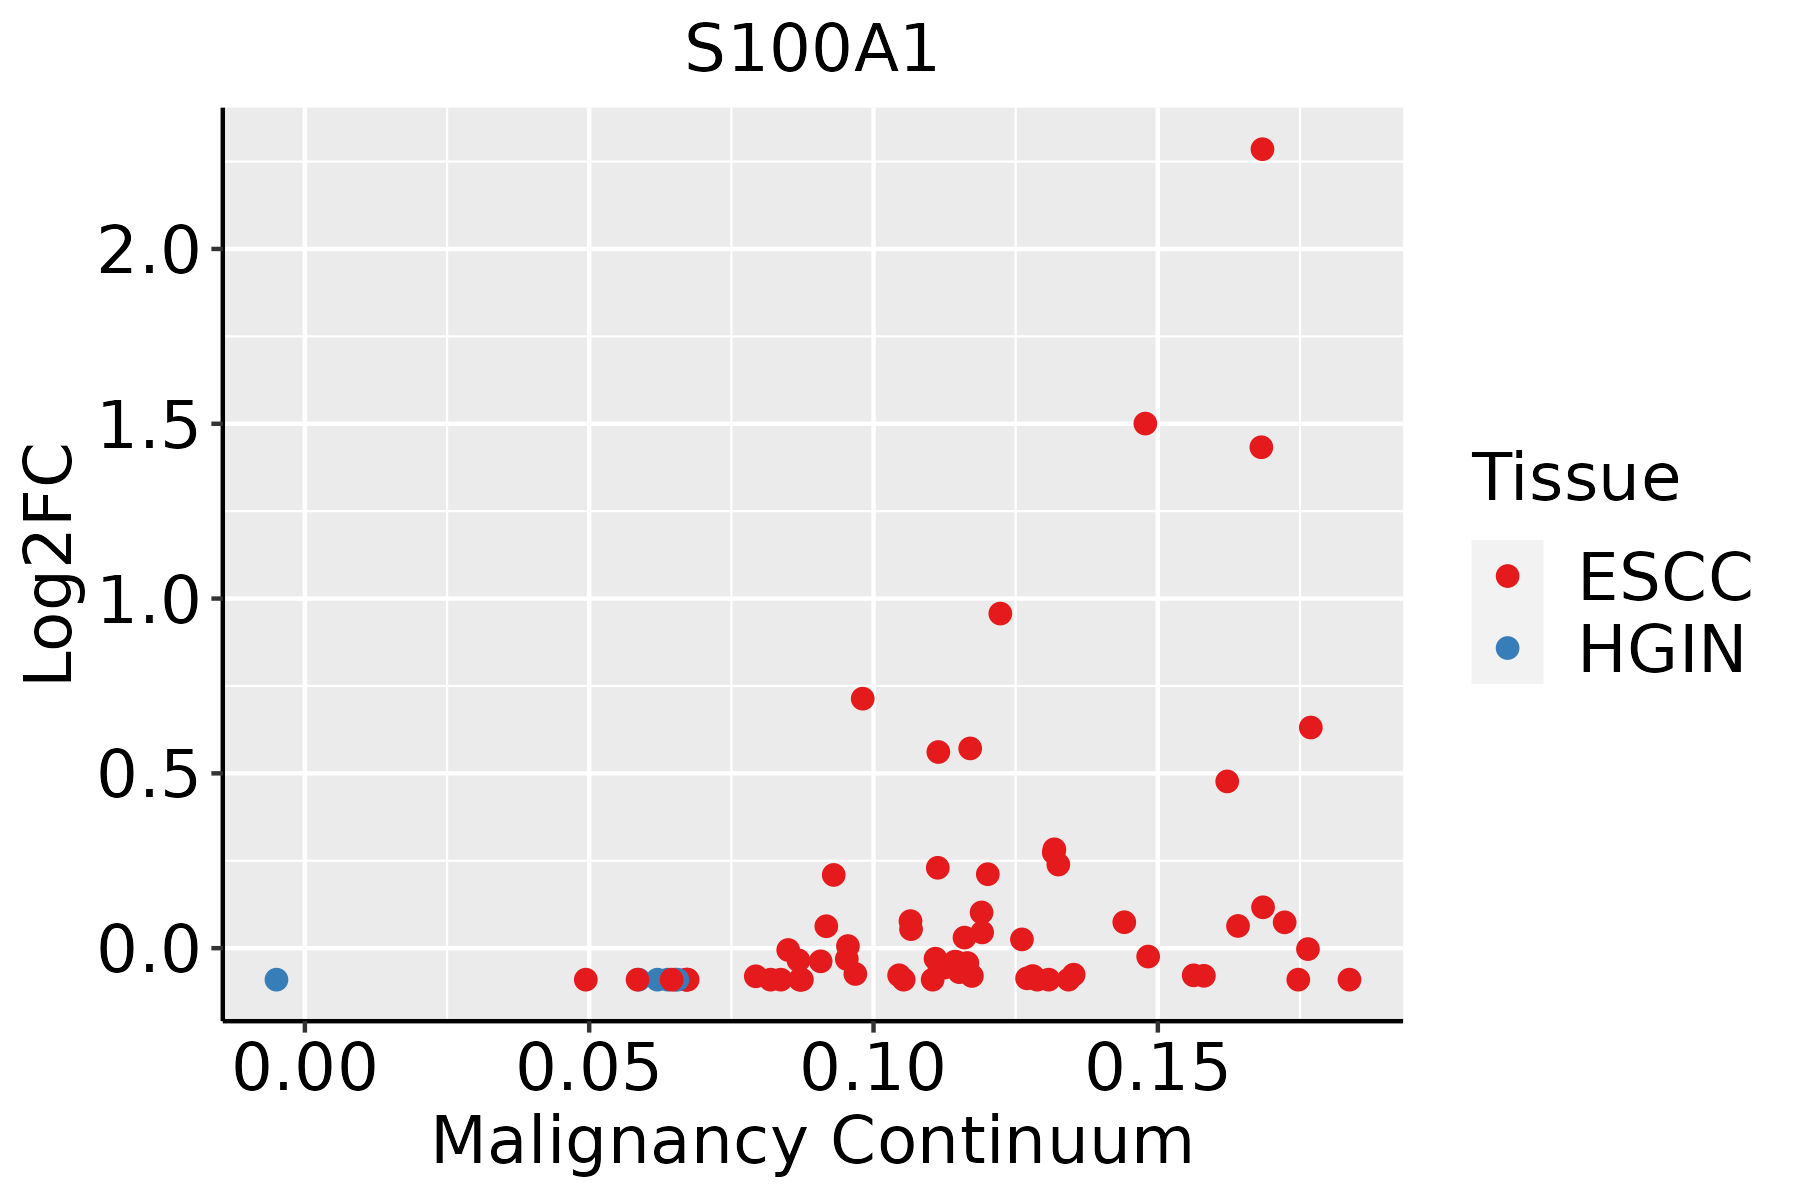 | ESCC: Esophageal squamous cell carcinoma |
| HGIN: High-grade intraepithelial neoplasias | ||
| LGIN: Low-grade intraepithelial neoplasias | ||
| Liver | 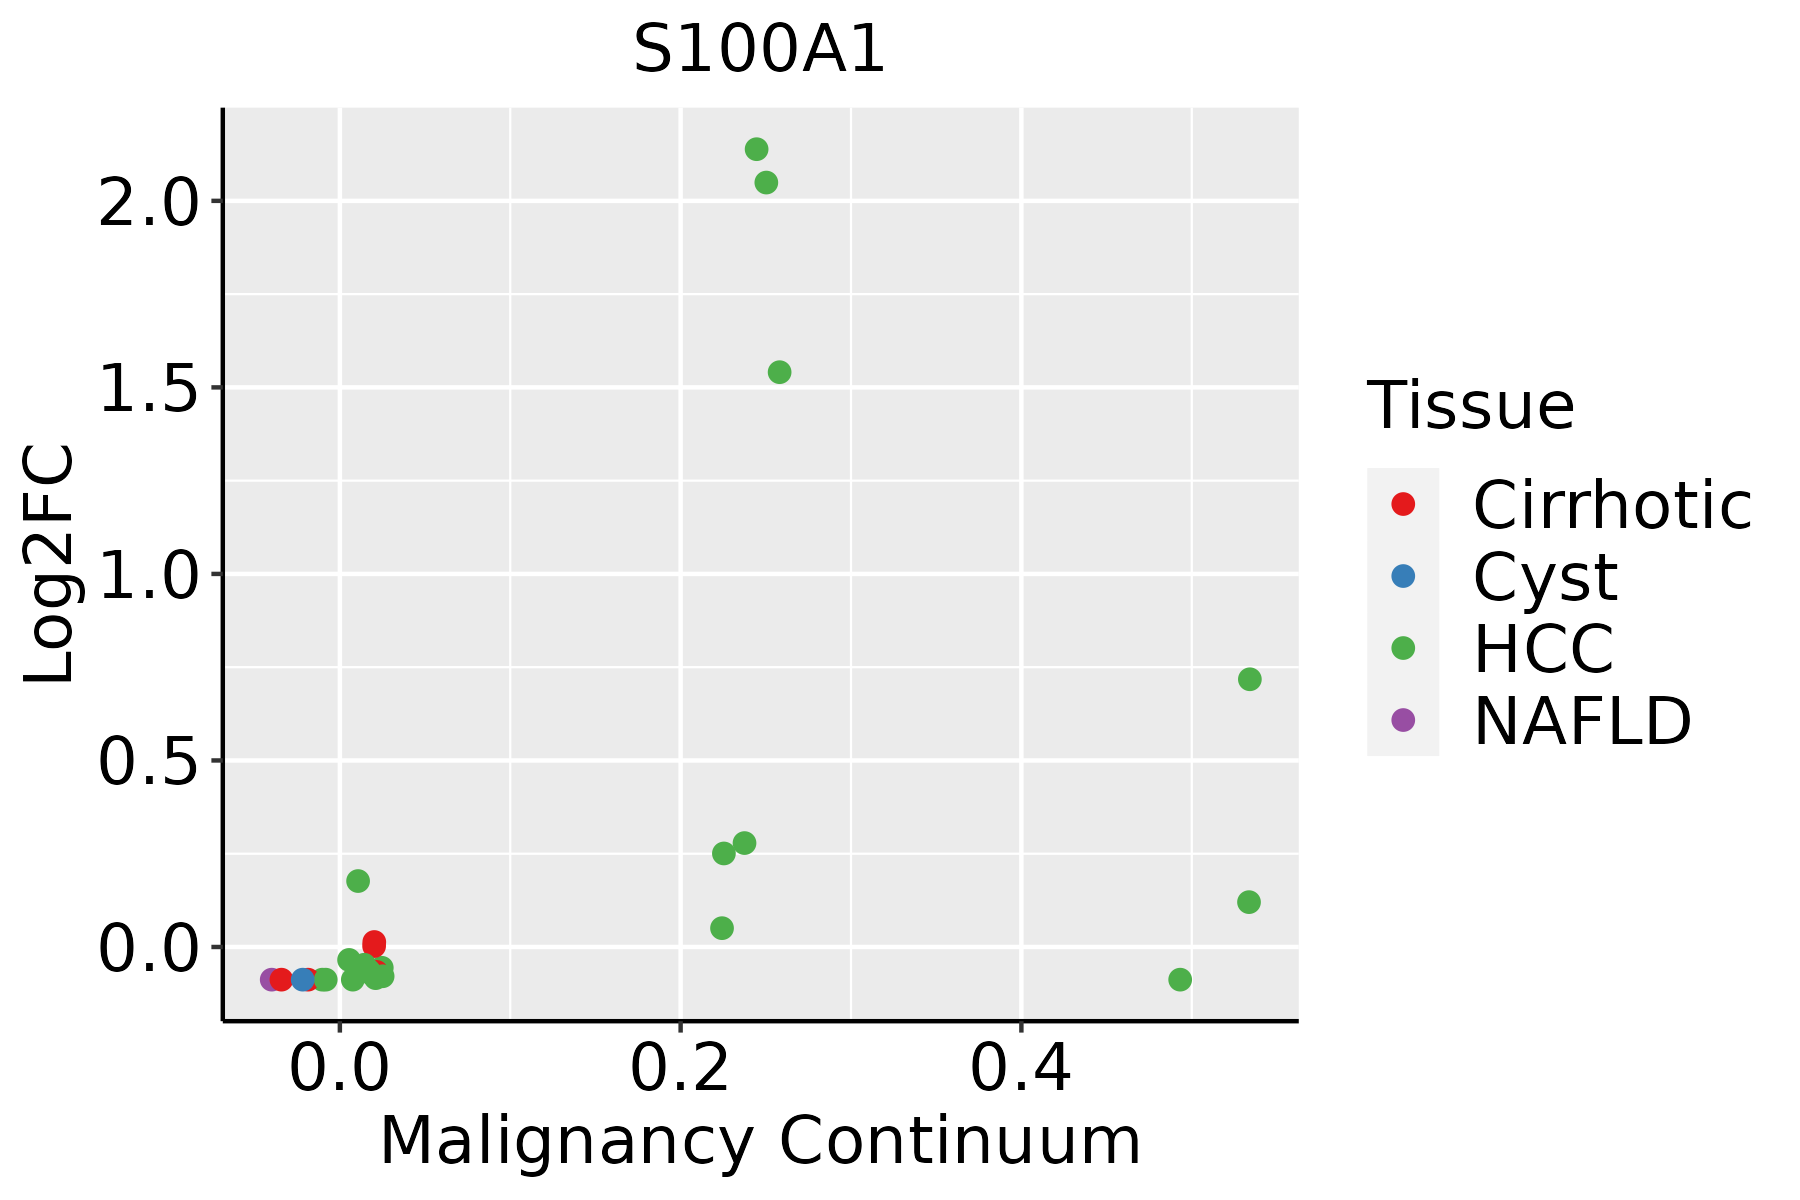 | HCC: Hepatocellular carcinoma |
| NAFLD: Non-alcoholic fatty liver disease | ||
| Thyroid | 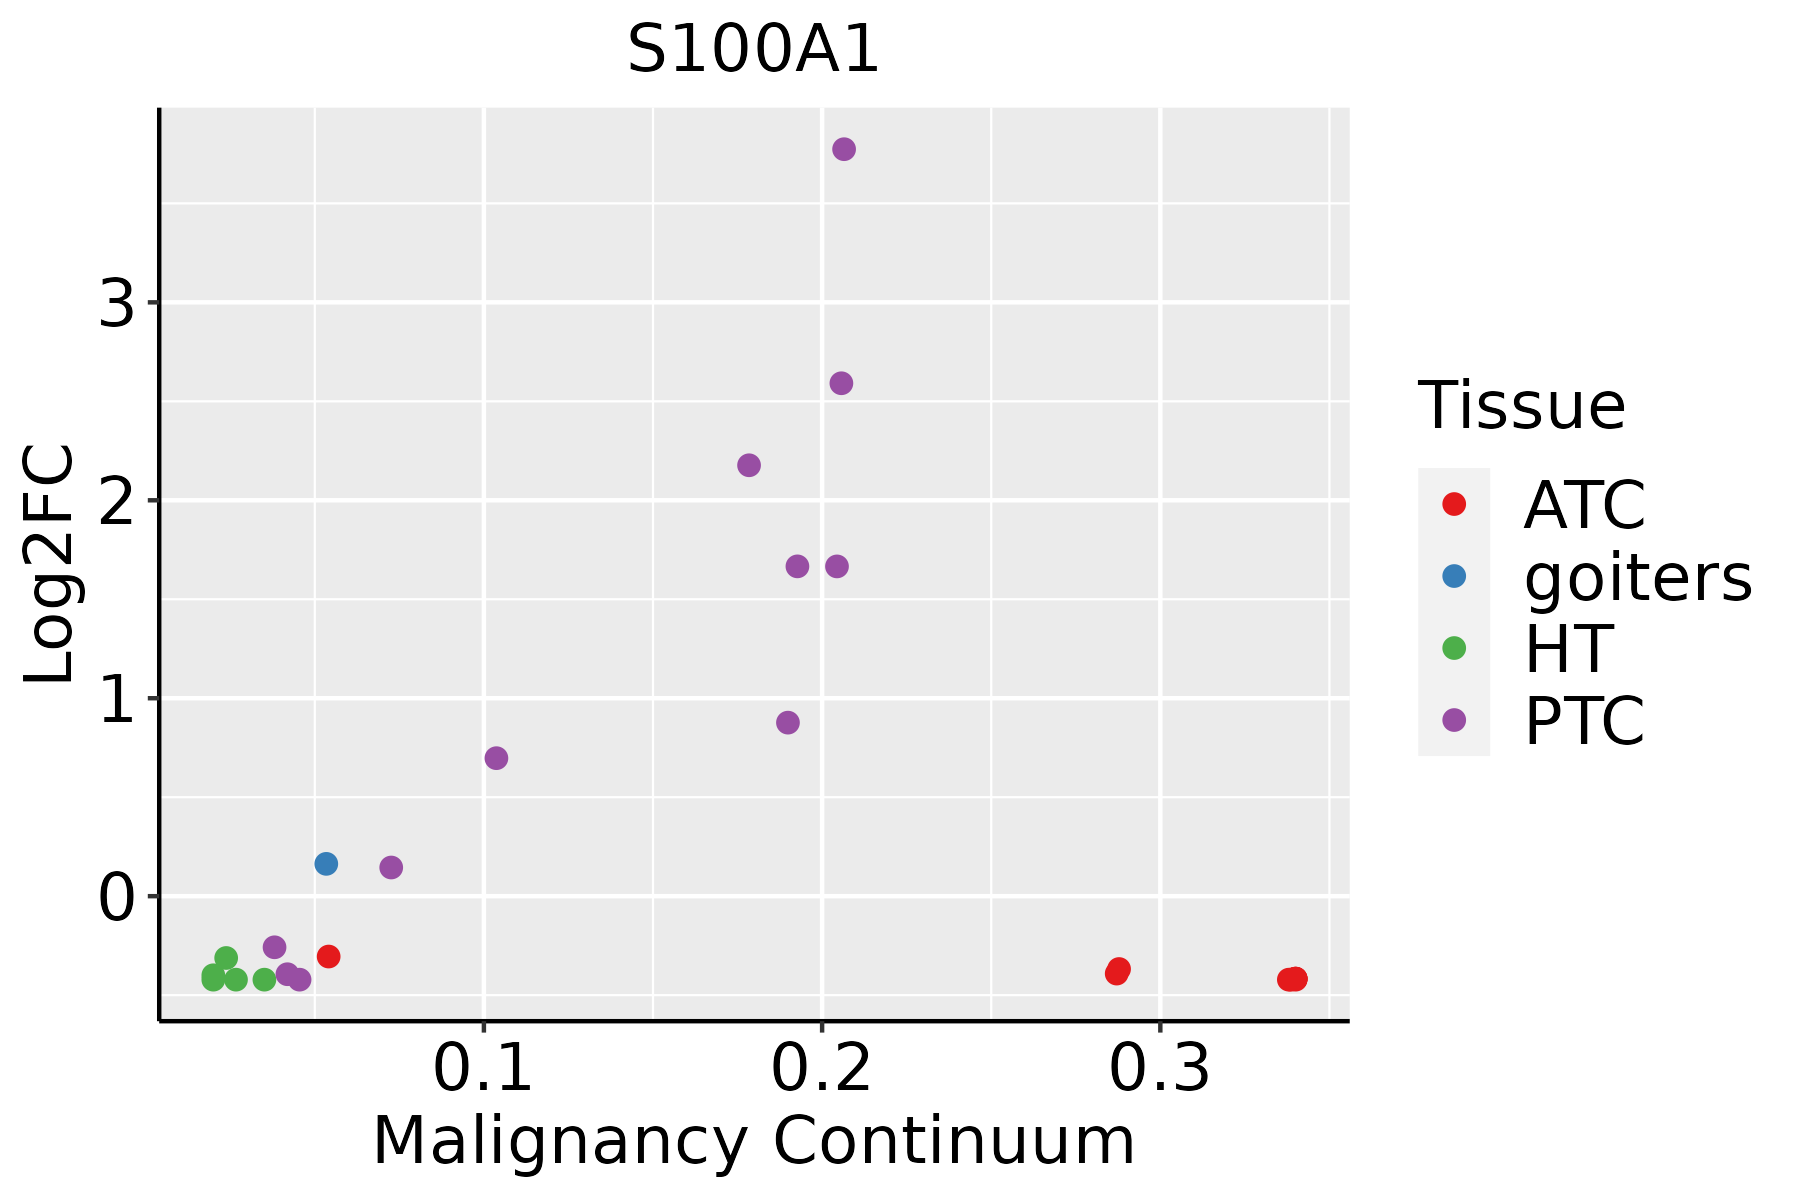 | ATC: Anaplastic thyroid cancer |
| HT: Hashimoto's thyroiditis | ||
| PTC: Papillary thyroid cancer |
| ∗log2FC in expression of this searched gene in stem-like cells from each diseased tissue sample relative to stem-like cells in normal samples in each tissue plotted against the malignancy continuum. Samples are colored based on if they are from different disease stage. |
Top |
Malignant transformation related pathway analysis |
| Find out the enriched GO biological processes and KEGG pathways involved in transition from healthy to precancer to cancer |
| Tissue | Disease Stage | Enriched GO biological Processes |
| Colorectum | AD |  |
| Colorectum | SER |  |
| Colorectum | MSS |  |
| Colorectum | MSI-H |  |
| Colorectum | FAP |  |
| ∗Top 15 enriched GO BP terms are showed in the bar plot of each disease state in each tissue. Each row represents a significant GO biological process which is colored according to the -log10(p.adjust). |
| Page: 1 2 3 4 5 6 7 8 9 |
| GO ID | Tissue | Disease Stage | Description | Gene Ratio | Bg Ratio | pvalue | p.adjust | Count |
| GO:00217629 | Breast | Precancer | substantia nigra development | 15/1080 | 44/18723 | 1.12e-08 | 7.98e-07 | 15 |
| GO:00975297 | Breast | Precancer | myeloid leukocyte migration | 34/1080 | 220/18723 | 1.42e-07 | 7.82e-06 | 34 |
| GO:00309018 | Breast | Precancer | midbrain development | 20/1080 | 90/18723 | 1.50e-07 | 7.93e-06 | 20 |
| GO:00509006 | Breast | Precancer | leukocyte migration | 47/1080 | 369/18723 | 2.82e-07 | 1.39e-05 | 47 |
| GO:00100389 | Breast | Precancer | response to metal ion | 47/1080 | 373/18723 | 3.88e-07 | 1.79e-05 | 47 |
| GO:00305956 | Breast | Precancer | leukocyte chemotaxis | 34/1080 | 230/18723 | 4.16e-07 | 1.89e-05 | 34 |
| GO:00488578 | Breast | Precancer | neural nucleus development | 16/1080 | 64/18723 | 4.76e-07 | 2.11e-05 | 16 |
| GO:00457859 | Breast | Precancer | positive regulation of cell adhesion | 52/1080 | 437/18723 | 5.74e-07 | 2.49e-05 | 52 |
| GO:00603266 | Breast | Precancer | cell chemotaxis | 41/1080 | 310/18723 | 5.99e-07 | 2.55e-05 | 41 |
| GO:00716217 | Breast | Precancer | granulocyte chemotaxis | 23/1080 | 125/18723 | 6.73e-07 | 2.77e-05 | 23 |
| GO:00510989 | Breast | Precancer | regulation of binding | 44/1080 | 363/18723 | 2.59e-06 | 8.65e-05 | 44 |
| GO:00975307 | Breast | Precancer | granulocyte migration | 24/1080 | 148/18723 | 4.04e-06 | 1.26e-04 | 24 |
| GO:00018196 | Breast | Precancer | positive regulation of cytokine production | 52/1080 | 467/18723 | 4.18e-06 | 1.29e-04 | 52 |
| GO:00022378 | Breast | Precancer | response to molecule of bacterial origin | 43/1080 | 363/18723 | 6.05e-06 | 1.72e-04 | 43 |
| GO:00324968 | Breast | Precancer | response to lipopolysaccharide | 41/1080 | 343/18723 | 7.94e-06 | 2.17e-04 | 41 |
| GO:19029059 | Breast | Precancer | positive regulation of supramolecular fiber organization | 28/1080 | 209/18723 | 2.79e-05 | 6.28e-04 | 28 |
| GO:00321034 | Breast | Precancer | positive regulation of response to external stimulus | 46/1080 | 427/18723 | 3.41e-05 | 7.40e-04 | 46 |
| GO:19029039 | Breast | Precancer | regulation of supramolecular fiber organization | 42/1080 | 383/18723 | 4.92e-05 | 1.04e-03 | 42 |
| GO:00026856 | Breast | Precancer | regulation of leukocyte migration | 27/1080 | 210/18723 | 7.93e-05 | 1.54e-03 | 27 |
| GO:00329709 | Breast | Precancer | regulation of actin filament-based process | 42/1080 | 397/18723 | 1.11e-04 | 2.01e-03 | 42 |
| Page: 1 2 3 4 5 6 7 8 9 10 11 12 13 14 15 16 17 18 19 20 21 22 23 24 25 26 27 28 29 30 31 32 33 34 35 36 37 38 39 40 41 42 43 44 45 46 47 48 49 50 51 52 53 54 55 56 57 58 59 60 61 62 63 64 65 66 67 68 69 70 71 72 73 74 75 76 77 78 79 80 81 82 83 84 85 86 87 88 89 90 91 92 93 94 95 96 97 98 99 100 101 102 103 104 105 106 |
| Pathway ID | Tissue | Disease Stage | Description | Gene Ratio | Bg Ratio | pvalue | p.adjust | qvalue | Count |
| Page: 1 |
Top |
Cell-cell communication analysis |
| Identification of potential cell-cell interactions between two cell types and their ligand-receptor pairs for different disease states |
| Ligand | Receptor | LRpair | Pathway | Tissue | Disease Stage |
| Page: 1 |
Top |
Single-cell gene regulatory network inference analysis |
| Find out the significant the regulons (TFs) and the target genes of each regulon across cell types for different disease states |
| TF | Cell Type | Tissue | Disease Stage | Target Gene | RSS | Regulon Activity |
| ∗The dot plots of a searched regulon are shown for all cell subpopulations in each disease state of each tissue based on the regulon specific score inferred using pySCENIC and by calculating the average expression. |
| Page: 1 |
Top |
Somatic mutation of malignant transformation related genes |
| Annotation of somatic variants for genes involved in malignant transformation |
| Hugo Symbol | Variant Class | Variant Classification | dbSNP RS | HGVSc | HGVSp | HGVSp Short | SWISSPROT | BIOTYPE | SIFT | PolyPhen | Tumor Sample Barcode | Tissue | Histology | Sex | Age | Stage | Therapy Types | Drugs | Outcome |
| S100A1 | SNV | Missense_Mutation | rs778293778 | c.59C>T | p.Ser20Leu | p.S20L | P23297 | protein_coding | deleterious(0) | probably_damaging(0.999) | TCGA-A8-A095-01 | Breast | breast invasive carcinoma | Female | <65 | I/II | Chemotherapy | 5-fluorouracil | CR |
| S100A1 | insertion | Frame_Shift_Ins | novel | c.284_285insGCTTGTAA | p.Ter95TrpfsTer? | p.*95Wfs*? | P23297 | protein_coding | TCGA-AN-A0FX-01 | Breast | breast invasive carcinoma | Female | <65 | I/II | Unknown | Unknown | SD | ||
| S100A1 | insertion | In_Frame_Ins | novel | c.259_260insTTGCTCCCACTATCCCCGAATCAACCAGGAGTG | p.Asn87delinsIleAlaProThrIleProGluSerThrArgSerAsp | p.N87delinsIAPTIPESTRSD | P23297 | protein_coding | TCGA-BH-A0B4-01 | Breast | breast invasive carcinoma | Male | >=65 | III/IV | Hormone Therapy | tamoxiphen | SD | ||
| S100A1 | SNV | Missense_Mutation | rs375726273 | c.202G>A | p.Gly68Arg | p.G68R | P23297 | protein_coding | deleterious(0) | possibly_damaging(0.864) | TCGA-DS-A0VL-01 | Cervix | cervical & endocervical cancer | Female | <65 | I/II | Unknown | Unknown | SD |
| S100A1 | SNV | Missense_Mutation | novel | c.199G>T | p.Asp67Tyr | p.D67Y | P23297 | protein_coding | deleterious(0) | probably_damaging(0.999) | TCGA-AZ-4315-01 | Colorectum | colon adenocarcinoma | Male | <65 | I/II | Unknown | Unknown | SD |
| S100A1 | SNV | Missense_Mutation | c.84N>T | p.Lys28Asn | p.K28N | P23297 | protein_coding | tolerated(0.05) | possibly_damaging(0.877) | TCGA-AP-A0LM-01 | Endometrium | uterine corpus endometrioid carcinoma | Female | <65 | III/IV | Chemotherapy | cisplatin | SD | |
| S100A1 | SNV | Missense_Mutation | novel | c.69N>T | p.Glu23Asp | p.E23D | P23297 | protein_coding | tolerated(0.16) | benign(0.295) | TCGA-B5-A3FA-01 | Endometrium | uterine corpus endometrioid carcinoma | Female | >=65 | I/II | Unknown | Unknown | SD |
| S100A1 | SNV | Missense_Mutation | novel | c.71N>T | p.Gly24Val | p.G24V | P23297 | protein_coding | deleterious(0) | probably_damaging(0.998) | TCGA-D1-A2G0-01 | Endometrium | uterine corpus endometrioid carcinoma | Female | >=65 | I/II | Unknown | Unknown | SD |
| S100A1 | SNV | Missense_Mutation | novel | c.56A>G | p.His19Arg | p.H19R | P23297 | protein_coding | deleterious(0) | benign(0.163) | TCGA-EY-A1GK-01 | Endometrium | uterine corpus endometrioid carcinoma | Female | >=65 | I/II | Unknown | Unknown | SD |
| S100A1 | SNV | Missense_Mutation | rs751778242 | c.52N>A | p.Ala18Thr | p.A18T | P23297 | protein_coding | tolerated(0.17) | benign(0.003) | TCGA-62-8398-01 | Lung | lung adenocarcinoma | Male | <65 | III/IV | Chemotherapy | carboplatin | CR |
| Page: 1 2 |
Top |
Related drugs of malignant transformation related genes |
| Identification of chemicals and drugs interact with genes involved in malignant transfromation |
| (DGIdb 4.0) |
| Entrez ID | Symbol | Category | Interaction Types | Drug Claim Name | Drug Name | PMIDs |
| Page: 1 |

Copyright 2023-Present -The University of Texas Health Science Center at Houston |