
|
|||||
|
 | |
| |
| |
| |
| |
| |
|
Gene: RYR2 |
Gene summary for RYR2 |
| Gene information | Species | Human | Gene symbol | RYR2 | Gene ID | 6262 |
| Gene name | ryanodine receptor 2 | |
| Gene Alias | ARVC2 | |
| Cytomap | 1q43 | |
| Gene Type | protein-coding | GO ID | GO:0001508 | UniProtAcc | Q92736 |
Top |
Malignant transformation analysis |
| Identification of the aberrant gene expression in precancerous and cancerous lesions by comparing the gene expression of stem-like cells in diseased tissues with normal stem cells |
| Entrez ID | Symbol | Replicates | Species | Organ | Tissue | Adj P-value | Log2FC | Malignancy |
| 6262 | RYR2 | HCC1_Meng | Human | Liver | HCC | 2.31e-06 | 3.05e-02 | 0.0246 |
| 6262 | RYR2 | S014 | Human | Liver | HCC | 2.70e-03 | 1.54e-01 | 0.2254 |
| 6262 | RYR2 | S016 | Human | Liver | HCC | 4.70e-07 | 2.03e-01 | 0.2243 |
| 6262 | RYR2 | S027 | Human | Liver | HCC | 2.91e-17 | 7.90e-01 | 0.2446 |
| 6262 | RYR2 | S028 | Human | Liver | HCC | 5.55e-24 | 6.96e-01 | 0.2503 |
| 6262 | RYR2 | S029 | Human | Liver | HCC | 1.35e-19 | 6.23e-01 | 0.2581 |
| 6262 | RYR2 | HTA12-15-2 | Human | Pancreas | PDAC | 3.80e-04 | 4.88e-01 | 0.2315 |
| 6262 | RYR2 | HTA12-23-1 | Human | Pancreas | PDAC | 1.91e-07 | 7.40e-01 | 0.3405 |
| 6262 | RYR2 | HTA12-26-1 | Human | Pancreas | PDAC | 3.95e-14 | 8.04e-01 | 0.3728 |
| 6262 | RYR2 | HTA12-29-1 | Human | Pancreas | PDAC | 9.86e-32 | 8.29e-01 | 0.3722 |
| 6262 | RYR2 | ATC13 | Human | Thyroid | ATC | 9.16e-09 | 1.11e-01 | 0.34 |
| 6262 | RYR2 | ATC5 | Human | Thyroid | ATC | 2.23e-07 | 1.36e-01 | 0.34 |
| Page: 1 |
| Tissue | Expression Dynamics | Abbreviation |
| Liver | 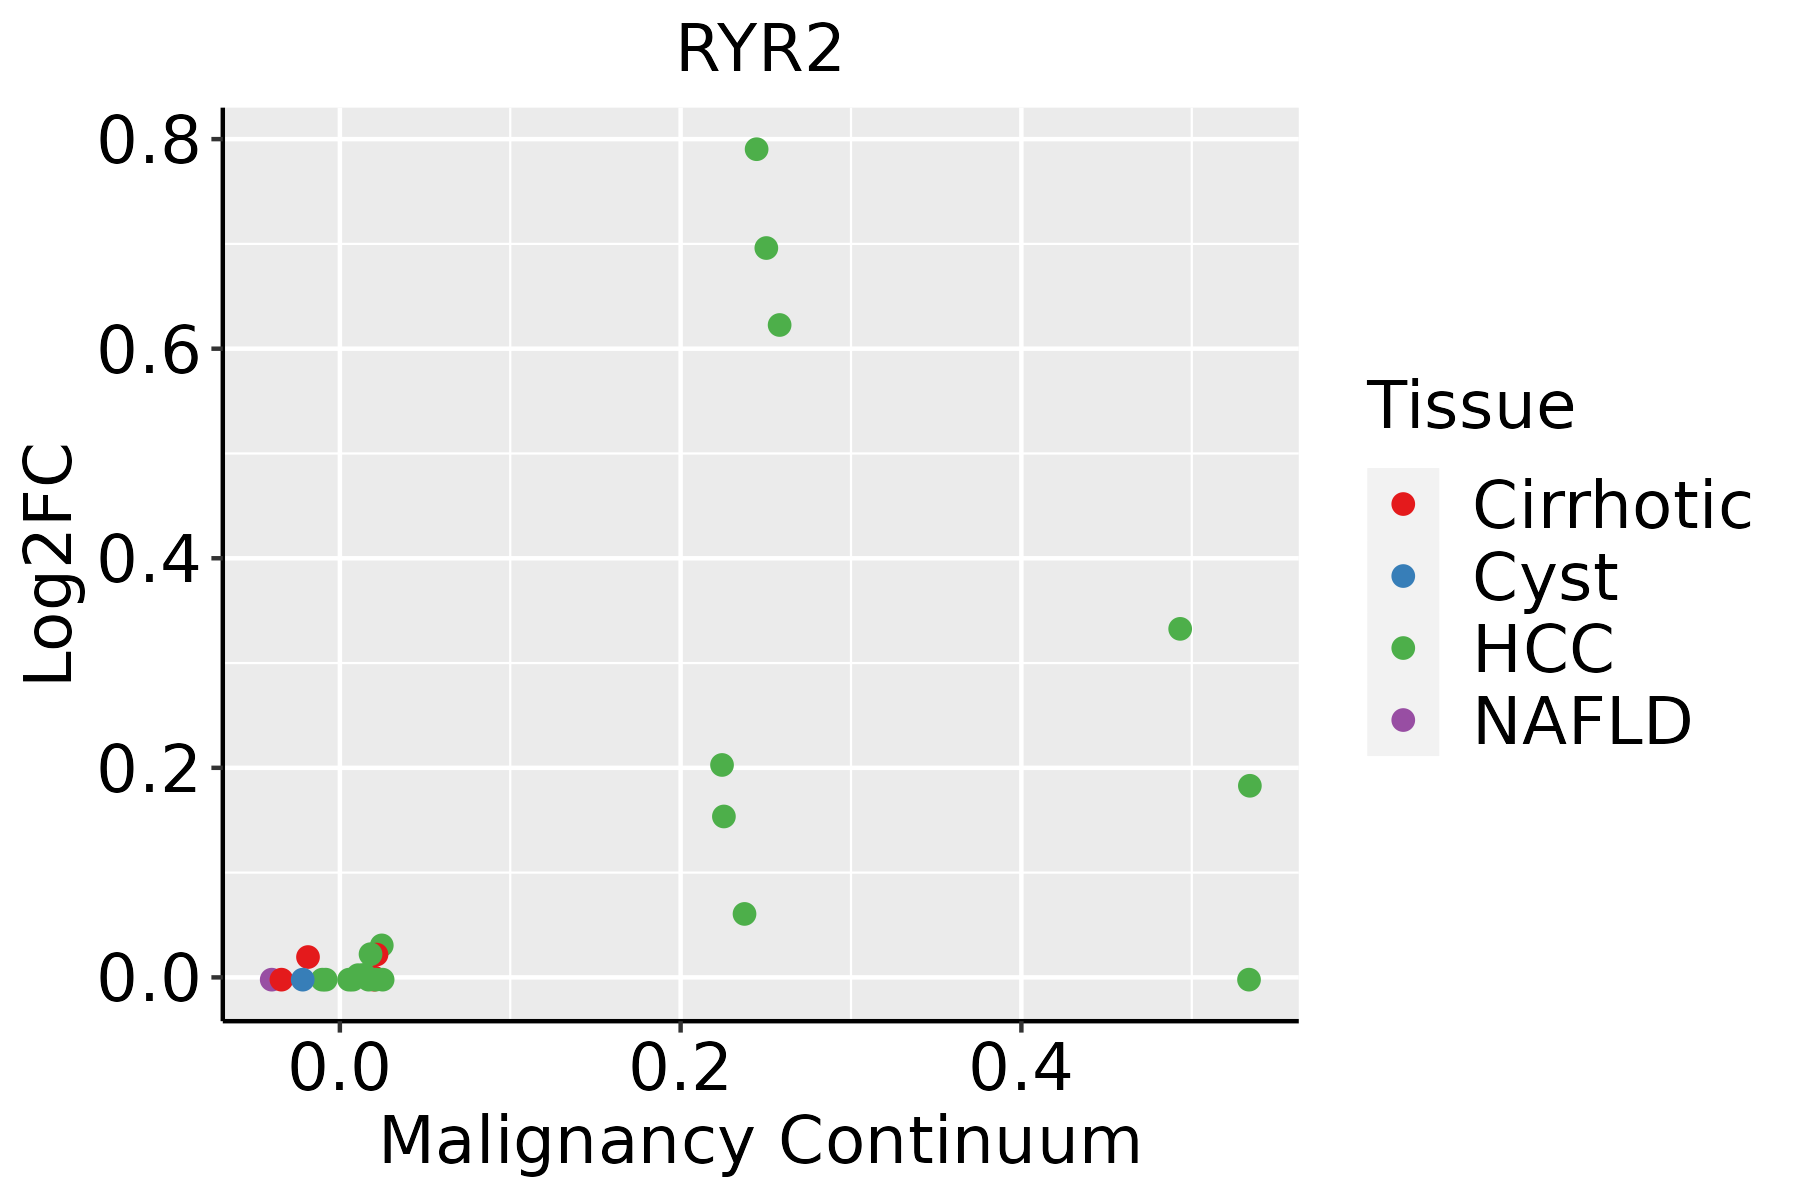 | HCC: Hepatocellular carcinoma |
| NAFLD: Non-alcoholic fatty liver disease | ||
| Thyroid | 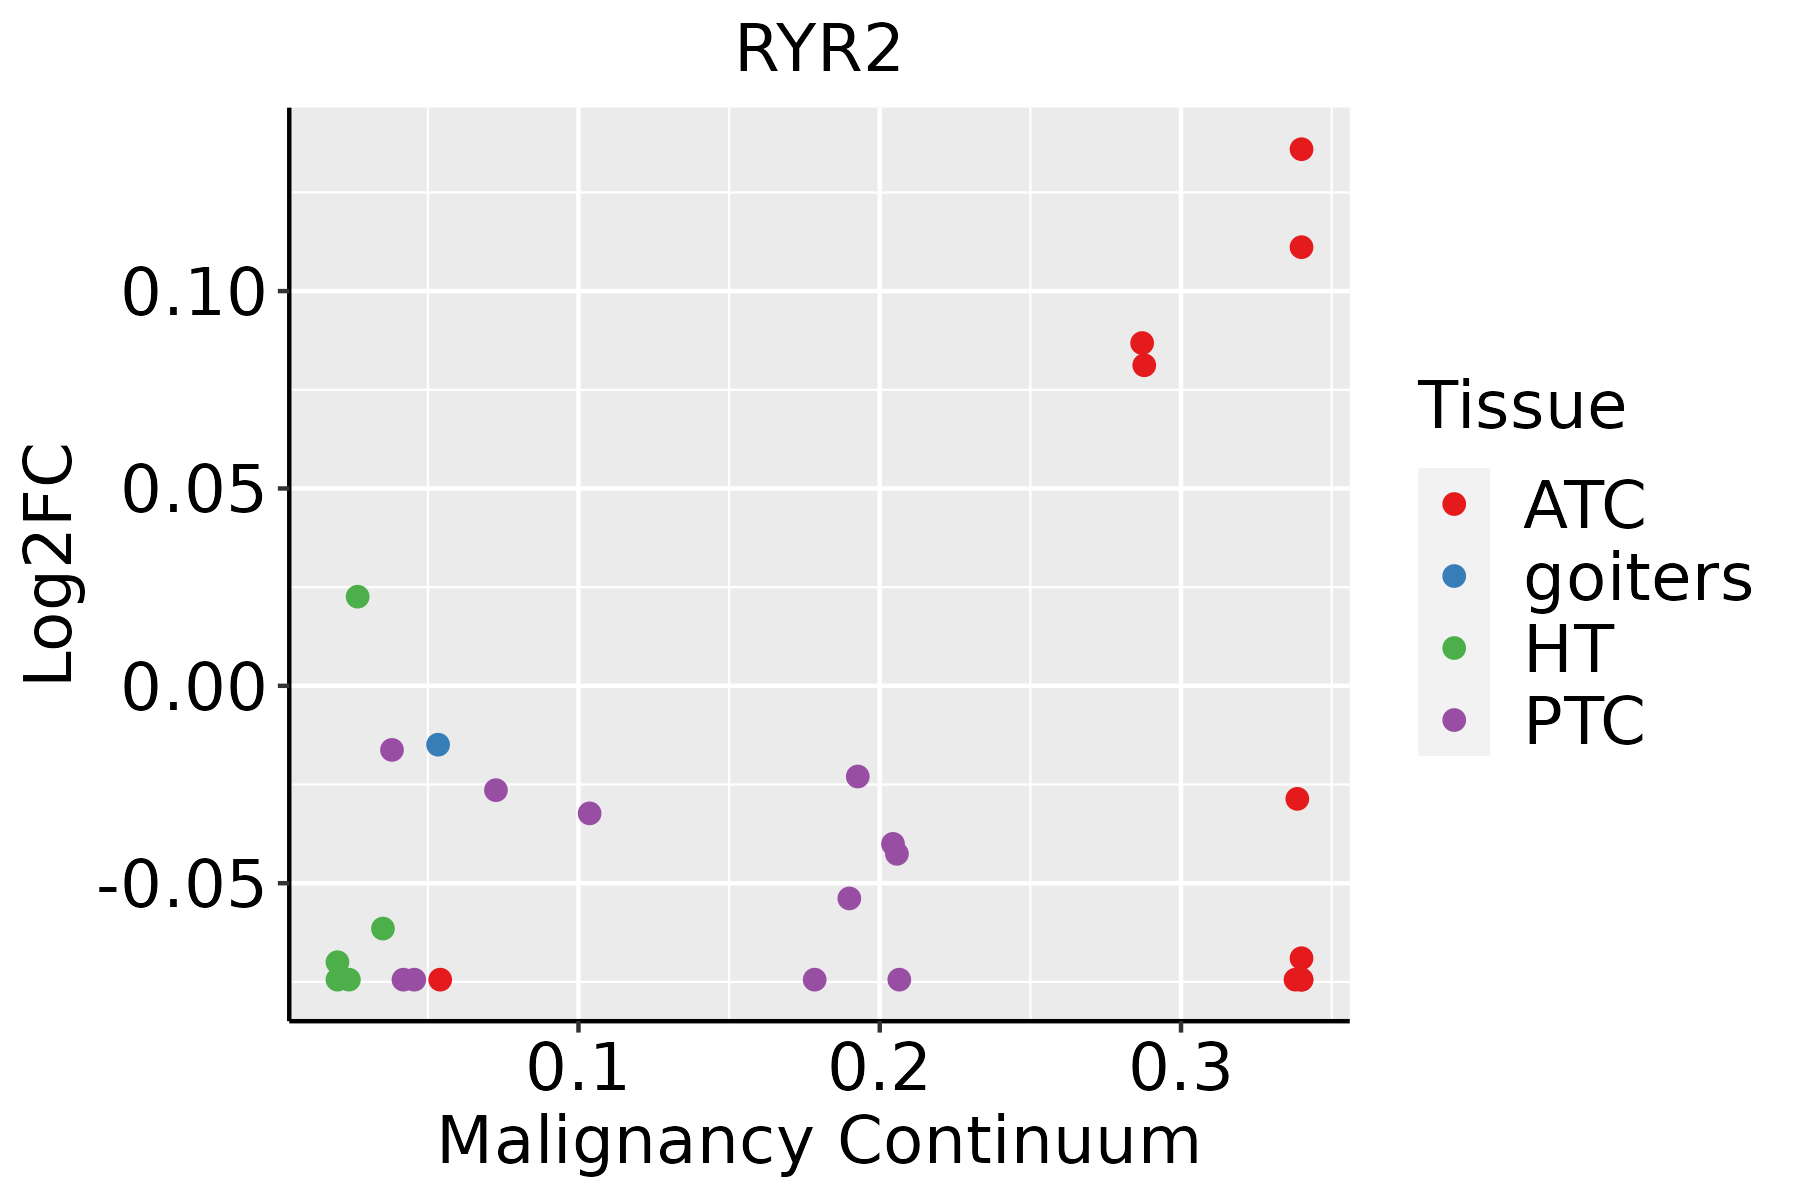 | ATC: Anaplastic thyroid cancer |
| HT: Hashimoto's thyroiditis | ||
| PTC: Papillary thyroid cancer |
| ∗log2FC in expression of this searched gene in stem-like cells from each diseased tissue sample relative to stem-like cells in normal samples in each tissue plotted against the malignancy continuum. Samples are colored based on if they are from different disease stage. |
Top |
Malignant transformation related pathway analysis |
| Find out the enriched GO biological processes and KEGG pathways involved in transition from healthy to precancer to cancer |
| Tissue | Disease Stage | Enriched GO biological Processes |
| Colorectum | AD |  |
| Colorectum | SER |  |
| Colorectum | MSS |  |
| Colorectum | MSI-H |  |
| Colorectum | FAP |  |
| ∗Top 15 enriched GO BP terms are showed in the bar plot of each disease state in each tissue. Each row represents a significant GO biological process which is colored according to the -log10(p.adjust). |
| Page: 1 2 3 4 5 6 7 8 9 |
| GO ID | Tissue | Disease Stage | Description | Gene Ratio | Bg Ratio | pvalue | p.adjust | Count |
| GO:007259422 | Liver | HCC | establishment of protein localization to organelle | 299/7958 | 422/18723 | 1.06e-32 | 6.10e-30 | 299 |
| GO:003297022 | Liver | HCC | regulation of actin filament-based process | 222/7958 | 397/18723 | 3.81e-08 | 8.30e-07 | 222 |
| GO:007097212 | Liver | HCC | protein localization to endoplasmic reticulum | 54/7958 | 74/18723 | 1.01e-07 | 1.98e-06 | 54 |
| GO:001003822 | Liver | HCC | response to metal ion | 208/7958 | 373/18723 | 1.35e-07 | 2.56e-06 | 208 |
| GO:005123521 | Liver | HCC | maintenance of location | 185/7958 | 327/18723 | 1.70e-07 | 3.12e-06 | 185 |
| GO:000166612 | Liver | HCC | response to hypoxia | 172/7958 | 307/18723 | 1.06e-06 | 1.59e-05 | 172 |
| GO:003629312 | Liver | HCC | response to decreased oxygen levels | 179/7958 | 322/18723 | 1.29e-06 | 1.87e-05 | 179 |
| GO:007048212 | Liver | HCC | response to oxygen levels | 191/7958 | 347/18723 | 1.42e-06 | 2.03e-05 | 191 |
| GO:007259911 | Liver | HCC | establishment of protein localization to endoplasmic reticulum | 34/7958 | 46/18723 | 1.53e-05 | 1.67e-04 | 34 |
| GO:005165112 | Liver | HCC | maintenance of location in cell | 119/7958 | 214/18723 | 7.11e-05 | 6.39e-04 | 119 |
| GO:001407421 | Liver | HCC | response to purine-containing compound | 84/7958 | 148/18723 | 3.19e-04 | 2.26e-03 | 84 |
| GO:00096124 | Liver | HCC | response to mechanical stimulus | 113/7958 | 216/18723 | 2.20e-03 | 1.10e-02 | 113 |
| GO:005159221 | Liver | HCC | response to calcium ion | 81/7958 | 149/18723 | 2.26e-03 | 1.13e-02 | 81 |
| GO:00359942 | Liver | HCC | response to muscle stretch | 17/7958 | 23/18723 | 2.28e-03 | 1.13e-02 | 17 |
| GO:00148231 | Liver | HCC | response to activity | 45/7958 | 76/18723 | 2.42e-03 | 1.18e-02 | 45 |
| GO:0051775 | Liver | HCC | response to redox state | 12/7958 | 15/18723 | 3.56e-03 | 1.59e-02 | 12 |
| GO:009891111 | Liver | HCC | regulation of ventricular cardiac muscle cell action potential | 10/7958 | 12/18723 | 4.79e-03 | 2.02e-02 | 10 |
| GO:00432791 | Liver | HCC | response to alkaloid | 62/7958 | 115/18723 | 8.79e-03 | 3.42e-02 | 62 |
| GO:00860642 | Liver | HCC | cell communication by electrical coupling involved in cardiac conduction | 17/7958 | 25/18723 | 8.94e-03 | 3.45e-02 | 17 |
| GO:0010882 | Liver | HCC | regulation of cardiac muscle contraction by calcium ion signaling | 18/7958 | 27/18723 | 9.75e-03 | 3.66e-02 | 18 |
| Page: 1 2 3 |
| Pathway ID | Tissue | Disease Stage | Description | Gene Ratio | Bg Ratio | pvalue | p.adjust | qvalue | Count |
| hsa0502022 | Liver | HCC | Prion disease | 195/4020 | 273/8465 | 3.26e-16 | 1.56e-14 | 8.67e-15 | 195 |
| hsa0541522 | Liver | HCC | Diabetic cardiomyopathy | 151/4020 | 203/8465 | 2.72e-15 | 1.01e-13 | 5.63e-14 | 151 |
| hsa0502222 | Liver | HCC | Pathways of neurodegeneration - multiple diseases | 298/4020 | 476/8465 | 6.59e-12 | 1.30e-10 | 7.22e-11 | 298 |
| hsa0502032 | Liver | HCC | Prion disease | 195/4020 | 273/8465 | 3.26e-16 | 1.56e-14 | 8.67e-15 | 195 |
| hsa0541532 | Liver | HCC | Diabetic cardiomyopathy | 151/4020 | 203/8465 | 2.72e-15 | 1.01e-13 | 5.63e-14 | 151 |
| hsa0502232 | Liver | HCC | Pathways of neurodegeneration - multiple diseases | 298/4020 | 476/8465 | 6.59e-12 | 1.30e-10 | 7.22e-11 | 298 |
| Page: 1 |
Top |
Cell-cell communication analysis |
| Identification of potential cell-cell interactions between two cell types and their ligand-receptor pairs for different disease states |
| Ligand | Receptor | LRpair | Pathway | Tissue | Disease Stage |
| Page: 1 |
Top |
Single-cell gene regulatory network inference analysis |
| Find out the significant the regulons (TFs) and the target genes of each regulon across cell types for different disease states |
| TF | Cell Type | Tissue | Disease Stage | Target Gene | RSS | Regulon Activity |
| ∗The dot plots of a searched regulon are shown for all cell subpopulations in each disease state of each tissue based on the regulon specific score inferred using pySCENIC and by calculating the average expression. |
| Page: 1 |
Top |
Somatic mutation of malignant transformation related genes |
| Annotation of somatic variants for genes involved in malignant transformation |
| Hugo Symbol | Variant Class | Variant Classification | dbSNP RS | HGVSc | HGVSp | HGVSp Short | SWISSPROT | BIOTYPE | SIFT | PolyPhen | Tumor Sample Barcode | Tissue | Histology | Sex | Age | Stage | Therapy Types | Drugs | Outcome |
| RYR2 | SNV | Missense_Mutation | novel | c.1747N>A | p.Pro583Thr | p.P583T | Q92736 | protein_coding | deleterious(0.03) | possibly_damaging(0.87) | TCGA-3C-AALI-01 | Breast | breast invasive carcinoma | Female | <65 | I/II | Unspecific | Poly E | Complete Response |
| RYR2 | SNV | Missense_Mutation | c.4888N>T | p.Leu1630Phe | p.L1630F | Q92736 | protein_coding | deleterious(0.02) | probably_damaging(0.916) | TCGA-5L-AAT1-01 | Breast | breast invasive carcinoma | Female | <65 | III/IV | Hormone Therapy | letrozol | SD | |
| RYR2 | SNV | Missense_Mutation | c.9523C>G | p.Leu3175Val | p.L3175V | Q92736 | protein_coding | deleterious(0) | benign(0.139) | TCGA-A1-A0SH-01 | Breast | breast invasive carcinoma | Female | <65 | I/II | Chemotherapy | tc | SD | |
| RYR2 | SNV | Missense_Mutation | c.11050N>A | p.Glu3684Lys | p.E3684K | Q92736 | protein_coding | tolerated(0.06) | benign(0.093) | TCGA-A2-A04W-01 | Breast | breast invasive carcinoma | Female | <65 | I/II | Chemotherapy | cytoxan | SD | |
| RYR2 | SNV | Missense_Mutation | c.2939C>A | p.Pro980His | p.P980H | Q92736 | protein_coding | deleterious(0) | probably_damaging(0.937) | TCGA-A2-A0CW-01 | Breast | breast invasive carcinoma | Female | >=65 | I/II | Hormone Therapy | anastrozole | SD | |
| RYR2 | SNV | Missense_Mutation | c.2608N>T | p.Ser870Cys | p.S870C | Q92736 | protein_coding | deleterious(0.01) | probably_damaging(0.915) | TCGA-A2-A0EQ-01 | Breast | breast invasive carcinoma | Female | <65 | I/II | Chemotherapy | adriamycin | SD | |
| RYR2 | SNV | Missense_Mutation | c.4434N>T | p.Glu1478Asp | p.E1478D | Q92736 | protein_coding | tolerated(0.23) | possibly_damaging(0.579) | TCGA-A2-A0YT-01 | Breast | breast invasive carcinoma | Female | <65 | III/IV | Hormone Therapy | arimidex | SD | |
| RYR2 | SNV | Missense_Mutation | rs373326624 | c.796N>A | p.Ala266Thr | p.A266T | Q92736 | protein_coding | deleterious(0.02) | possibly_damaging(0.771) | TCGA-A2-A25B-01 | Breast | breast invasive carcinoma | Female | <65 | I/II | Chemotherapy | taxotere | PD |
| RYR2 | SNV | Missense_Mutation | novel | c.1605N>T | p.Glu535Asp | p.E535D | Q92736 | protein_coding | tolerated(0.06) | benign(0.251) | TCGA-A2-A3Y0-01 | Breast | breast invasive carcinoma | Female | <65 | I/II | Chemotherapy | adriamycin | CR |
| RYR2 | SNV | Missense_Mutation | rs370276573 | c.6614G>A | p.Arg2205His | p.R2205H | Q92736 | protein_coding | deleterious(0) | probably_damaging(1) | TCGA-A2-A4S0-01 | Breast | breast invasive carcinoma | Female | >=65 | I/II | Unknown | Unknown | SD |
| Page: 1 2 3 4 5 6 7 8 9 10 11 12 13 14 15 16 17 18 19 20 21 22 23 24 25 26 27 28 29 30 31 32 33 34 35 36 37 38 39 40 41 42 43 44 45 46 47 48 49 50 51 52 53 54 55 56 57 58 59 60 61 62 63 64 65 66 67 68 69 70 71 72 73 74 75 76 77 78 79 80 81 82 83 84 85 86 87 88 89 90 91 92 93 94 95 96 97 98 99 100 101 102 103 104 105 106 107 108 109 110 111 112 113 114 115 116 117 118 119 120 121 122 123 124 125 126 127 128 129 130 131 132 133 134 135 136 137 138 139 140 141 142 143 |
Top |
Related drugs of malignant transformation related genes |
| Identification of chemicals and drugs interact with genes involved in malignant transfromation |
| (DGIdb 4.0) |
| Entrez ID | Symbol | Category | Interaction Types | Drug Claim Name | Drug Name | PMIDs |
| 6262 | RYR2 | B30_2 SPRY DOMAIN, DRUGGABLE GENOME, ION CHANNEL | Dantrolene | DANTROLENE | ||
| 6262 | RYR2 | B30_2 SPRY DOMAIN, DRUGGABLE GENOME, ION CHANNEL | activator | 135651219 | SURAMIN | |
| 6262 | RYR2 | B30_2 SPRY DOMAIN, DRUGGABLE GENOME, ION CHANNEL | simvastatin | SIMVASTATIN | 27839692,25753936 | |
| 6262 | RYR2 | B30_2 SPRY DOMAIN, DRUGGABLE GENOME, ION CHANNEL | cerivastatin | CERIVASTATIN | 21386754 | |
| 6262 | RYR2 | B30_2 SPRY DOMAIN, DRUGGABLE GENOME, ION CHANNEL | blocker | 178101108 | PROCAINE | |
| 6262 | RYR2 | B30_2 SPRY DOMAIN, DRUGGABLE GENOME, ION CHANNEL | activator | 135651446 | ADENOSINE TRIPHOSPHATE | |
| 6262 | RYR2 | B30_2 SPRY DOMAIN, DRUGGABLE GENOME, ION CHANNEL | inhibitor | 381118871 | ||
| 6262 | RYR2 | B30_2 SPRY DOMAIN, DRUGGABLE GENOME, ION CHANNEL | antagonist,activator | 135652731 | ||
| 6262 | RYR2 | B30_2 SPRY DOMAIN, DRUGGABLE GENOME, ION CHANNEL | inhibitor | 135650057 | CARVEDILOL | |
| 6262 | RYR2 | B30_2 SPRY DOMAIN, DRUGGABLE GENOME, ION CHANNEL | blocker,activator | 178101120 | RYANODINE |
| Page: 1 2 |

Copyright 2023-Present -The University of Texas Health Science Center at Houston |