Schematic overview of the cellular and molecular mechanisms involved in the cancer progression, including the proposed cellular and molecular mechanisms in cancer cells trajectory. AT1: alveolar type 1 cells; AT2: alveolar type 2 cells; AAH: atypical adenomatous hyperplasia; AIS: adenocarcinoma in situ; MIA: minimally invasive adenocarcinoma; IA: invasive adenocarcinoma; EMT: epithelial-mesenchymal transition

Home

Download

Statistics

Help

Contact

Center for Computational Systems Medicine
leaf

Gene summary

leaf

Malignant transformation analysis

leaf

Malignant transformation related pathway analysis

leaf

Cell-cell communication analysis

leaf

Single-cell gene regulatory network inference analysis

leaf

Somatic mutation of malignant transformation related genes

leaf

Related drugs of malignant transformation related genes

Gene: RYBP

Gene summary for RYBP

check button Gene summary.

Gene informationSpeciesHuman
Gene symbol

RYBP

Gene ID

23429

Gene nameRING1 and YY1 binding protein
Gene AliasAAP1
Cytomap3p13
Gene Typeprotein-coding
GO ID

GO:0000122

UniProtAcc

Q8N488


Top

Malignant transformation analysis

check button Identification of the aberrant gene expression in precancerous and cancerous lesions by comparing the gene expression of stem-like cells in diseased tissues with normal stem cells
check button Malignant transformation involving gene list.
Entrez IDSymbolReplicatesSpeciesOrganTissueAdj P-valueLog2FCMalignancy
23429RYBPHTA11_3410_2000001011HumanColorectumAD4.85e-12-4.61e-010.0155
23429RYBPHTA11_3361_2000001011HumanColorectumAD9.71e-05-4.91e-01-0.1207
23429RYBPHTA11_866_3004761011HumanColorectumAD1.54e-07-4.30e-010.096
23429RYBPHTA11_7696_3000711011HumanColorectumAD6.69e-06-3.43e-010.0674
23429RYBPHTA11_99999974143_84620HumanColorectumMSS7.74e-07-4.11e-010.3005
23429RYBPA001-C-207HumanColorectumFAP6.57e-03-2.65e-010.1278
23429RYBPA015-C-203HumanColorectumFAP2.75e-19-3.97e-01-0.1294
23429RYBPA015-C-204HumanColorectumFAP9.88e-06-2.69e-01-0.0228
23429RYBPA014-C-040HumanColorectumFAP6.75e-05-4.78e-01-0.1184
23429RYBPA002-C-201HumanColorectumFAP1.03e-11-3.50e-010.0324
23429RYBPA001-C-119HumanColorectumFAP1.36e-13-5.53e-01-0.1557
23429RYBPA001-C-108HumanColorectumFAP3.32e-13-4.76e-01-0.0272
23429RYBPA002-C-205HumanColorectumFAP2.69e-23-5.36e-01-0.1236
23429RYBPA001-C-104HumanColorectumFAP1.16e-04-3.47e-010.0184
23429RYBPA015-C-005HumanColorectumFAP9.67e-10-4.17e-01-0.0336
23429RYBPA015-C-006HumanColorectumFAP5.18e-16-5.22e-01-0.0994
23429RYBPA015-C-106HumanColorectumFAP2.85e-09-3.65e-01-0.0511
23429RYBPA002-C-114HumanColorectumFAP8.03e-17-4.51e-01-0.1561
23429RYBPA015-C-104HumanColorectumFAP1.68e-24-5.51e-01-0.1899
23429RYBPA001-C-014HumanColorectumFAP4.70e-10-3.80e-010.0135
Page: 1 2 3 4 5 6 

check button Transcriptomic changes along malignancy continuum.
TissueExpression DynamicsAbbreviation
Colorectum (GSE201348)The image shows the transcriptomic changes along malignancy continuum.log2FC in expression of this searched gene in stem-like cells from each diseased tissue sample relative to stem-like cells in normal samples in each tissue plotted against the malignancy continuum. Samples are colored based on if they are from different disease stage.FAP: Familial adenomatous polyposis
CRC: Colorectal cancer
Colorectum (HTA11)The image shows the transcriptomic changes along malignancy continuum.log2FC in expression of this searched gene in stem-like cells from each diseased tissue sample relative to stem-like cells in normal samples in each tissue plotted against the malignancy continuum. Samples are colored based on if they are from different disease stage.AD: Adenomas
SER: Sessile serrated lesions
MSI-H: Microsatellite-high colorectal cancer
MSS: Microsatellite stable colorectal cancer
EndometriumThe image shows the transcriptomic changes along malignancy continuum.log2FC in expression of this searched gene in stem-like cells from each diseased tissue sample relative to stem-like cells in normal samples in each tissue plotted against the malignancy continuum. Samples are colored based on if they are from different disease stage.
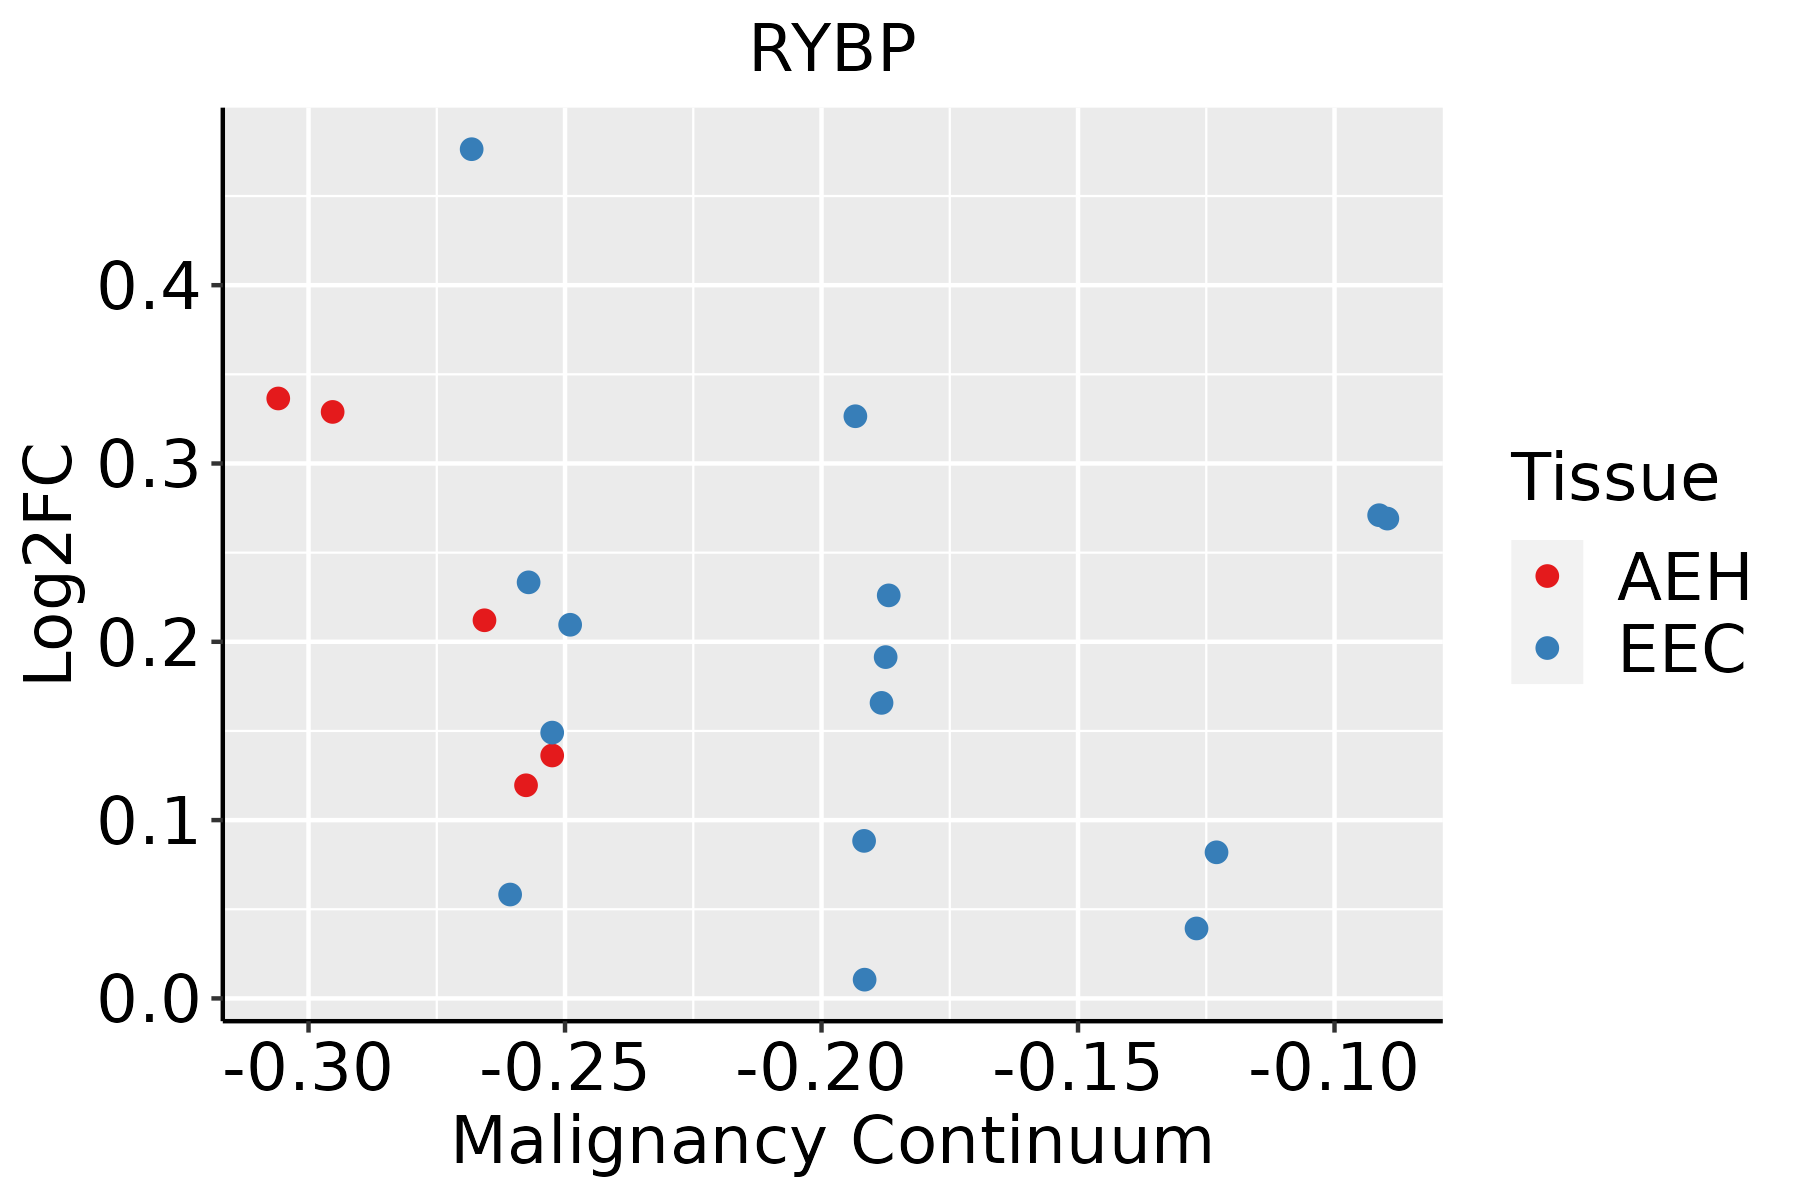
AEH: Atypical endometrial hyperplasia
EEC: Endometrioid Cancer
LiverThe image shows the transcriptomic changes along malignancy continuum.log2FC in expression of this searched gene in stem-like cells from each diseased tissue sample relative to stem-like cells in normal samples in each tissue plotted against the malignancy continuum. Samples are colored based on if they are from different disease stage.
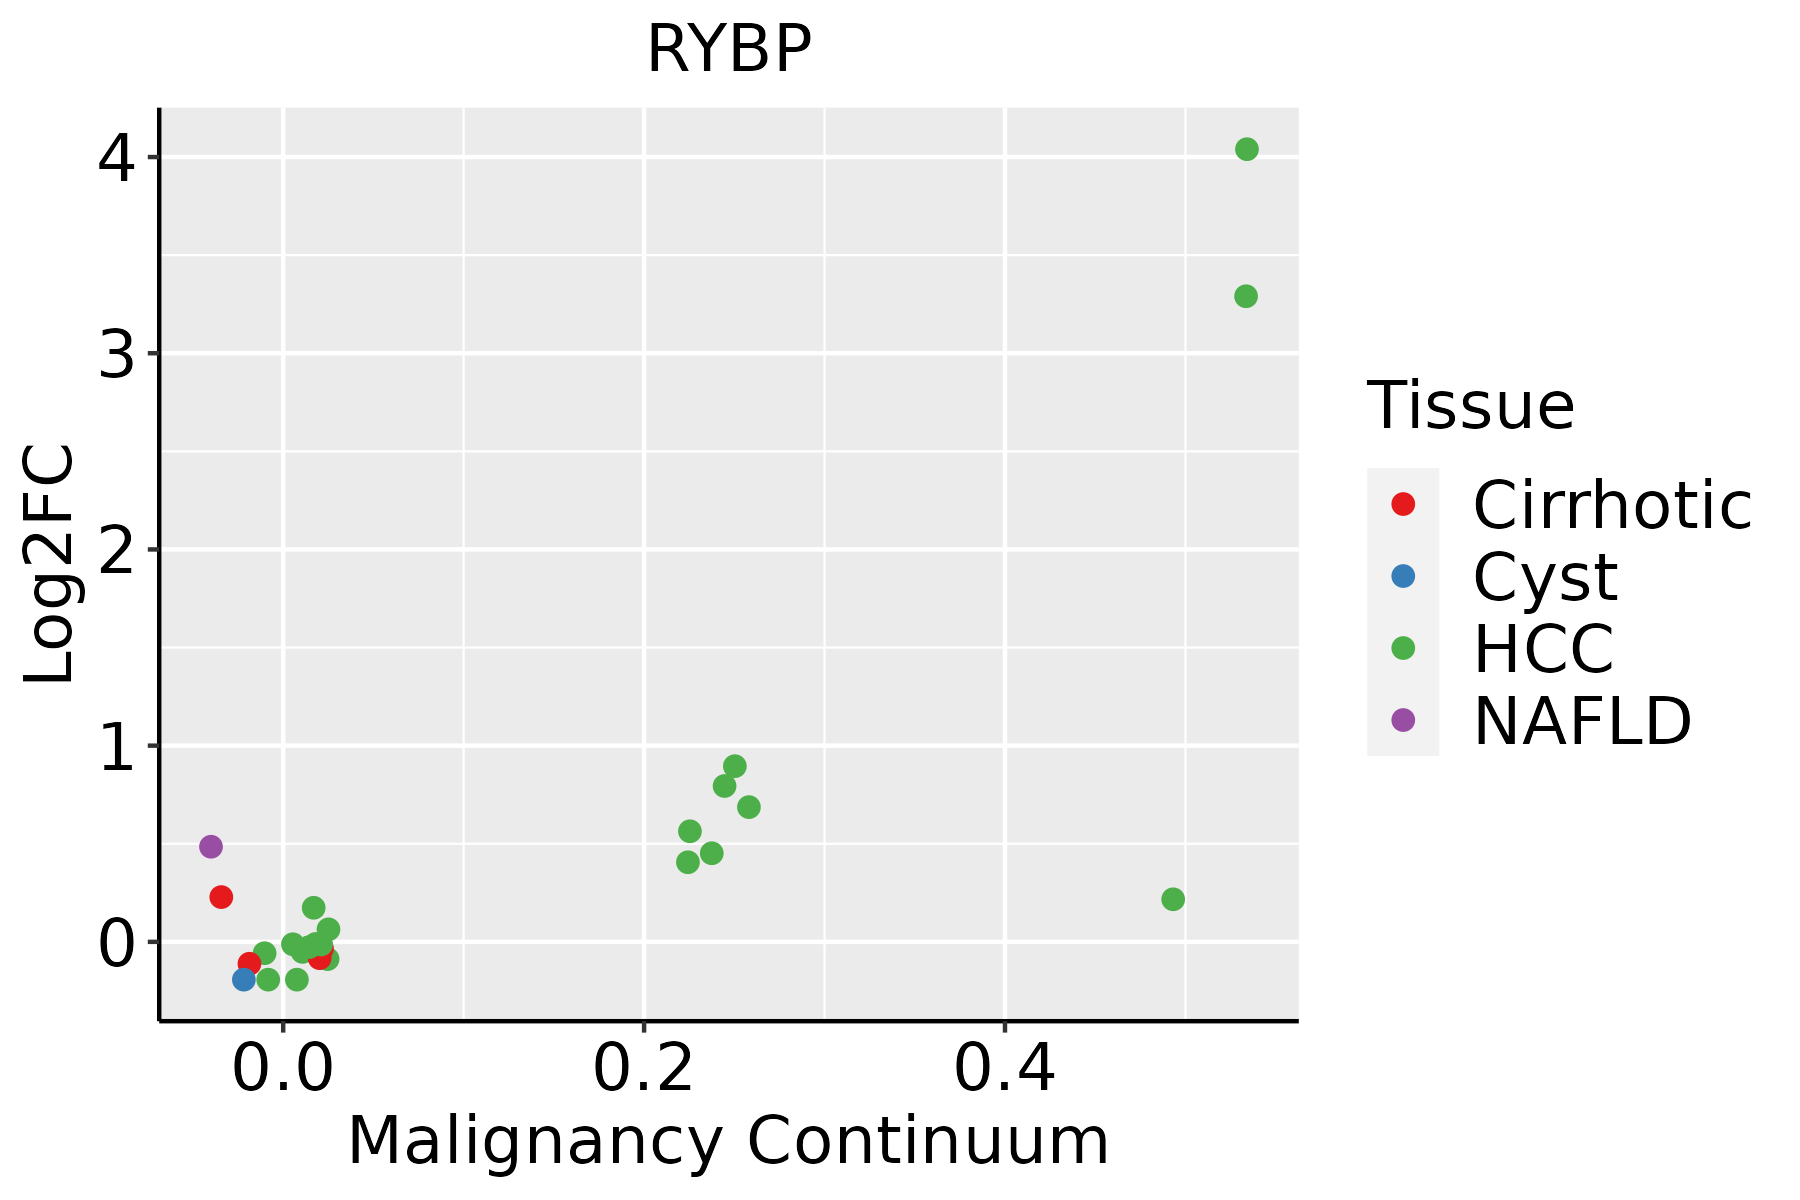
HCC: Hepatocellular carcinoma
NAFLD: Non-alcoholic fatty liver disease
LungThe image shows the transcriptomic changes along malignancy continuum.log2FC in expression of this searched gene in stem-like cells from each diseased tissue sample relative to stem-like cells in normal samples in each tissue plotted against the malignancy continuum. Samples are colored based on if they are from different disease stage.
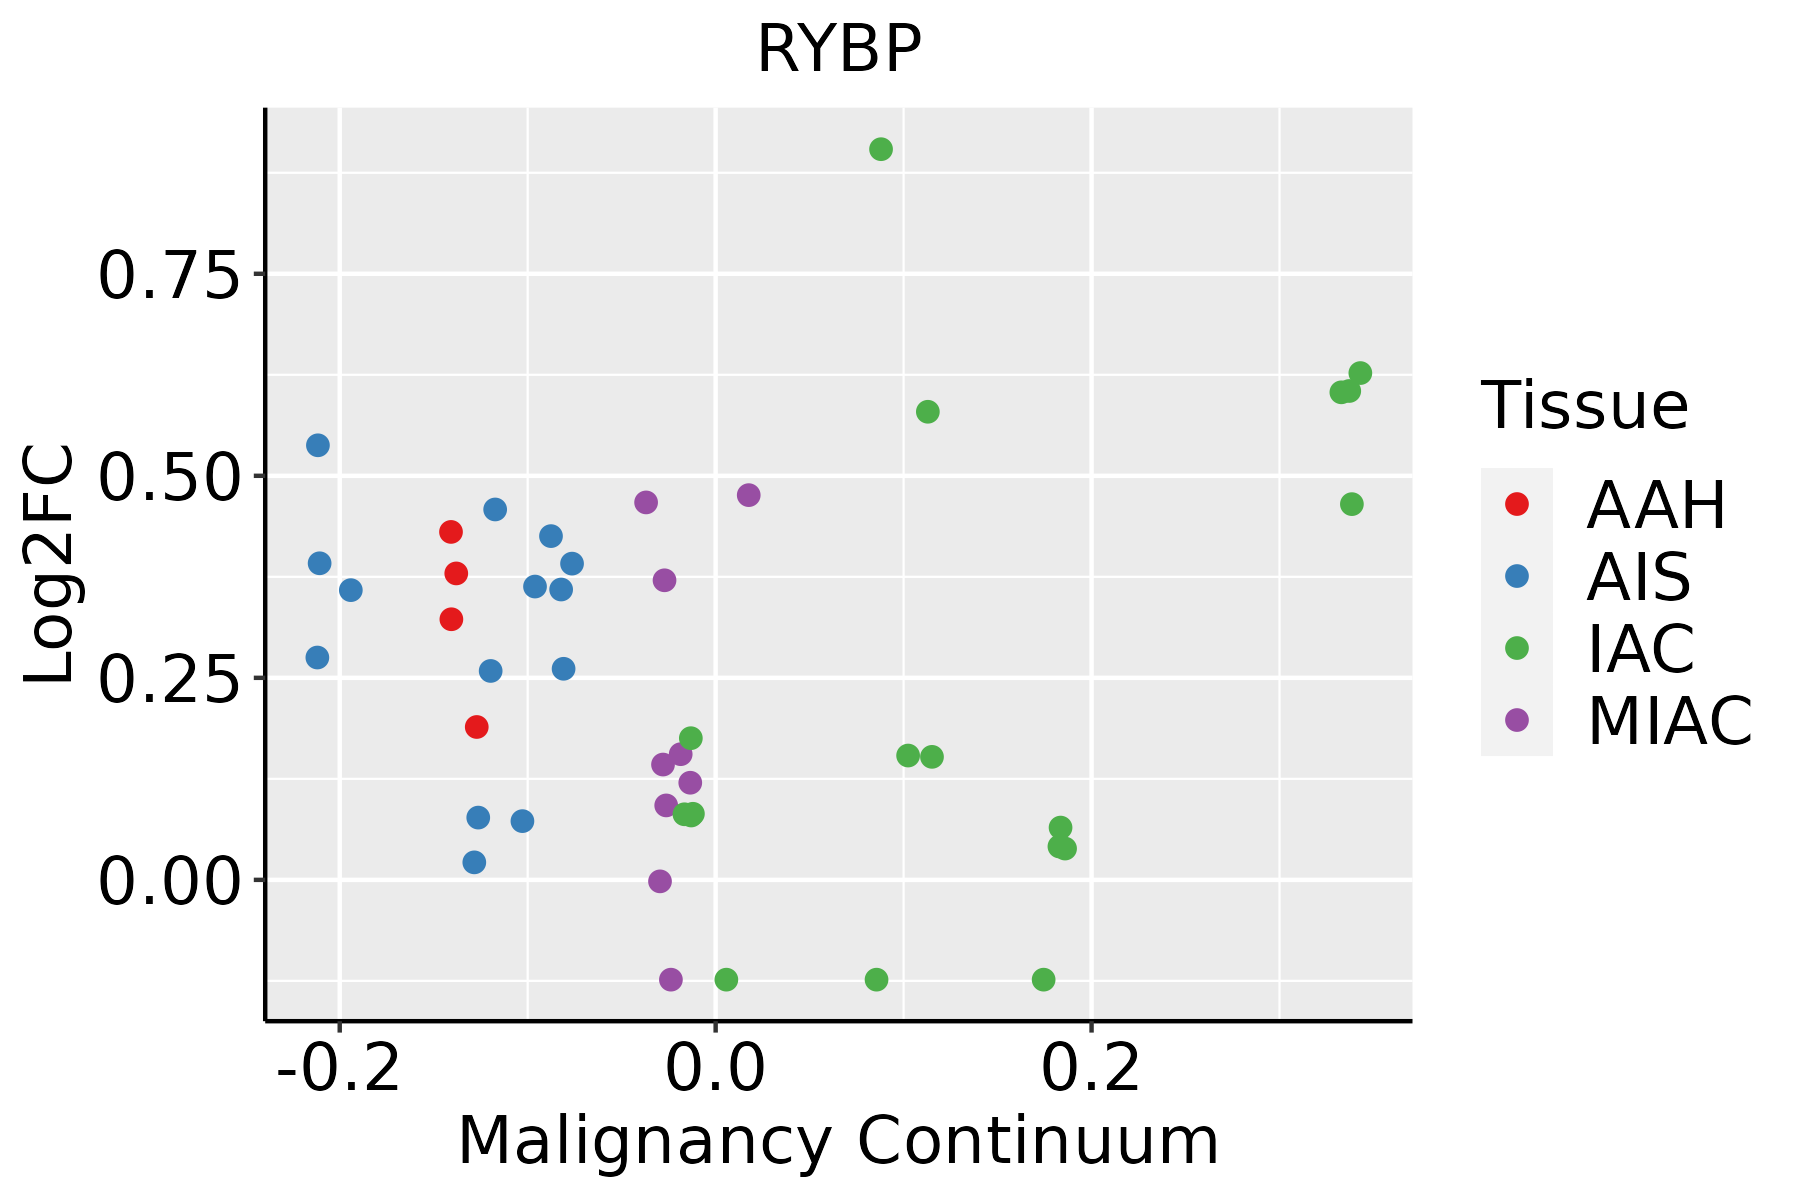
AAH: Atypical adenomatous hyperplasia
AIS: Adenocarcinoma in situ
IAC: Invasive lung adenocarcinoma
MIA: Minimally invasive adenocarcinoma
Oral CavityThe image shows the transcriptomic changes along malignancy continuum.log2FC in expression of this searched gene in stem-like cells from each diseased tissue sample relative to stem-like cells in normal samples in each tissue plotted against the malignancy continuum. Samples are colored based on if they are from different disease stage.
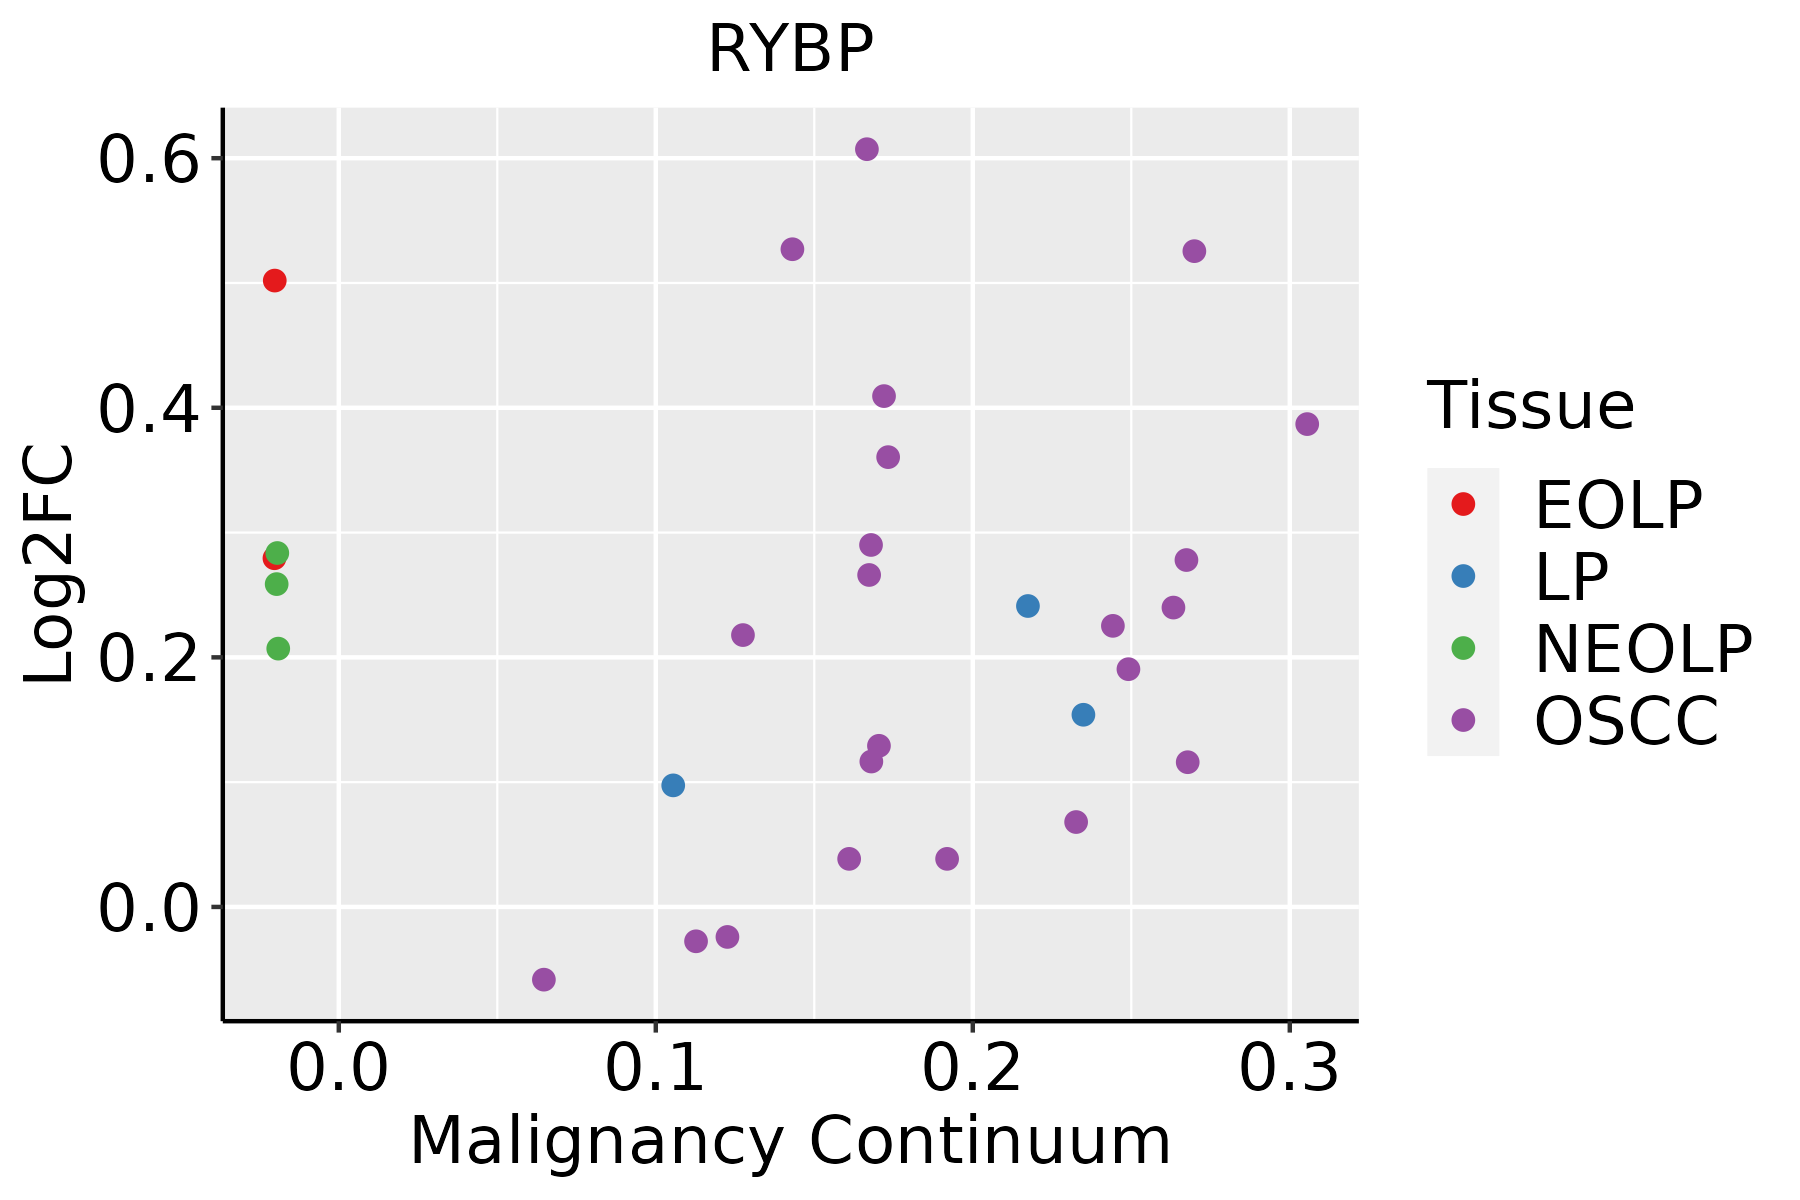
EOLP: Erosive Oral lichen planus
LP: leukoplakia
NEOLP: Non-erosive oral lichen planus
OSCC: Oral squamous cell carcinoma
ProstateThe image shows the transcriptomic changes along malignancy continuum.log2FC in expression of this searched gene in stem-like cells from each diseased tissue sample relative to stem-like cells in normal samples in each tissue plotted against the malignancy continuum. Samples are colored based on if they are from different disease stage.BPH: Benign Prostatic Hyperplasia
ThyroidThe image shows the transcriptomic changes along malignancy continuum.log2FC in expression of this searched gene in stem-like cells from each diseased tissue sample relative to stem-like cells in normal samples in each tissue plotted against the malignancy continuum. Samples are colored based on if they are from different disease stage.
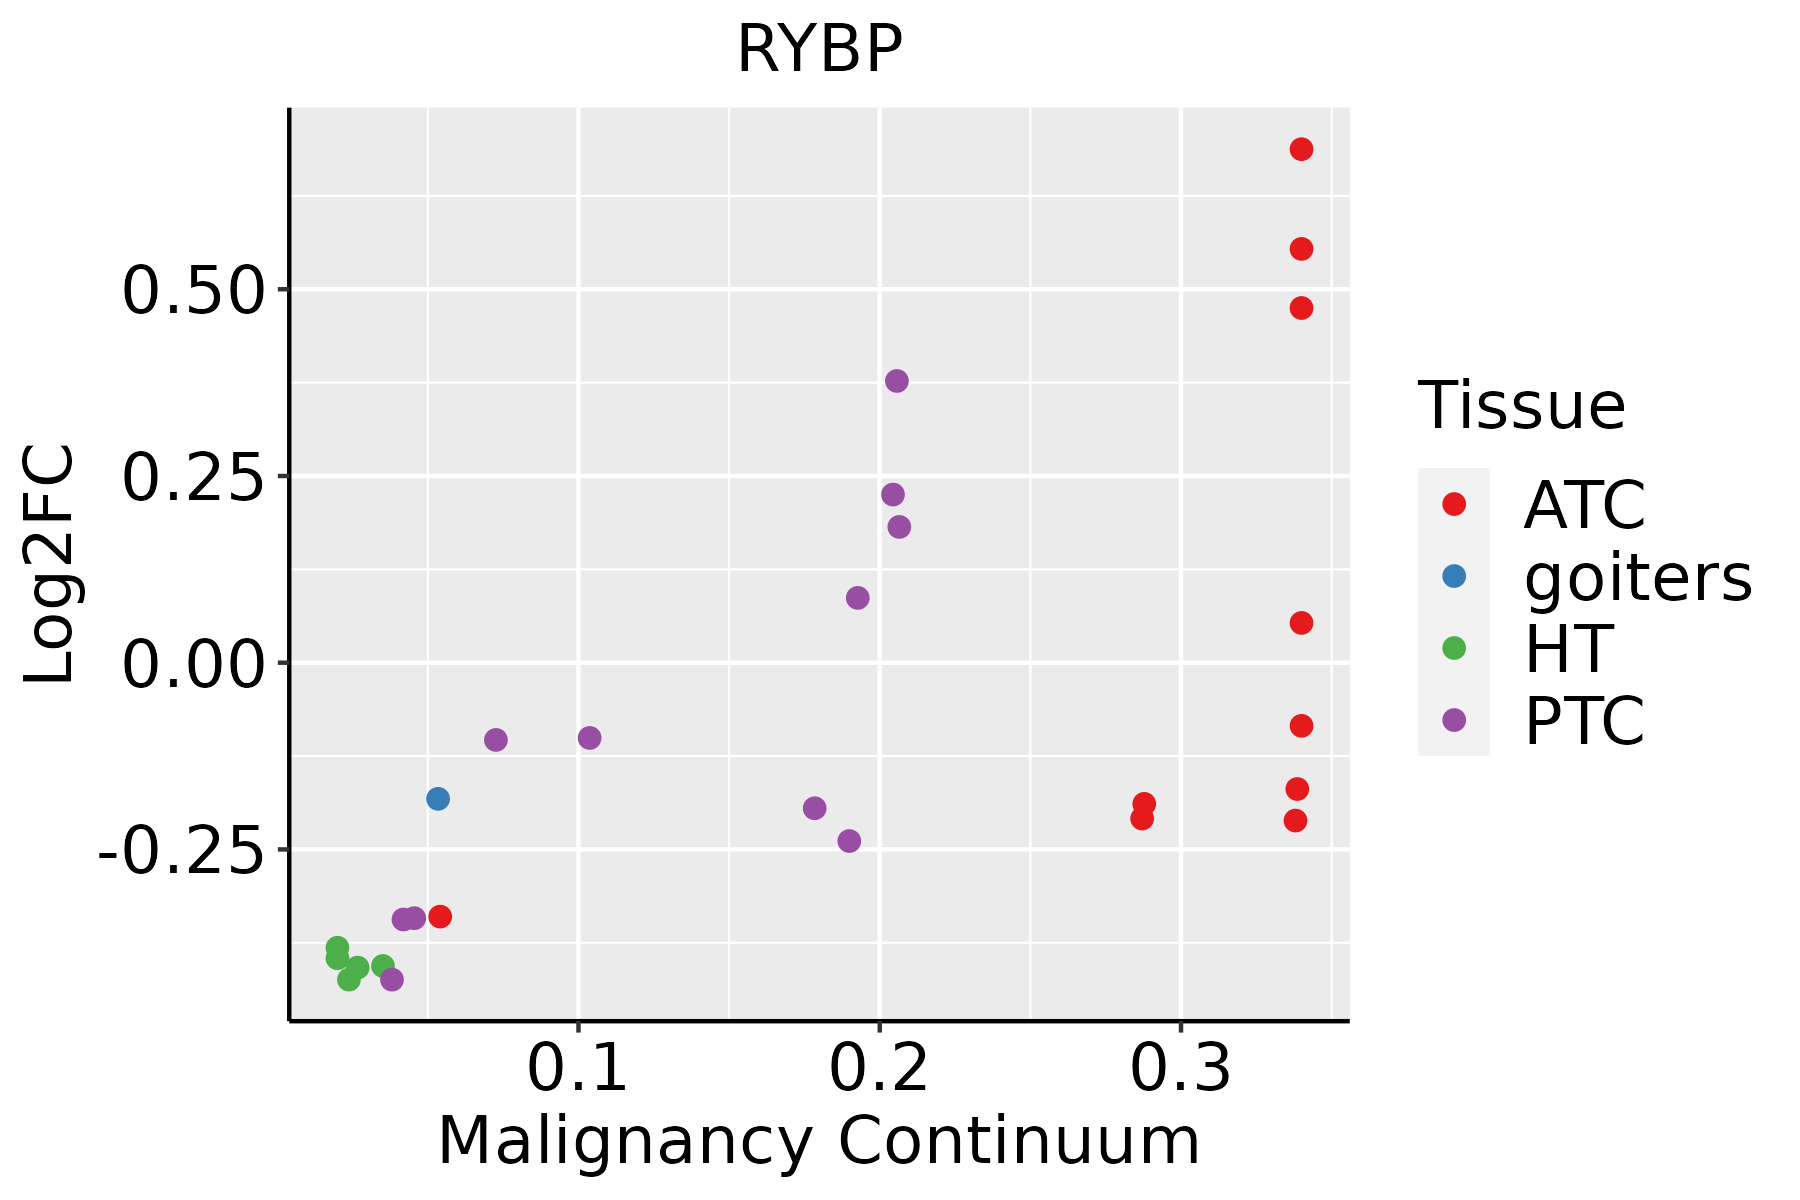
ATC: Anaplastic thyroid cancer
HT: Hashimoto's thyroiditis
PTC: Papillary thyroid cancer
∗log2FC in expression of this searched gene in stem-like cells from each diseased tissue sample relative to stem-like cells in normal samples in each tissue plotted against the malignancy continuum. Samples are colored based on if they are from different disease stage.

Top

Malignant transformation related pathway analysis

check buttonFind out the enriched GO biological processes and KEGG pathways involved in transition from healthy to precancer to cancer
check button Figure of enriched GO biological processes.
TissueDisease StageEnriched GO biological Processes
ColorectumADGO analysis - Figure of enriched GO biological processes: Top 15 enriched GO BP terms are showed in the bar plot of each disease state in each tissue. Each row represents a significant GO biological process which is colored according to the -log10(p.adjust).
ColorectumSERGO analysis - Figure of enriched GO biological processes: Top 15 enriched GO BP terms are showed in the bar plot of each disease state in each tissue. Each row represents a significant GO biological process which is colored according to the -log10(p.adjust).
ColorectumMSSGO analysis - Figure of enriched GO biological processes: Top 15 enriched GO BP terms are showed in the bar plot of each disease state in each tissue. Each row represents a significant GO biological process which is colored according to the -log10(p.adjust).
ColorectumMSI-HGO analysis - Figure of enriched GO biological processes: Top 15 enriched GO BP terms are showed in the bar plot of each disease state in each tissue. Each row represents a significant GO biological process which is colored according to the -log10(p.adjust).
ColorectumFAPGO analysis - Figure of enriched GO biological processes: Top 15 enriched GO BP terms are showed in the bar plot of each disease state in each tissue. Each row represents a significant GO biological process which is colored according to the -log10(p.adjust).
∗Top 15 enriched GO BP terms are showed in the bar plot of each disease state in each tissue. Each row represents a significant GO biological process which is colored according to the -log10(p.adjust).
Page: 1 2 3 4 5 6 7 8 9 

check button Enriched GO biological processes.
GO IDTissueDisease StageDescriptionGene RatioBg Ratiopvaluep.adjustCount
GO:0042176ColorectumADregulation of protein catabolic process160/3918391/187231.06e-197.34e-17160
GO:1903362ColorectumADregulation of cellular protein catabolic process109/3918255/187232.14e-156.08e-13109
GO:0010498ColorectumADproteasomal protein catabolic process174/3918490/187233.18e-147.66e-12174
GO:0009895ColorectumADnegative regulation of catabolic process124/3918320/187231.66e-133.35e-11124
GO:1903050ColorectumADregulation of proteolysis involved in cellular protein catabolic process92/3918221/187232.04e-123.19e-1092
GO:0031330ColorectumADnegative regulation of cellular catabolic process104/3918262/187232.66e-123.96e-10104
GO:0043161ColorectumADproteasome-mediated ubiquitin-dependent protein catabolic process141/3918412/187231.77e-101.68e-08141
GO:0042177ColorectumADnegative regulation of protein catabolic process55/3918121/187231.19e-098.85e-0855
GO:0061136ColorectumADregulation of proteasomal protein catabolic process75/3918187/187231.65e-091.20e-0775
GO:2000058ColorectumADregulation of ubiquitin-dependent protein catabolic process68/3918164/187231.82e-091.31e-0768
GO:1903363ColorectumADnegative regulation of cellular protein catabolic process39/391875/187232.69e-091.87e-0739
GO:0032434ColorectumADregulation of proteasomal ubiquitin-dependent protein catabolic process54/3918134/187232.51e-071.02e-0554
GO:1903051ColorectumADnegative regulation of proteolysis involved in cellular protein catabolic process31/391864/187238.71e-072.98e-0531
GO:2000059ColorectumADnegative regulation of ubiquitin-dependent protein catabolic process24/391848/187237.38e-061.81e-0424
GO:0045861ColorectumADnegative regulation of proteolysis106/3918351/187232.33e-054.57e-04106
GO:1901799ColorectumADnegative regulation of proteasomal protein catabolic process23/391849/187234.18e-057.37e-0423
GO:0032435ColorectumADnegative regulation of proteasomal ubiquitin-dependent protein catabolic process18/391835/187236.33e-051.05e-0318
GO:0033522ColorectumADhistone H2A ubiquitination12/391826/187233.47e-032.51e-0212
GO:0006513ColorectumADprotein monoubiquitination23/391867/187237.55e-034.58e-0223
GO:00421762ColorectumMSSregulation of protein catabolic process145/3467391/187232.03e-181.17e-15145
Page: 1 2 3 4 5 6 7 8 9 10 11 12 13 14 15 16 17 18 

check button Enriched KEGG pathways.
Pathway IDTissueDisease StageDescriptionGene RatioBg Ratiopvaluep.adjustqvalueCount
Page: 1 

Top

Cell-cell communication analysis

check buttonIdentification of potential cell-cell interactions between two cell types and their ligand-receptor pairs for different disease states
LigandReceptorLRpairPathwayTissueDisease Stage
Page: 1 

Top

Single-cell gene regulatory network inference analysis

check buttonFind out the significant the regulons (TFs) and the target genes of each regulon across cell types for different disease states
TFCell TypeTissueDisease StageTarget GeneRSSRegulon Activity
∗The dot plots of a searched regulon are shown for all cell subpopulations in each disease state of each tissue based on the regulon specific score inferred using pySCENIC and by calculating the average expression.
Page: 1 

Top

Somatic mutation of malignant transformation related genes

check buttonAnnotation of somatic variants for genes involved in malignant transformation
Hugo SymbolVariant ClassVariant ClassificationdbSNP RSHGVScHGVSpHGVSp ShortSWISSPROTBIOTYPESIFTPolyPhenTumor Sample BarcodeTissueHistologySexAgeStageTherapy TypesDrugsOutcome
RYBPSNVMissense_Mutationnovelc.470G>Ap.Val158Ilep.V158IQ8N488protein_codingdeleterious(0)probably_damaging(0.991)TCGA-A8-A08R-01Breastbreast invasive carcinomaFemale<65I/IIUnknownUnknownSD
RYBPSNVMissense_Mutationnovelc.247G>Cp.Glu83Aspp.E83DQ8N488protein_codingtolerated(0.57)benign(0)TCGA-AR-A2LH-01Breastbreast invasive carcinomaFemale<65III/IVChemotherapyadriamycinPD
RYBPinsertionFrame_Shift_Insnovelc.459_460insTTCTATTTCATTCTCTTCAp.Asn155SerfsTer16p.N155Sfs*16Q8N488protein_codingTCGA-AO-A0J9-01Breastbreast invasive carcinomaFemale<65III/IVChemotherapycyclophosphamidePD
RYBPinsertionNonsense_Mutationnovelc.458_459insACATAAAGATAGCTTGAGTAAACTp.Gly154delinsAspIleLysIleAlaTerValAsnCysp.G154delinsDIKIA*VNCQ8N488protein_codingTCGA-AO-A0J9-01Breastbreast invasive carcinomaFemale<65III/IVChemotherapycyclophosphamidePD
RYBPSNVMissense_Mutationnovelc.515T>Cp.Ser173Prop.S173PQ8N488protein_codingdeleterious(0.05)benign(0.127)TCGA-AA-A010-01Colorectumcolon adenocarcinomaFemale<65I/IIChemotherapyfolinicCR
RYBPSNVMissense_Mutationc.407C>Tp.Arg137Trpp.R137WQ8N488protein_codingdeleterious(0.01)probably_damaging(0.916)TCGA-AZ-4313-01Colorectumcolon adenocarcinomaFemale<65I/IIUnknownUnknownSD
RYBPSNVMissense_Mutationnovelc.570N>Tp.Ser191Leup.S191LQ8N488protein_codingdeleterious(0)probably_damaging(0.99)TCGA-AZ-4315-01Colorectumcolon adenocarcinomaMale<65I/IIUnknownUnknownSD
RYBPSNVMissense_Mutationnovelc.282N>Cp.Lys95Thrp.K95TQ8N488protein_codingdeleterious(0)probably_damaging(0.937)TCGA-CA-6717-01Colorectumcolon adenocarcinomaMale<65I/IIChemotherapyoxaliplatinCR
RYBPSNVMissense_Mutationnovelc.132N>Ap.Pro45Hisp.P45HQ8N488protein_codingdeleterious(0)probably_damaging(0.991)TCGA-A5-A1OF-01Endometriumuterine corpus endometrioid carcinomaFemale<65I/IIUnknownUnknownSD
RYBPSNVMissense_Mutationnovelc.144N>Tp.Ser49Phep.S49FQ8N488protein_codingdeleterious(0)probably_damaging(0.989)TCGA-AX-A05Z-01Endometriumuterine corpus endometrioid carcinomaFemale<65III/IVChemotherapyadriamycinSD
Page: 1 2 3 

Top

Related drugs of malignant transformation related genes

check buttonIdentification of chemicals and drugs interact with genes involved in malignant transfromation
(DGIdb 4.0)
Entrez IDSymbolCategoryInteraction TypesDrug Claim NameDrug NamePMIDs
Page: 1