
|
|||||
|
 | |
| |
| |
| |
| |
| |
|
Gene: RXRG |
Gene summary for RXRG |
| Gene information | Species | Human | Gene symbol | RXRG | Gene ID | 6258 |
| Gene name | retinoid X receptor gamma | |
| Gene Alias | NR2B3 | |
| Cytomap | 1q23.3 | |
| Gene Type | protein-coding | GO ID | GO:0006139 | UniProtAcc | A0A087WZ88 |
Top |
Malignant transformation analysis |
| Identification of the aberrant gene expression in precancerous and cancerous lesions by comparing the gene expression of stem-like cells in diseased tissues with normal stem cells |
| Entrez ID | Symbol | Replicates | Species | Organ | Tissue | Adj P-value | Log2FC | Malignancy |
| 6258 | RXRG | male-WTA | Human | Thyroid | PTC | 2.83e-29 | 3.81e-01 | 0.1037 |
| 6258 | RXRG | PTC01 | Human | Thyroid | PTC | 2.83e-29 | 5.69e-01 | 0.1899 |
| 6258 | RXRG | PTC04 | Human | Thyroid | PTC | 3.28e-16 | 3.39e-01 | 0.1927 |
| 6258 | RXRG | PTC05 | Human | Thyroid | PTC | 7.16e-14 | 5.31e-01 | 0.2065 |
| 6258 | RXRG | PTC06 | Human | Thyroid | PTC | 3.97e-14 | 3.43e-01 | 0.2057 |
| 6258 | RXRG | PTC07 | Human | Thyroid | PTC | 1.12e-33 | 5.97e-01 | 0.2044 |
| 6258 | RXRG | ATC13 | Human | Thyroid | ATC | 1.51e-53 | 1.25e+00 | 0.34 |
| 6258 | RXRG | ATC5 | Human | Thyroid | ATC | 5.26e-62 | 1.34e+00 | 0.34 |
| Page: 1 |
| Tissue | Expression Dynamics | Abbreviation |
| Oral Cavity | 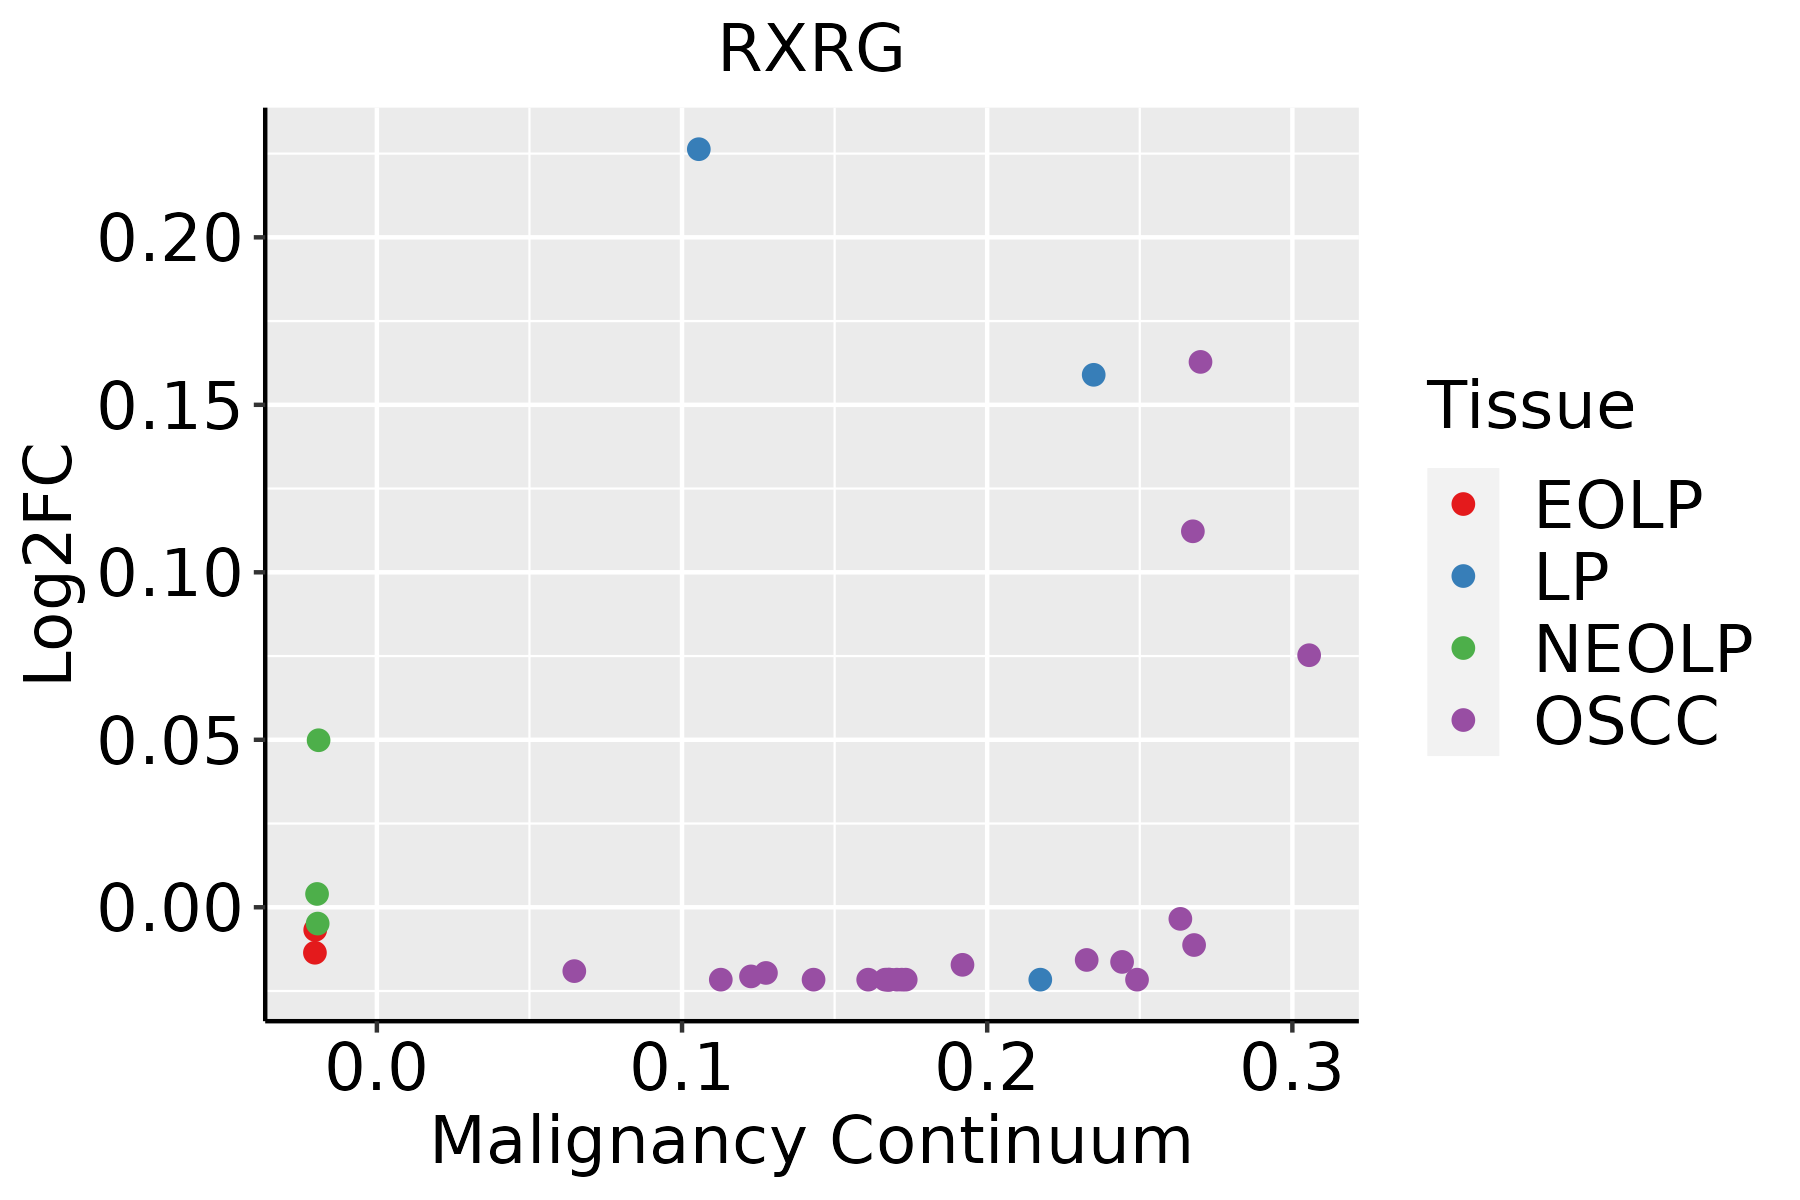 | EOLP: Erosive Oral lichen planus |
| LP: leukoplakia | ||
| NEOLP: Non-erosive oral lichen planus | ||
| OSCC: Oral squamous cell carcinoma | ||
| Thyroid | 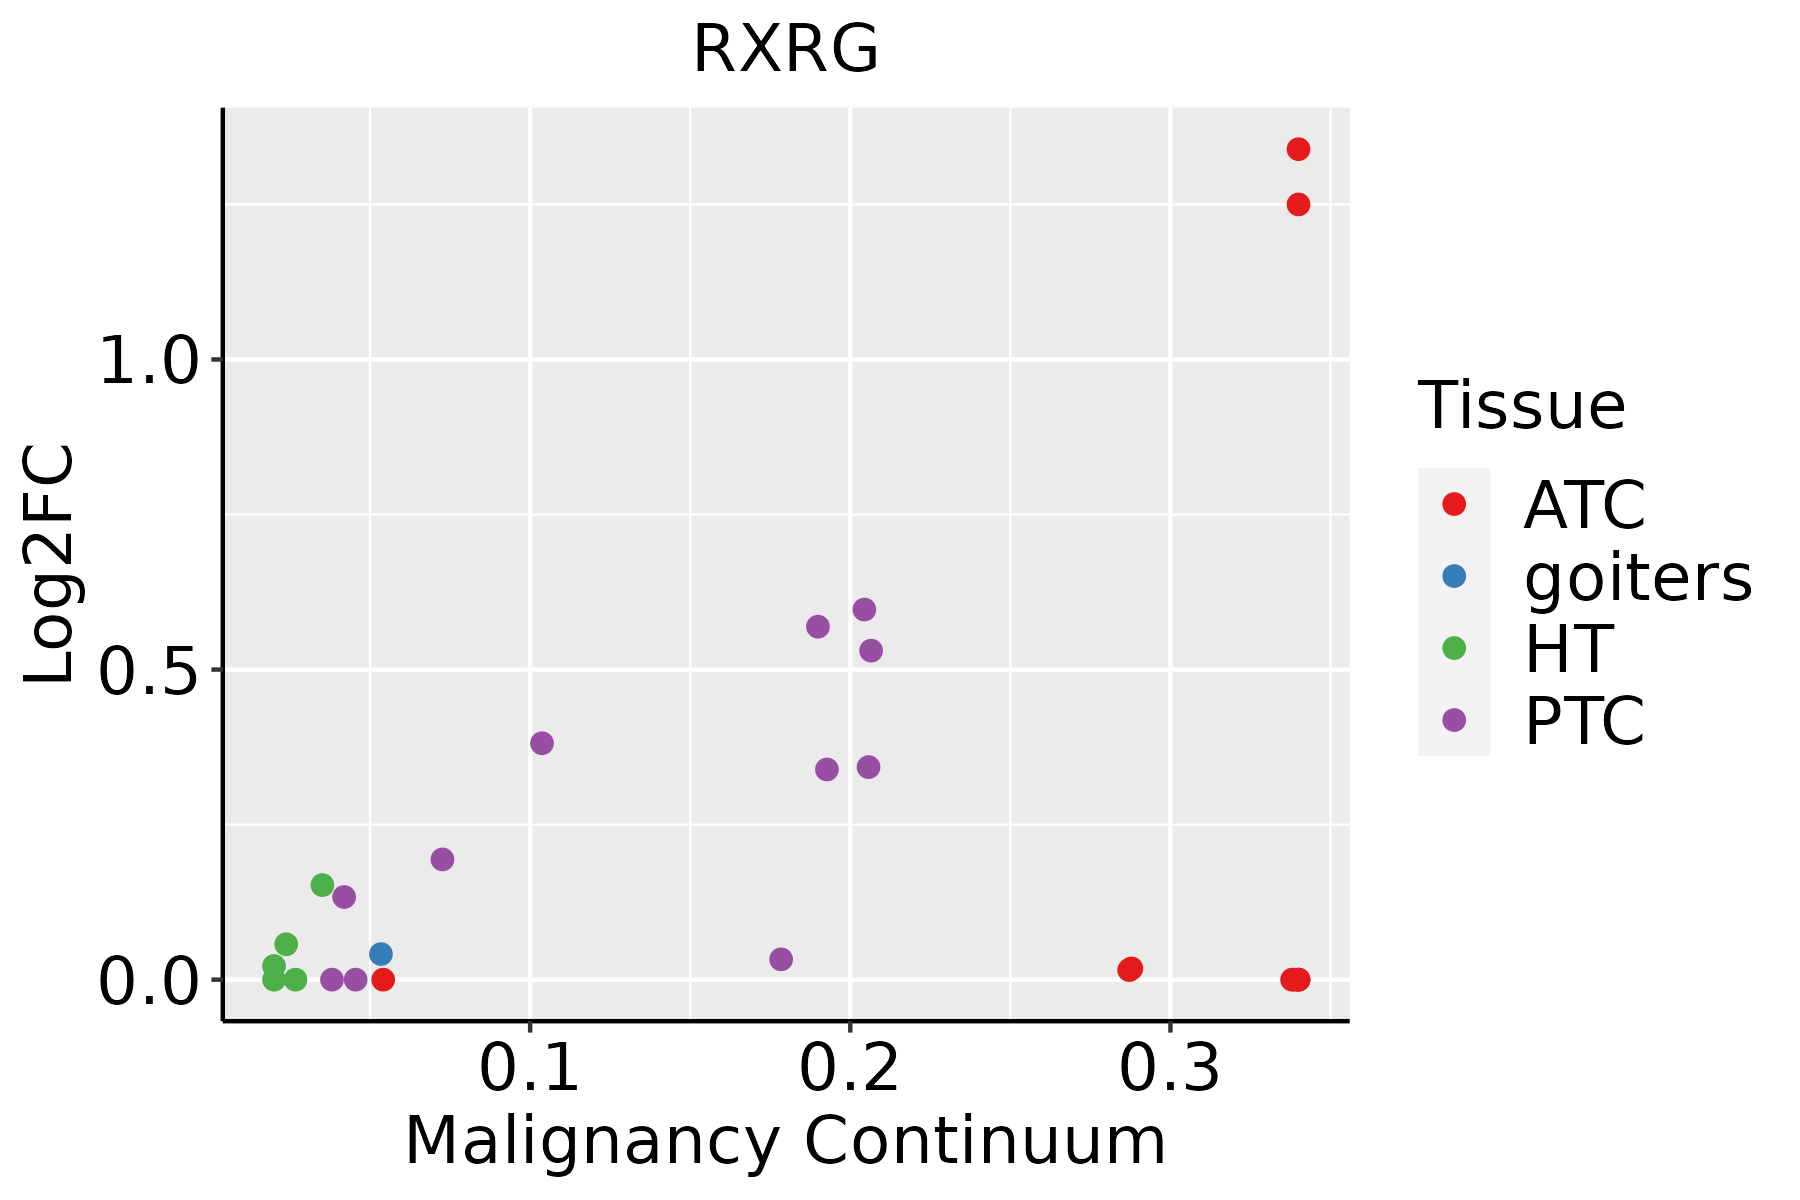 | ATC: Anaplastic thyroid cancer |
| HT: Hashimoto's thyroiditis | ||
| PTC: Papillary thyroid cancer |
| ∗log2FC in expression of this searched gene in stem-like cells from each diseased tissue sample relative to stem-like cells in normal samples in each tissue plotted against the malignancy continuum. Samples are colored based on if they are from different disease stage. |
Top |
Malignant transformation related pathway analysis |
| Find out the enriched GO biological processes and KEGG pathways involved in transition from healthy to precancer to cancer |
| Tissue | Disease Stage | Enriched GO biological Processes |
| Colorectum | AD |  |
| Colorectum | SER |  |
| Colorectum | MSS |  |
| Colorectum | MSI-H |  |
| Colorectum | FAP |  |
| ∗Top 15 enriched GO BP terms are showed in the bar plot of each disease state in each tissue. Each row represents a significant GO biological process which is colored according to the -log10(p.adjust). |
| Page: 1 2 3 4 5 6 7 8 9 |
| GO ID | Tissue | Disease Stage | Description | Gene Ratio | Bg Ratio | pvalue | p.adjust | Count |
| GO:0048545113 | Thyroid | PTC | response to steroid hormone | 158/5968 | 339/18723 | 8.10e-09 | 2.00e-07 | 158 |
| GO:003052228 | Thyroid | PTC | intracellular receptor signaling pathway | 126/5968 | 265/18723 | 6.31e-08 | 1.31e-06 | 126 |
| GO:0071383112 | Thyroid | PTC | cellular response to steroid hormone stimulus | 98/5968 | 204/18723 | 9.83e-07 | 1.47e-05 | 98 |
| GO:004340124 | Thyroid | PTC | steroid hormone mediated signaling pathway | 69/5968 | 136/18723 | 3.57e-06 | 4.58e-05 | 69 |
| GO:000975519 | Thyroid | PTC | hormone-mediated signaling pathway | 80/5968 | 190/18723 | 1.84e-03 | 9.91e-03 | 80 |
| GO:0048545210 | Thyroid | ATC | response to steroid hormone | 168/6293 | 339/18723 | 7.21e-10 | 1.88e-08 | 168 |
| GO:0030522112 | Thyroid | ATC | intracellular receptor signaling pathway | 134/6293 | 265/18723 | 7.58e-09 | 1.63e-07 | 134 |
| GO:007138328 | Thyroid | ATC | cellular response to steroid hormone stimulus | 103/6293 | 204/18723 | 4.32e-07 | 6.30e-06 | 103 |
| GO:0043401111 | Thyroid | ATC | steroid hormone mediated signaling pathway | 71/6293 | 136/18723 | 5.72e-06 | 6.07e-05 | 71 |
| GO:0009755110 | Thyroid | ATC | hormone-mediated signaling pathway | 83/6293 | 190/18723 | 2.34e-03 | 1.09e-02 | 83 |
| Page: 1 |
| Pathway ID | Tissue | Disease Stage | Description | Gene Ratio | Bg Ratio | pvalue | p.adjust | qvalue | Count |
| Page: 1 |
Top |
Cell-cell communication analysis |
| Identification of potential cell-cell interactions between two cell types and their ligand-receptor pairs for different disease states |
| Ligand | Receptor | LRpair | Pathway | Tissue | Disease Stage |
| Page: 1 |
Top |
Single-cell gene regulatory network inference analysis |
| Find out the significant the regulons (TFs) and the target genes of each regulon across cell types for different disease states |
| TF | Cell Type | Tissue | Disease Stage | Target Gene | RSS | Regulon Activity |
| RXRG | iATC | Thyroid | HT | PBX1,ENC1,ZCCHC12, etc. | 4.66e-02 |  |
| RXRG | ECM | Thyroid | ADJ | PLAC9,PLTP,SNCA, etc. | 5.58e-01 |  |
| RXRG | INFIB | Thyroid | Healthy | PLAC9,PLTP,SNCA, etc. | 4.33e-02 |  |
| RXRG | ECM | Thyroid | PTC | PLAC9,PLTP,SNCA, etc. | 3.64e-01 |  |
| ∗The dot plots of a searched regulon are shown for all cell subpopulations in each disease state of each tissue based on the regulon specific score inferred using pySCENIC and by calculating the average expression. |
| Page: 1 |
Top |
Somatic mutation of malignant transformation related genes |
| Annotation of somatic variants for genes involved in malignant transformation |
| Hugo Symbol | Variant Class | Variant Classification | dbSNP RS | HGVSc | HGVSp | HGVSp Short | SWISSPROT | BIOTYPE | SIFT | PolyPhen | Tumor Sample Barcode | Tissue | Histology | Sex | Age | Stage | Therapy Types | Drugs | Outcome |
| RXRG | SNV | Missense_Mutation | novel | c.383N>T | p.Ser128Phe | p.S128F | P48443 | protein_coding | tolerated(0.46) | possibly_damaging(0.77) | TCGA-5L-AAT1-01 | Breast | breast invasive carcinoma | Female | <65 | III/IV | Hormone Therapy | letrozol | SD |
| RXRG | SNV | Missense_Mutation | novel | c.566N>C | p.Asn189Thr | p.N189T | P48443 | protein_coding | deleterious(0) | probably_damaging(0.994) | TCGA-A8-A096-01 | Breast | breast invasive carcinoma | Female | >=65 | I/II | Unknown | Unknown | SD |
| RXRG | SNV | Missense_Mutation | novel | c.566N>C | p.Asn189Thr | p.N189T | P48443 | protein_coding | deleterious(0) | probably_damaging(0.994) | TCGA-AQ-A1H3-01 | Breast | breast invasive carcinoma | Female | <65 | III/IV | Chemotherapy | adriamycin | SD |
| RXRG | SNV | Missense_Mutation | c.211N>G | p.Arg71Gly | p.R71G | P48443 | protein_coding | tolerated_low_confidence(0.14) | benign(0.306) | TCGA-BH-A0HP-01 | Breast | breast invasive carcinoma | Female | >=65 | III/IV | Chemotherapy | doxorubicin | SD | |
| RXRG | SNV | Missense_Mutation | c.232G>C | p.Gly78Arg | p.G78R | P48443 | protein_coding | deleterious(0) | probably_damaging(0.955) | TCGA-E2-A1L7-01 | Breast | breast invasive carcinoma | Female | <65 | III/IV | Chemotherapy | cyclophosphamide | PD | |
| RXRG | insertion | Nonsense_Mutation | novel | c.461_462insGGAGACGGTC | p.Tyr154Ter | p.Y154* | P48443 | protein_coding | TCGA-AR-A0U0-01 | Breast | breast invasive carcinoma | Female | >=65 | I/II | Unknown | Unknown | SD | ||
| RXRG | insertion | In_Frame_Ins | novel | c.1318_1320dupTTC | p.Phe440dup | p.F440dup | P48443 | protein_coding | TCGA-VS-A9U6-01 | Cervix | cervical & endocervical cancer | Female | <65 | I/II | Chemotherapy | cisplatin | PD | ||
| RXRG | SNV | Missense_Mutation | rs766425704 | c.526C>T | p.Arg176Trp | p.R176W | P48443 | protein_coding | deleterious(0) | probably_damaging(0.999) | TCGA-AA-3510-01 | Colorectum | colon adenocarcinoma | Male | >=65 | I/II | Unknown | Unknown | SD |
| RXRG | SNV | Missense_Mutation | c.338A>C | p.Lys113Thr | p.K113T | P48443 | protein_coding | deleterious(0.01) | probably_damaging(0.998) | TCGA-AA-A00N-01 | Colorectum | colon adenocarcinoma | Male | >=65 | I/II | Unknown | Unknown | PD | |
| RXRG | SNV | Missense_Mutation | c.1371N>T | p.Glu457Asp | p.E457D | P48443 | protein_coding | tolerated(0.11) | possibly_damaging(0.825) | TCGA-AA-A010-01 | Colorectum | colon adenocarcinoma | Female | <65 | I/II | Chemotherapy | folinic | CR |
| Page: 1 2 3 4 5 6 7 8 9 |
Top |
Related drugs of malignant transformation related genes |
| Identification of chemicals and drugs interact with genes involved in malignant transfromation |
| (DGIdb 4.0) |
| Entrez ID | Symbol | Category | Interaction Types | Drug Claim Name | Drug Name | PMIDs |
| 6258 | RXRG | NUCLEAR HORMONE RECEPTOR, DRUGGABLE GENOME | agonist | CHEMBL705 | ALITRETINOIN | |
| 6258 | RXRG | NUCLEAR HORMONE RECEPTOR, DRUGGABLE GENOME | NRX-4204 | |||
| 6258 | RXRG | NUCLEAR HORMONE RECEPTOR, DRUGGABLE GENOME | agonist | CHEMBL1023 | BEXAROTENE | |
| 6258 | RXRG | NUCLEAR HORMONE RECEPTOR, DRUGGABLE GENOME | ADAPALENE | ADAPALENE | ||
| 6258 | RXRG | NUCLEAR HORMONE RECEPTOR, DRUGGABLE GENOME | agonist | 135650520 | BEXAROTENE | |
| 6258 | RXRG | NUCLEAR HORMONE RECEPTOR, DRUGGABLE GENOME | 9cUAB-30 | |||
| 6258 | RXRG | NUCLEAR HORMONE RECEPTOR, DRUGGABLE GENOME | TRETINOIN | TRETINOIN | ||
| 6258 | RXRG | NUCLEAR HORMONE RECEPTOR, DRUGGABLE GENOME | ALITRETIONINE | |||
| 6258 | RXRG | NUCLEAR HORMONE RECEPTOR, DRUGGABLE GENOME | agonist | CHEMBL75133 | IRX-4204 | |
| 6258 | RXRG | NUCLEAR HORMONE RECEPTOR, DRUGGABLE GENOME | agonist | CHEMBL1131 | ACITRETIN |
| Page: 1 2 3 |

Copyright 2023-Present -The University of Texas Health Science Center at Houston |