
|
|||||
|
 | |
| |
| |
| |
| |
| |
|
Gene: RXRB |
Gene summary for RXRB |
| Gene information | Species | Human | Gene symbol | RXRB | Gene ID | 6257 |
| Gene name | retinoid X receptor beta | |
| Gene Alias | DAUDI6 | |
| Cytomap | 6p21.32 | |
| Gene Type | protein-coding | GO ID | GO:0006139 | UniProtAcc | A0A0S2Z570 |
Top |
Malignant transformation analysis |
| Identification of the aberrant gene expression in precancerous and cancerous lesions by comparing the gene expression of stem-like cells in diseased tissues with normal stem cells |
| Entrez ID | Symbol | Replicates | Species | Organ | Tissue | Adj P-value | Log2FC | Malignancy |
| 6257 | RXRB | LZE7T | Human | Esophagus | ESCC | 8.79e-07 | 1.46e-01 | 0.0667 |
| 6257 | RXRB | LZE8T | Human | Esophagus | ESCC | 2.72e-05 | 9.28e-02 | 0.067 |
| 6257 | RXRB | LZE20T | Human | Esophagus | ESCC | 4.43e-08 | 1.01e-01 | 0.0662 |
| 6257 | RXRB | LZE22D1 | Human | Esophagus | HGIN | 8.92e-03 | 1.15e-01 | 0.0595 |
| 6257 | RXRB | LZE22T | Human | Esophagus | ESCC | 3.08e-08 | 3.03e-01 | 0.068 |
| 6257 | RXRB | LZE24T | Human | Esophagus | ESCC | 1.17e-14 | 3.47e-01 | 0.0596 |
| 6257 | RXRB | LZE21T | Human | Esophagus | ESCC | 1.42e-02 | 9.66e-02 | 0.0655 |
| 6257 | RXRB | P1T-E | Human | Esophagus | ESCC | 2.06e-07 | 2.79e-01 | 0.0875 |
| 6257 | RXRB | P2T-E | Human | Esophagus | ESCC | 3.04e-37 | 5.97e-01 | 0.1177 |
| 6257 | RXRB | P4T-E | Human | Esophagus | ESCC | 8.65e-12 | 2.18e-01 | 0.1323 |
| 6257 | RXRB | P5T-E | Human | Esophagus | ESCC | 1.13e-10 | 1.12e-01 | 0.1327 |
| 6257 | RXRB | P8T-E | Human | Esophagus | ESCC | 9.75e-19 | 2.89e-01 | 0.0889 |
| 6257 | RXRB | P9T-E | Human | Esophagus | ESCC | 4.80e-09 | 1.36e-01 | 0.1131 |
| 6257 | RXRB | P10T-E | Human | Esophagus | ESCC | 4.16e-14 | 1.92e-01 | 0.116 |
| 6257 | RXRB | P11T-E | Human | Esophagus | ESCC | 2.77e-10 | 4.17e-01 | 0.1426 |
| 6257 | RXRB | P12T-E | Human | Esophagus | ESCC | 4.41e-20 | 3.61e-01 | 0.1122 |
| 6257 | RXRB | P15T-E | Human | Esophagus | ESCC | 7.26e-19 | 3.29e-01 | 0.1149 |
| 6257 | RXRB | P16T-E | Human | Esophagus | ESCC | 7.46e-25 | 4.52e-01 | 0.1153 |
| 6257 | RXRB | P17T-E | Human | Esophagus | ESCC | 4.20e-12 | 3.57e-01 | 0.1278 |
| 6257 | RXRB | P19T-E | Human | Esophagus | ESCC | 2.91e-09 | 4.33e-01 | 0.1662 |
| Page: 1 2 3 4 5 |
| Tissue | Expression Dynamics | Abbreviation |
| Esophagus |  | ESCC: Esophageal squamous cell carcinoma |
| HGIN: High-grade intraepithelial neoplasias | ||
| LGIN: Low-grade intraepithelial neoplasias | ||
| Liver | 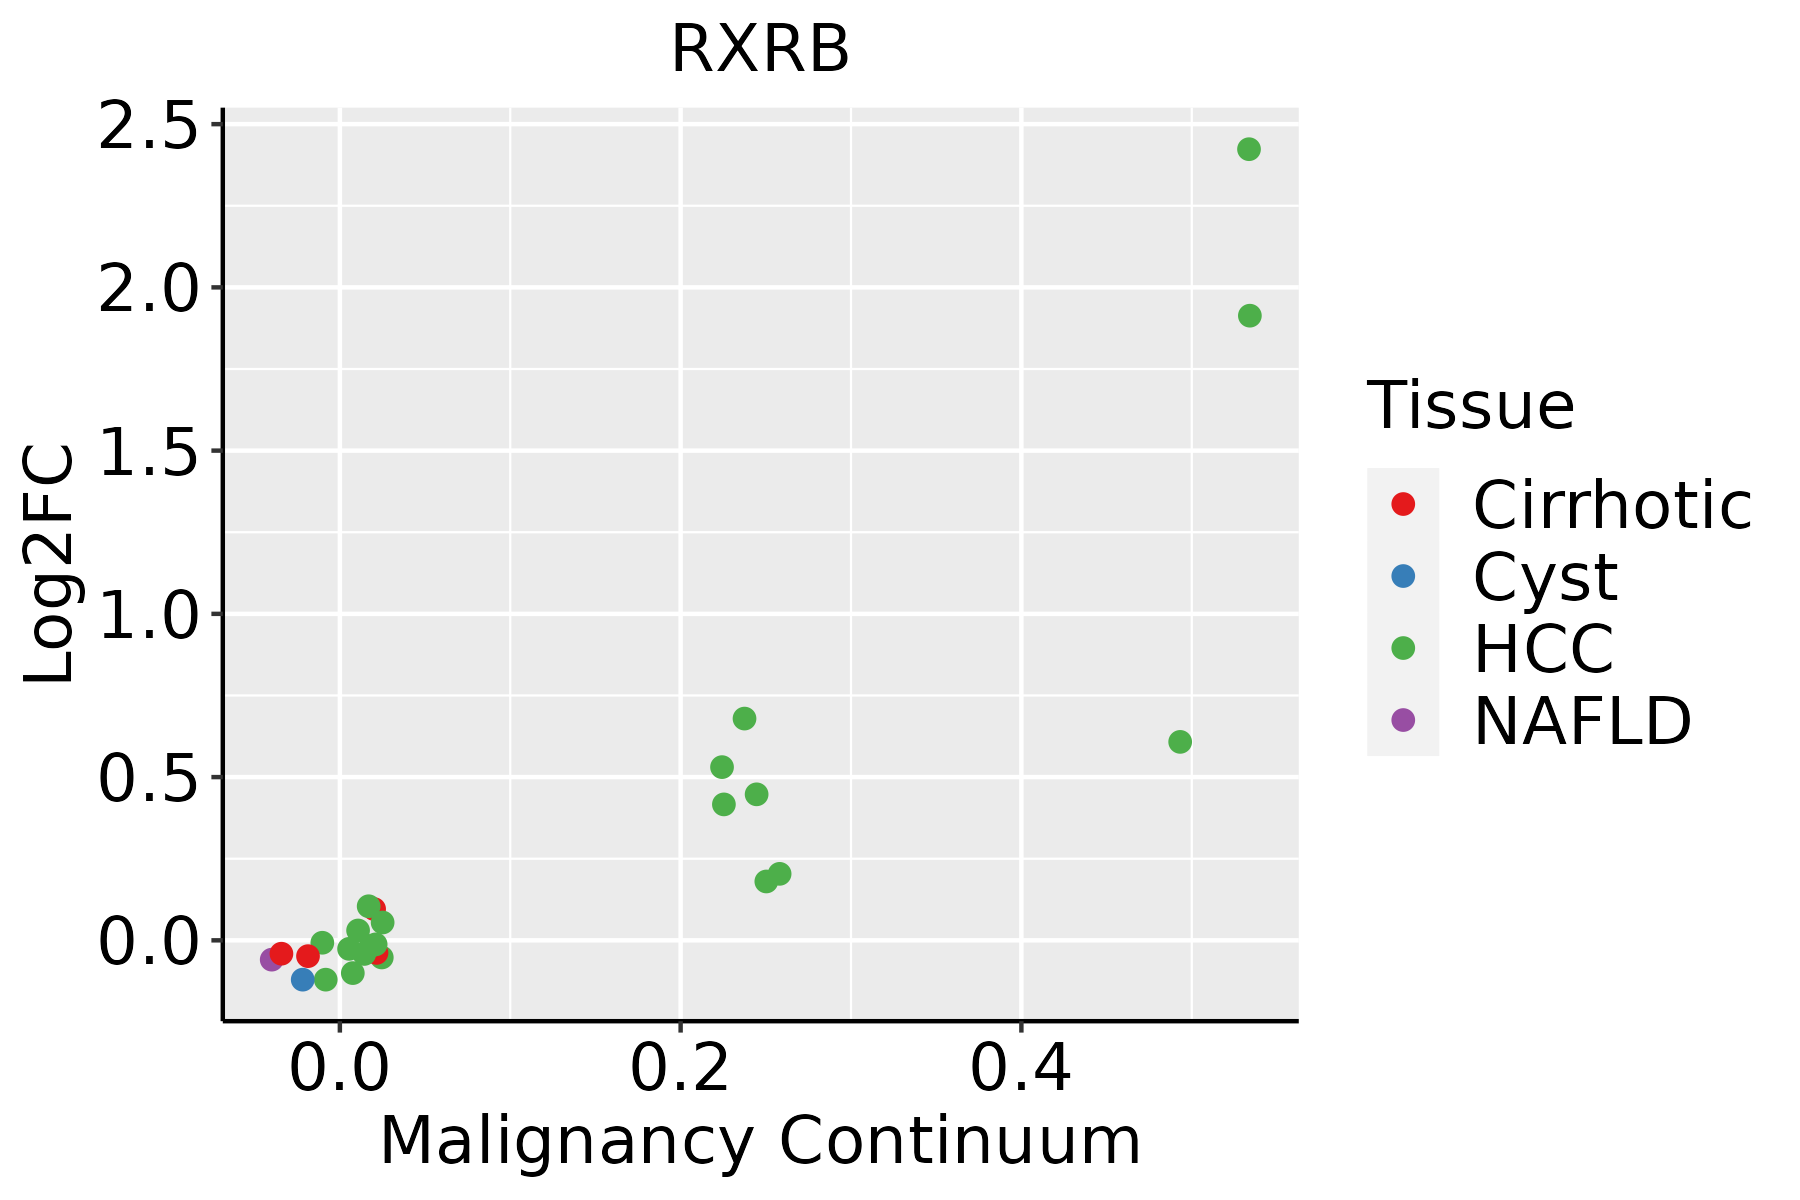 | HCC: Hepatocellular carcinoma |
| NAFLD: Non-alcoholic fatty liver disease | ||
| Oral Cavity |  | EOLP: Erosive Oral lichen planus |
| LP: leukoplakia | ||
| NEOLP: Non-erosive oral lichen planus | ||
| OSCC: Oral squamous cell carcinoma |
| ∗log2FC in expression of this searched gene in stem-like cells from each diseased tissue sample relative to stem-like cells in normal samples in each tissue plotted against the malignancy continuum. Samples are colored based on if they are from different disease stage. |
Top |
Malignant transformation related pathway analysis |
| Find out the enriched GO biological processes and KEGG pathways involved in transition from healthy to precancer to cancer |
| Tissue | Disease Stage | Enriched GO biological Processes |
| Colorectum | AD |  |
| Colorectum | SER |  |
| Colorectum | MSS |  |
| Colorectum | MSI-H |  |
| Colorectum | FAP |  |
| ∗Top 15 enriched GO BP terms are showed in the bar plot of each disease state in each tissue. Each row represents a significant GO biological process which is colored according to the -log10(p.adjust). |
| Page: 1 2 3 4 5 6 7 8 9 |
| GO ID | Tissue | Disease Stage | Description | Gene Ratio | Bg Ratio | pvalue | p.adjust | Count |
| GO:003052220 | Esophagus | HGIN | intracellular receptor signaling pathway | 62/2587 | 265/18723 | 1.63e-05 | 4.50e-04 | 62 |
| GO:004854527 | Esophagus | HGIN | response to steroid hormone | 73/2587 | 339/18723 | 6.06e-05 | 1.40e-03 | 73 |
| GO:007138320 | Esophagus | HGIN | cellular response to steroid hormone stimulus | 44/2587 | 204/18723 | 1.56e-03 | 1.79e-02 | 44 |
| GO:00483844 | Esophagus | HGIN | retinoic acid receptor signaling pathway | 11/2587 | 31/18723 | 2.02e-03 | 2.12e-02 | 11 |
| GO:004340118 | Esophagus | HGIN | steroid hormone mediated signaling pathway | 31/2587 | 136/18723 | 3.01e-03 | 2.88e-02 | 31 |
| GO:0030522110 | Esophagus | ESCC | intracellular receptor signaling pathway | 170/8552 | 265/18723 | 8.58e-10 | 2.09e-08 | 170 |
| GO:0048545111 | Esophagus | ESCC | response to steroid hormone | 204/8552 | 339/18723 | 4.47e-08 | 8.11e-07 | 204 |
| GO:0071383110 | Esophagus | ESCC | cellular response to steroid hormone stimulus | 127/8552 | 204/18723 | 1.26e-06 | 1.55e-05 | 127 |
| GO:004340119 | Esophagus | ESCC | steroid hormone mediated signaling pathway | 87/8552 | 136/18723 | 1.25e-05 | 1.15e-04 | 87 |
| GO:000975516 | Esophagus | ESCC | hormone-mediated signaling pathway | 106/8552 | 190/18723 | 3.13e-03 | 1.30e-02 | 106 |
| GO:004838412 | Esophagus | ESCC | retinoic acid receptor signaling pathway | 22/8552 | 31/18723 | 3.90e-03 | 1.58e-02 | 22 |
| GO:00325261 | Esophagus | ESCC | response to retinoic acid | 63/8552 | 107/18723 | 4.05e-03 | 1.62e-02 | 63 |
| GO:003052222 | Liver | HCC | intracellular receptor signaling pathway | 171/7958 | 265/18723 | 3.00e-13 | 1.61e-11 | 171 |
| GO:004854522 | Liver | HCC | response to steroid hormone | 206/7958 | 339/18723 | 6.81e-12 | 2.92e-10 | 206 |
| GO:007138322 | Liver | HCC | cellular response to steroid hormone stimulus | 128/7958 | 204/18723 | 3.92e-09 | 1.04e-07 | 128 |
| GO:004340121 | Liver | HCC | steroid hormone mediated signaling pathway | 84/7958 | 136/18723 | 4.42e-06 | 5.62e-05 | 84 |
| GO:000975521 | Liver | HCC | hormone-mediated signaling pathway | 106/7958 | 190/18723 | 1.45e-04 | 1.17e-03 | 106 |
| GO:00483841 | Liver | HCC | retinoic acid receptor signaling pathway | 20/7958 | 31/18723 | 1.11e-02 | 4.09e-02 | 20 |
| GO:004854520 | Oral cavity | OSCC | response to steroid hormone | 186/7305 | 339/18723 | 1.86e-09 | 4.42e-08 | 186 |
| GO:003052218 | Oral cavity | OSCC | intracellular receptor signaling pathway | 149/7305 | 265/18723 | 8.69e-09 | 1.81e-07 | 149 |
| Page: 1 2 |
| Pathway ID | Tissue | Disease Stage | Description | Gene Ratio | Bg Ratio | pvalue | p.adjust | qvalue | Count |
| hsa0541739 | Esophagus | HGIN | Lipid and atherosclerosis | 51/1383 | 215/8465 | 2.95e-03 | 2.41e-02 | 1.91e-02 | 51 |
| hsa0521620 | Esophagus | HGIN | Thyroid cancer | 13/1383 | 37/8465 | 4.20e-03 | 3.04e-02 | 2.41e-02 | 13 |
| hsa05417114 | Esophagus | HGIN | Lipid and atherosclerosis | 51/1383 | 215/8465 | 2.95e-03 | 2.41e-02 | 1.91e-02 | 51 |
| hsa05216110 | Esophagus | HGIN | Thyroid cancer | 13/1383 | 37/8465 | 4.20e-03 | 3.04e-02 | 2.41e-02 | 13 |
| hsa05417211 | Esophagus | ESCC | Lipid and atherosclerosis | 143/4205 | 215/8465 | 3.30e-07 | 2.45e-06 | 1.26e-06 | 143 |
| hsa052229 | Esophagus | ESCC | Small cell lung cancer | 69/4205 | 92/8465 | 5.40e-07 | 3.85e-06 | 1.97e-06 | 69 |
| hsa0521628 | Esophagus | ESCC | Thyroid cancer | 32/4205 | 37/8465 | 2.98e-06 | 1.72e-05 | 8.81e-06 | 32 |
| hsa0491928 | Esophagus | ESCC | Thyroid hormone signaling pathway | 78/4205 | 121/8465 | 6.79e-04 | 2.23e-03 | 1.14e-03 | 78 |
| hsa052028 | Esophagus | ESCC | Transcriptional misregulation in cancer | 116/4205 | 193/8465 | 2.08e-03 | 5.95e-03 | 3.05e-03 | 116 |
| hsa052237 | Esophagus | ESCC | Non-small cell lung cancer | 48/4205 | 72/8465 | 2.57e-03 | 7.05e-03 | 3.61e-03 | 48 |
| hsa046599 | Esophagus | ESCC | Th17 cell differentiation | 68/4205 | 108/8465 | 3.53e-03 | 9.30e-03 | 4.76e-03 | 68 |
| hsa0492816 | Esophagus | ESCC | Parathyroid hormone synthesis, secretion and action | 66/4205 | 106/8465 | 5.86e-03 | 1.47e-02 | 7.51e-03 | 66 |
| hsa05417310 | Esophagus | ESCC | Lipid and atherosclerosis | 143/4205 | 215/8465 | 3.30e-07 | 2.45e-06 | 1.26e-06 | 143 |
| hsa0522216 | Esophagus | ESCC | Small cell lung cancer | 69/4205 | 92/8465 | 5.40e-07 | 3.85e-06 | 1.97e-06 | 69 |
| hsa0521638 | Esophagus | ESCC | Thyroid cancer | 32/4205 | 37/8465 | 2.98e-06 | 1.72e-05 | 8.81e-06 | 32 |
| hsa04919113 | Esophagus | ESCC | Thyroid hormone signaling pathway | 78/4205 | 121/8465 | 6.79e-04 | 2.23e-03 | 1.14e-03 | 78 |
| hsa0520213 | Esophagus | ESCC | Transcriptional misregulation in cancer | 116/4205 | 193/8465 | 2.08e-03 | 5.95e-03 | 3.05e-03 | 116 |
| hsa0522316 | Esophagus | ESCC | Non-small cell lung cancer | 48/4205 | 72/8465 | 2.57e-03 | 7.05e-03 | 3.61e-03 | 48 |
| hsa0465914 | Esophagus | ESCC | Th17 cell differentiation | 68/4205 | 108/8465 | 3.53e-03 | 9.30e-03 | 4.76e-03 | 68 |
| hsa0492817 | Esophagus | ESCC | Parathyroid hormone synthesis, secretion and action | 66/4205 | 106/8465 | 5.86e-03 | 1.47e-02 | 7.51e-03 | 66 |
| Page: 1 2 3 |
Top |
Cell-cell communication analysis |
| Identification of potential cell-cell interactions between two cell types and their ligand-receptor pairs for different disease states |
| Ligand | Receptor | LRpair | Pathway | Tissue | Disease Stage |
| Page: 1 |
Top |
Single-cell gene regulatory network inference analysis |
| Find out the significant the regulons (TFs) and the target genes of each regulon across cell types for different disease states |
| TF | Cell Type | Tissue | Disease Stage | Target Gene | RSS | Regulon Activity |
| RXRB | M1MAC | Endometrium | Healthy | FILIP1L,DRAXIN,AC008781.2, etc. | 5.80e-01 |  |
| RXRB | CD4TN | Oral cavity | ADJ | TRIM4,TET1,LARP1, etc. | 1.04e-02 |  |
| RXRB | CD8TEX | Oral cavity | EOLP | TRIM4,TET1,LARP1, etc. | 0.00e+00 |  |
| RXRB | CD8TEFF | Oral cavity | EOLP | TRIM4,TET1,LARP1, etc. | 0.00e+00 | |
| RXRB | cDC | Oral cavity | EOLP | TRIM4,TET1,LARP1, etc. | 0.00e+00 | |
| RXRB | MDSCs | Oral cavity | EOLP | TRIM4,TET1,LARP1, etc. | 0.00e+00 | |
| RXRB | pDC | Oral cavity | EOLP | TRIM4,TET1,LARP1, etc. | 0.00e+00 | |
| RXRB | MAST | Oral cavity | EOLP | TRIM4,TET1,LARP1, etc. | 0.00e+00 | |
| RXRB | CD8TEFF | Oral cavity | Healthy | TRIM4,TET1,LARP1, etc. | 1.23e-03 |  |
| RXRB | MDSCs | Oral cavity | Healthy | TRIM4,TET1,LARP1, etc. | 2.93e-03 | |
| ∗The dot plots of a searched regulon are shown for all cell subpopulations in each disease state of each tissue based on the regulon specific score inferred using pySCENIC and by calculating the average expression. |
| Page: 1 2 3 |
Top |
Somatic mutation of malignant transformation related genes |
| Annotation of somatic variants for genes involved in malignant transformation |
| Hugo Symbol | Variant Class | Variant Classification | dbSNP RS | HGVSc | HGVSp | HGVSp Short | SWISSPROT | BIOTYPE | SIFT | PolyPhen | Tumor Sample Barcode | Tissue | Histology | Sex | Age | Stage | Therapy Types | Drugs | Outcome |
| RXRB | SNV | Missense_Mutation | rs754055760 | c.1501C>T | p.Arg501Trp | p.R501W | P28702 | protein_coding | deleterious(0) | probably_damaging(0.999) | TCGA-2W-A8YY-01 | Cervix | cervical & endocervical cancer | Female | <65 | I/II | Chemotherapy | cisplatin | CR |
| RXRB | SNV | Missense_Mutation | c.881N>A | p.Gly294Glu | p.G294E | P28702 | protein_coding | deleterious(0.01) | possibly_damaging(0.468) | TCGA-EA-A3HT-01 | Cervix | cervical & endocervical cancer | Female | >=65 | I/II | Unknown | Unknown | SD | |
| RXRB | SNV | Missense_Mutation | novel | c.1016N>G | p.Ile339Ser | p.I339S | P28702 | protein_coding | deleterious(0.01) | probably_damaging(0.999) | TCGA-EA-A3HU-01 | Cervix | cervical & endocervical cancer | Female | <65 | I/II | Unknown | Unknown | SD |
| RXRB | SNV | Missense_Mutation | c.484N>T | p.Ile162Phe | p.I162F | P28702 | protein_coding | tolerated(0.07) | probably_damaging(0.979) | TCGA-A6-5659-01 | Colorectum | colon adenocarcinoma | Male | >=65 | I/II | Unknown | Unknown | SD | |
| RXRB | SNV | Missense_Mutation | c.1363N>A | p.Ala455Thr | p.A455T | P28702 | protein_coding | deleterious(0.05) | probably_damaging(0.942) | TCGA-AA-3715-01 | Colorectum | colon adenocarcinoma | Male | >=65 | I/II | Unknown | Unknown | PD | |
| RXRB | SNV | Missense_Mutation | c.433N>G | p.Leu145Val | p.L145V | P28702 | protein_coding | tolerated(0.26) | probably_damaging(0.973) | TCGA-AA-3939-01 | Colorectum | colon adenocarcinoma | Male | >=65 | I/II | Unknown | Unknown | SD | |
| RXRB | SNV | Missense_Mutation | novel | c.242N>A | p.Arg81Gln | p.R81Q | P28702 | protein_coding | tolerated_low_confidence(0.07) | benign(0.005) | TCGA-AA-3984-01 | Colorectum | colon adenocarcinoma | Female | <65 | I/II | Unknown | Unknown | SD |
| RXRB | SNV | Missense_Mutation | novel | c.77N>C | p.Lys26Thr | p.K26T | P28702 | protein_coding | deleterious_low_confidence(0) | benign(0.003) | TCGA-AZ-4315-01 | Colorectum | colon adenocarcinoma | Male | <65 | I/II | Unknown | Unknown | SD |
| RXRB | SNV | Missense_Mutation | c.1340N>T | p.Ala447Val | p.A447V | P28702 | protein_coding | deleterious(0.01) | probably_damaging(0.913) | TCGA-F4-6570-01 | Colorectum | colon adenocarcinoma | Female | >=65 | I/II | Unknown | Unknown | SD | |
| RXRB | SNV | Missense_Mutation | c.706N>T | p.Asp236Tyr | p.D236Y | P28702 | protein_coding | deleterious(0.01) | probably_damaging(0.999) | TCGA-AG-3892-01 | Colorectum | rectum adenocarcinoma | Female | <65 | I/II | Unknown | Unknown | SD |
| Page: 1 2 3 4 5 |
Top |
Related drugs of malignant transformation related genes |
| Identification of chemicals and drugs interact with genes involved in malignant transfromation |
| (DGIdb 4.0) |
| Entrez ID | Symbol | Category | Interaction Types | Drug Claim Name | Drug Name | PMIDs |
| 6257 | RXRB | DRUGGABLE GENOME, NUCLEAR HORMONE RECEPTOR | TRETINOIN | TRETINOIN | ||
| 6257 | RXRB | DRUGGABLE GENOME, NUCLEAR HORMONE RECEPTOR | agonist | CHEMBL1131 | ACITRETIN | |
| 6257 | RXRB | DRUGGABLE GENOME, NUCLEAR HORMONE RECEPTOR | antagonist | 135651303 | ||
| 6257 | RXRB | DRUGGABLE GENOME, NUCLEAR HORMONE RECEPTOR | modulator | CHEMBL146506 | MOFAROTENE | |
| 6257 | RXRB | DRUGGABLE GENOME, NUCLEAR HORMONE RECEPTOR | TAZAROTENE | TAZAROTENE | ||
| 6257 | RXRB | DRUGGABLE GENOME, NUCLEAR HORMONE RECEPTOR | antagonist | 135650518 | ||
| 6257 | RXRB | DRUGGABLE GENOME, NUCLEAR HORMONE RECEPTOR | agonist | 135650520 | BEXAROTENE | |
| 6257 | RXRB | DRUGGABLE GENOME, NUCLEAR HORMONE RECEPTOR | ALITRETIONINE | |||
| 6257 | RXRB | DRUGGABLE GENOME, NUCLEAR HORMONE RECEPTOR | agonist | CHEMBL1023 | BEXAROTENE | |
| 6257 | RXRB | DRUGGABLE GENOME, NUCLEAR HORMONE RECEPTOR | BEXAROTENE | BEXAROTENE |
| Page: 1 2 3 |

Copyright 2023-Present -The University of Texas Health Science Center at Houston |