| Tissue | Expression Dynamics | Abbreviation |
| Colorectum (GSE201348) |  | FAP: Familial adenomatous polyposis |
| CRC: Colorectal cancer |
| Colorectum (HTA11) |  | AD: Adenomas |
| SER: Sessile serrated lesions |
| MSI-H: Microsatellite-high colorectal cancer |
| MSS: Microsatellite stable colorectal cancer |
| Esophagus |  | ESCC: Esophageal squamous cell carcinoma |
| HGIN: High-grade intraepithelial neoplasias |
| LGIN: Low-grade intraepithelial neoplasias |
| Liver | 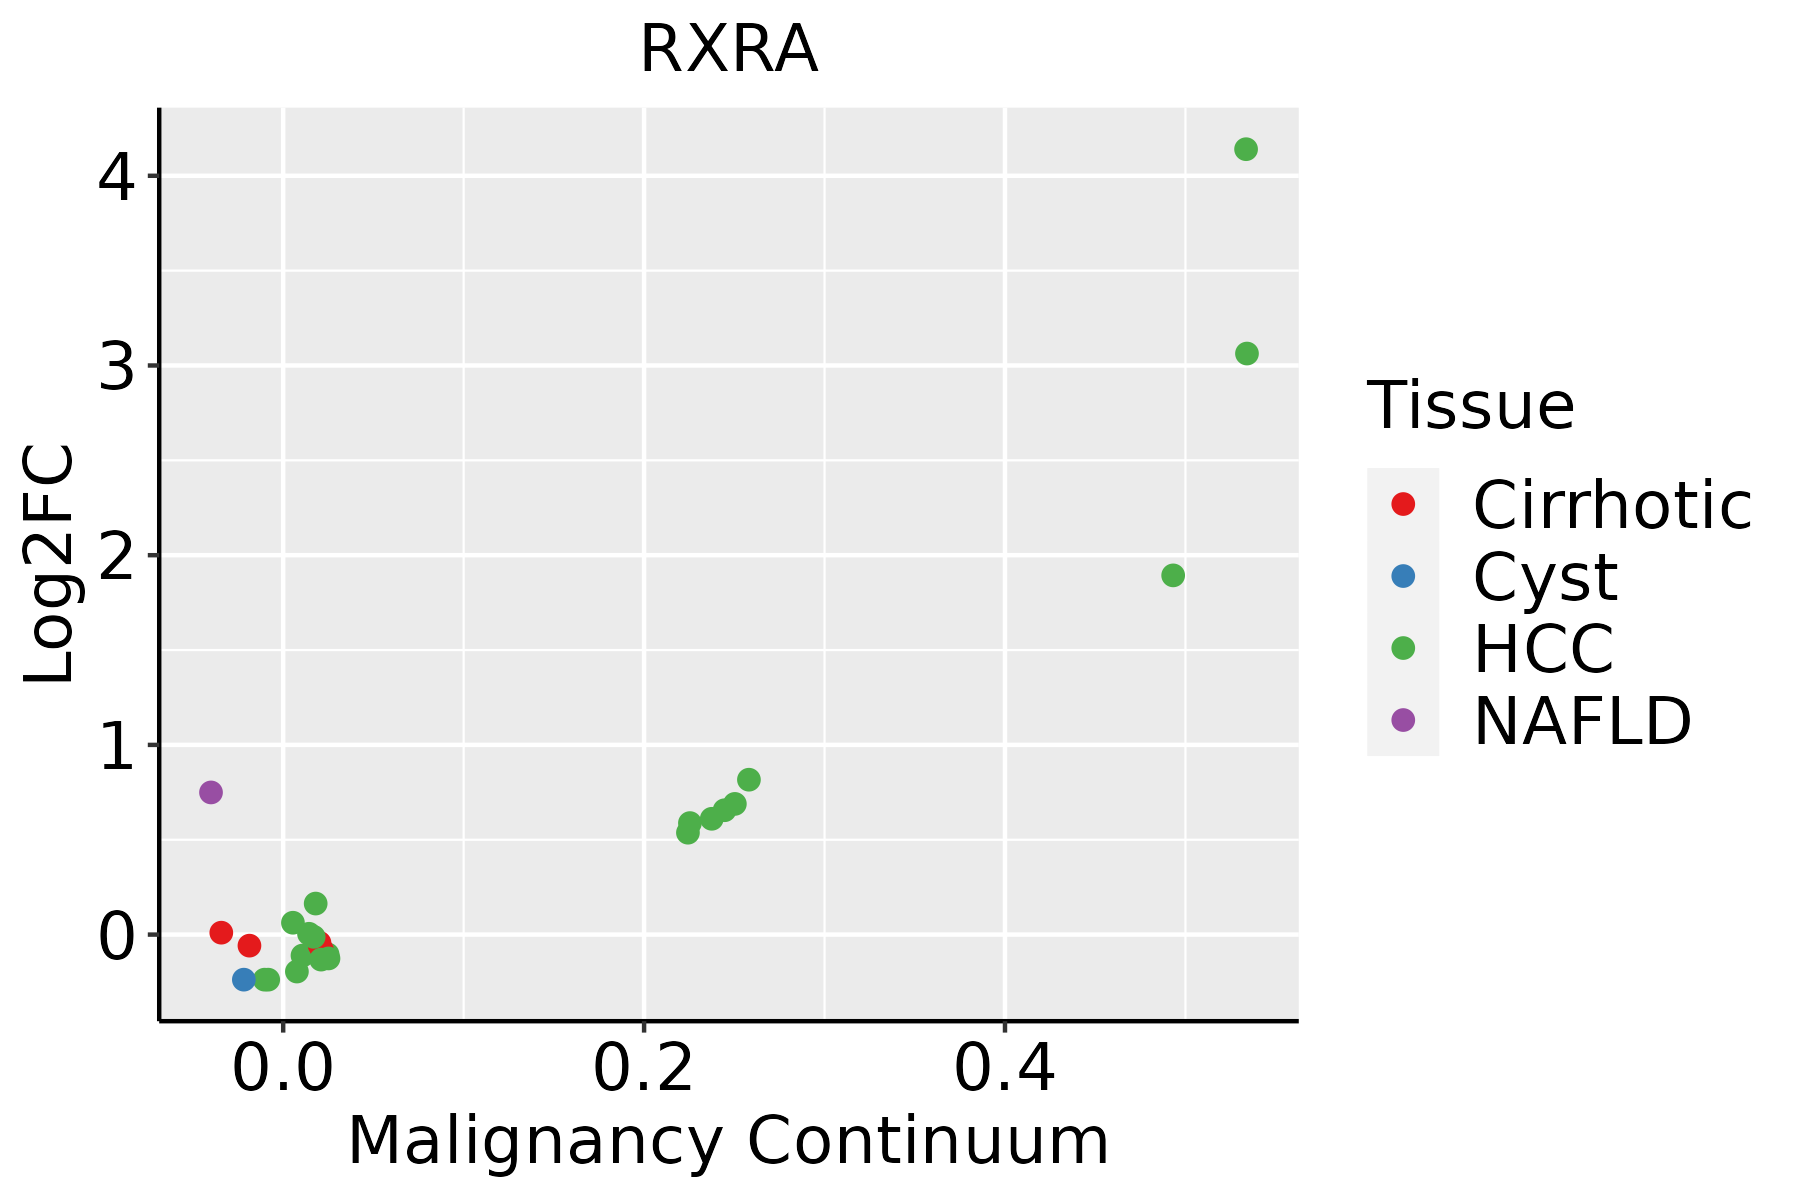 | HCC: Hepatocellular carcinoma |
| NAFLD: Non-alcoholic fatty liver disease |
| Oral Cavity | 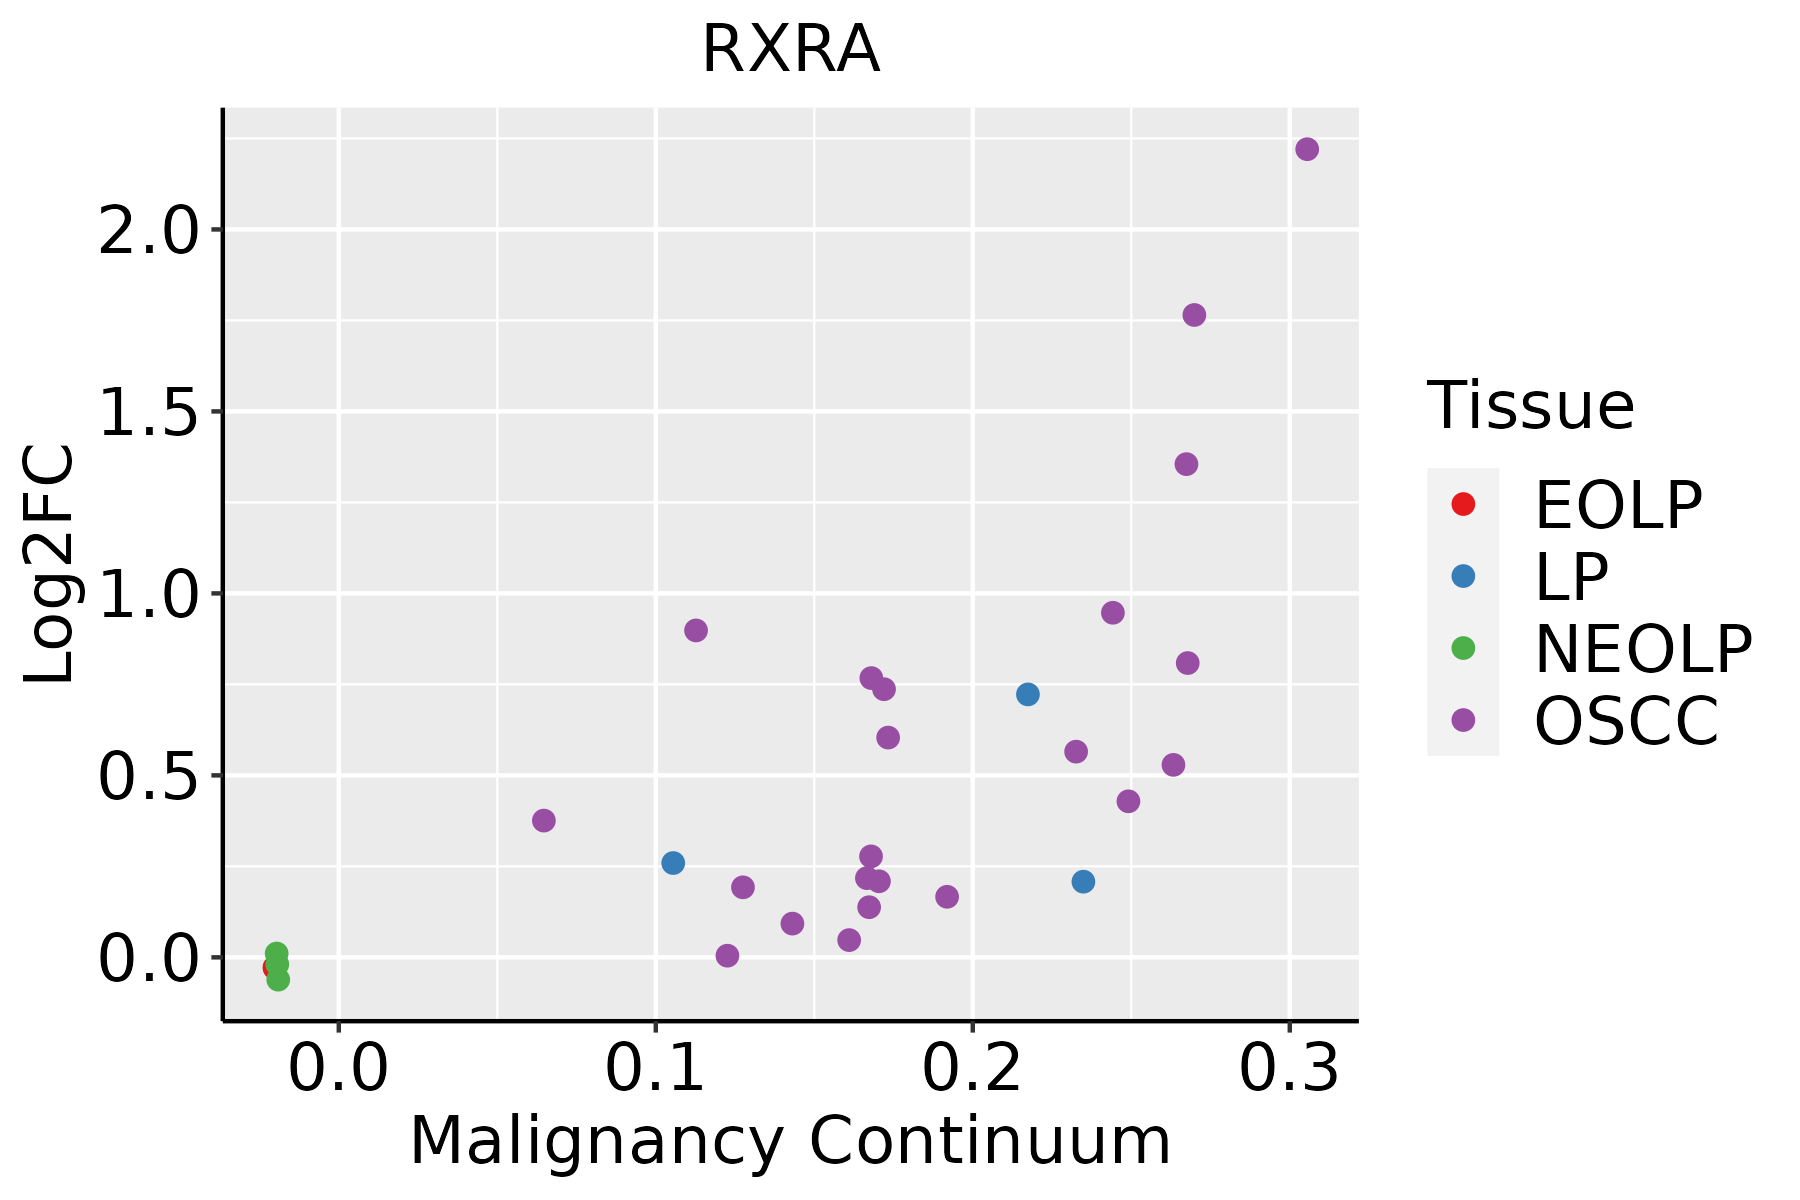 | EOLP: Erosive Oral lichen planus |
| LP: leukoplakia |
| NEOLP: Non-erosive oral lichen planus |
| OSCC: Oral squamous cell carcinoma |
| Prostate |  | BPH: Benign Prostatic Hyperplasia |
| Skin | 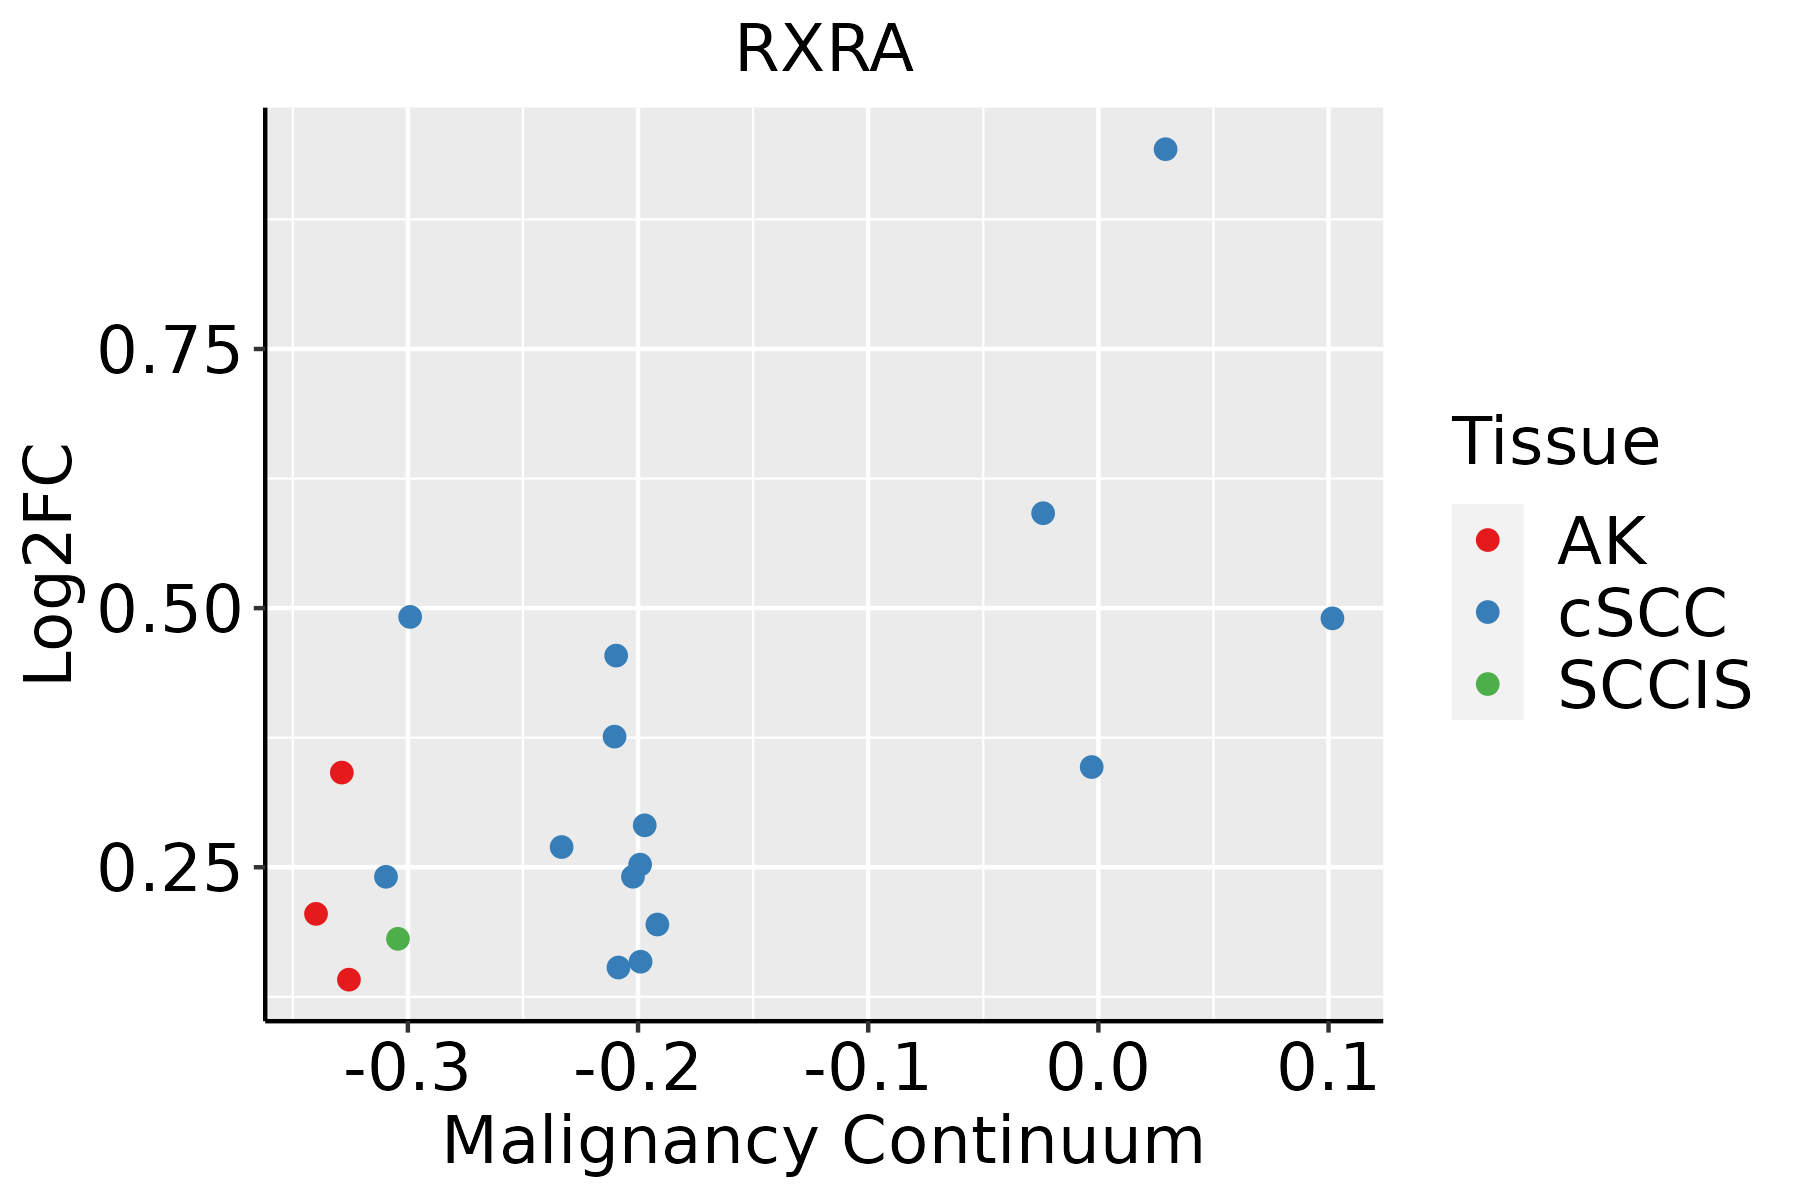 | AK: Actinic keratosis |
| cSCC: Cutaneous squamous cell carcinoma |
| SCCIS:squamous cell carcinoma in situ |
| Thyroid | 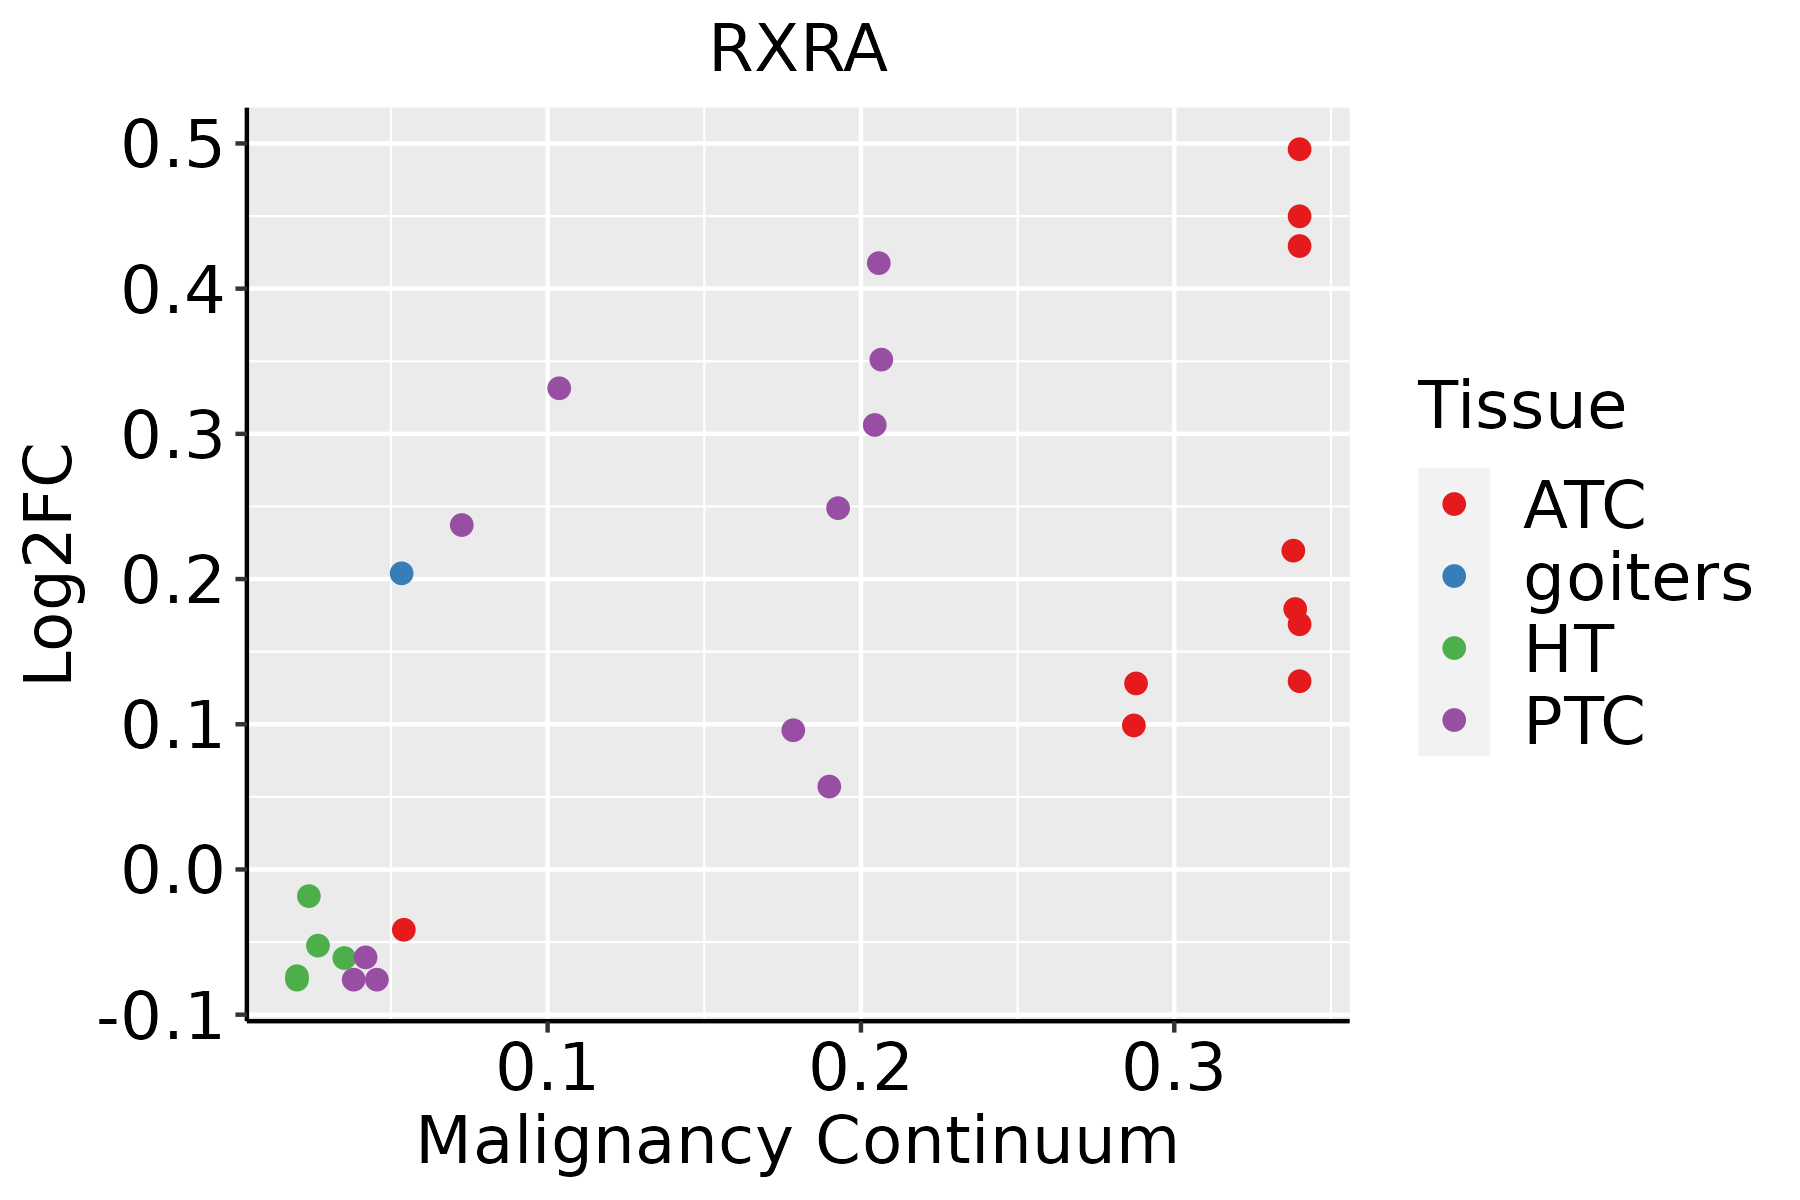 | ATC: Anaplastic thyroid cancer |
| HT: Hashimoto's thyroiditis |
| PTC: Papillary thyroid cancer |
| GO ID | Tissue | Disease Stage | Description | Gene Ratio | Bg Ratio | pvalue | p.adjust | Count |
| GO:0016032 | Colorectum | AD | viral process | 168/3918 | 415/18723 | 4.67e-20 | 3.66e-17 | 168 |
| GO:0044403 | Colorectum | AD | biological process involved in symbiotic interaction | 99/3918 | 290/18723 | 1.02e-07 | 4.93e-06 | 99 |
| GO:0051701 | Colorectum | AD | biological process involved in interaction with host | 73/3918 | 203/18723 | 5.08e-07 | 1.88e-05 | 73 |
| GO:0071383 | Colorectum | AD | cellular response to steroid hormone stimulus | 73/3918 | 204/18723 | 6.31e-07 | 2.24e-05 | 73 |
| GO:0030522 | Colorectum | AD | intracellular receptor signaling pathway | 87/3918 | 265/18723 | 3.69e-06 | 1.03e-04 | 87 |
| GO:0043401 | Colorectum | AD | steroid hormone mediated signaling pathway | 51/3918 | 136/18723 | 6.52e-06 | 1.63e-04 | 51 |
| GO:0048545 | Colorectum | AD | response to steroid hormone | 104/3918 | 339/18723 | 1.33e-05 | 2.90e-04 | 104 |
| GO:0009755 | Colorectum | AD | hormone-mediated signaling pathway | 64/3918 | 190/18723 | 2.78e-05 | 5.24e-04 | 64 |
| GO:0006066 | Colorectum | AD | alcohol metabolic process | 106/3918 | 353/18723 | 3.02e-05 | 5.57e-04 | 106 |
| GO:0010876 | Colorectum | AD | lipid localization | 120/3918 | 448/18723 | 1.59e-03 | 1.33e-02 | 120 |
| GO:0006869 | Colorectum | AD | lipid transport | 108/3918 | 398/18723 | 1.67e-03 | 1.39e-02 | 108 |
| GO:0019048 | Colorectum | AD | modulation by virus of host process | 7/3918 | 11/18723 | 2.59e-03 | 1.96e-02 | 7 |
| GO:0035821 | Colorectum | AD | modulation of process of other organism | 34/3918 | 106/18723 | 4.73e-03 | 3.22e-02 | 34 |
| GO:0032411 | Colorectum | AD | positive regulation of transporter activity | 37/3918 | 120/18723 | 6.82e-03 | 4.22e-02 | 37 |
| GO:0008202 | Colorectum | AD | steroid metabolic process | 85/3918 | 319/18723 | 8.07e-03 | 4.75e-02 | 85 |
| GO:00160321 | Colorectum | SER | viral process | 118/2897 | 415/18723 | 8.36e-12 | 1.65e-09 | 118 |
| GO:00517011 | Colorectum | SER | biological process involved in interaction with host | 55/2897 | 203/18723 | 1.42e-05 | 4.38e-04 | 55 |
| GO:00713831 | Colorectum | SER | cellular response to steroid hormone stimulus | 55/2897 | 204/18723 | 1.66e-05 | 5.05e-04 | 55 |
| GO:00444031 | Colorectum | SER | biological process involved in symbiotic interaction | 72/2897 | 290/18723 | 2.08e-05 | 6.02e-04 | 72 |
| GO:00485451 | Colorectum | SER | response to steroid hormone | 80/2897 | 339/18723 | 5.15e-05 | 1.25e-03 | 80 |
| Pathway ID | Tissue | Disease Stage | Description | Gene Ratio | Bg Ratio | pvalue | p.adjust | qvalue | Count |
| hsa04932 | Colorectum | AD | Non-alcoholic fatty liver disease | 90/2092 | 155/8465 | 4.83e-19 | 1.80e-17 | 1.15e-17 | 90 |
| hsa04919 | Colorectum | AD | Thyroid hormone signaling pathway | 51/2092 | 121/8465 | 1.71e-05 | 1.73e-04 | 1.10e-04 | 51 |
| hsa05216 | Colorectum | AD | Thyroid cancer | 21/2092 | 37/8465 | 3.05e-05 | 2.76e-04 | 1.76e-04 | 21 |
| hsa05417 | Colorectum | AD | Lipid and atherosclerosis | 73/2092 | 215/8465 | 1.31e-03 | 8.27e-03 | 5.27e-03 | 73 |
| hsa05160 | Colorectum | AD | Hepatitis C | 54/2092 | 157/8465 | 3.87e-03 | 1.96e-02 | 1.25e-02 | 54 |
| hsa04928 | Colorectum | AD | Parathyroid hormone synthesis, secretion and action | 38/2092 | 106/8465 | 6.60e-03 | 2.77e-02 | 1.76e-02 | 38 |
| hsa049321 | Colorectum | AD | Non-alcoholic fatty liver disease | 90/2092 | 155/8465 | 4.83e-19 | 1.80e-17 | 1.15e-17 | 90 |
| hsa049191 | Colorectum | AD | Thyroid hormone signaling pathway | 51/2092 | 121/8465 | 1.71e-05 | 1.73e-04 | 1.10e-04 | 51 |
| hsa052161 | Colorectum | AD | Thyroid cancer | 21/2092 | 37/8465 | 3.05e-05 | 2.76e-04 | 1.76e-04 | 21 |
| hsa054171 | Colorectum | AD | Lipid and atherosclerosis | 73/2092 | 215/8465 | 1.31e-03 | 8.27e-03 | 5.27e-03 | 73 |
| hsa051601 | Colorectum | AD | Hepatitis C | 54/2092 | 157/8465 | 3.87e-03 | 1.96e-02 | 1.25e-02 | 54 |
| hsa049281 | Colorectum | AD | Parathyroid hormone synthesis, secretion and action | 38/2092 | 106/8465 | 6.60e-03 | 2.77e-02 | 1.76e-02 | 38 |
| hsa049322 | Colorectum | SER | Non-alcoholic fatty liver disease | 75/1580 | 155/8465 | 2.16e-17 | 5.99e-16 | 4.35e-16 | 75 |
| hsa049192 | Colorectum | SER | Thyroid hormone signaling pathway | 40/1580 | 121/8465 | 1.02e-04 | 1.06e-03 | 7.67e-04 | 40 |
| hsa049282 | Colorectum | SER | Parathyroid hormone synthesis, secretion and action | 31/1580 | 106/8465 | 5.20e-03 | 3.28e-02 | 2.38e-02 | 31 |
| hsa054172 | Colorectum | SER | Lipid and atherosclerosis | 55/1580 | 215/8465 | 6.83e-03 | 3.77e-02 | 2.74e-02 | 55 |
| hsa049323 | Colorectum | SER | Non-alcoholic fatty liver disease | 75/1580 | 155/8465 | 2.16e-17 | 5.99e-16 | 4.35e-16 | 75 |
| hsa049193 | Colorectum | SER | Thyroid hormone signaling pathway | 40/1580 | 121/8465 | 1.02e-04 | 1.06e-03 | 7.67e-04 | 40 |
| hsa049283 | Colorectum | SER | Parathyroid hormone synthesis, secretion and action | 31/1580 | 106/8465 | 5.20e-03 | 3.28e-02 | 2.38e-02 | 31 |
| hsa054173 | Colorectum | SER | Lipid and atherosclerosis | 55/1580 | 215/8465 | 6.83e-03 | 3.77e-02 | 2.74e-02 | 55 |
| TF | Cell Type | Tissue | Disease Stage | Target Gene | RSS | Regulon Activity |
| RXRA | MON | Colorectum | AD | SYT1,MKNK1,RAC1, etc. | 8.10e-02 |  |
| RXRA | HEP | Liver | HCC | TM9SF4,MPC1,ZMYND8, etc. | 8.11e-01 |  |
| RXRA | SPI | Oral cavity | Healthy | DUS1L,ZBED1,NCOA1, etc. | 3.02e-01 |  |
| RXRA | LC | Skin | ADJ | TACSTD2,FCGBP,PLEK2, etc. | 2.90e-01 |  |
| RXRA | LC | Skin | cSCC | TACSTD2,FCGBP,PLEK2, etc. | 2.41e-01 |  |
| RXRA | DPC | Skin | SCCIS | FAM213A,SIK1,AQP3, etc. | 1.52e-01 |  |
| RXRA | GMC | Stomach | Healthy | MUC6,AGO1,INSIG1, etc. | 2.29e-01 |  |
| RXRA | STM | Thyroid | goiters | LAG3,SOX13,ABCF2, etc. | 6.93e-01 |  |
| RXRA | INMON | Thyroid | goiters | HLA-DQB2,ASGR2,ZNF683, etc. | 4.38e-02 | |
| RXRA | INMON | Thyroid | PTC | HLA-DQB2,ASGR2,ZNF683, etc. | 6.76e-02 |  |
| Hugo Symbol | Variant Class | Variant Classification | dbSNP RS | HGVSc | HGVSp | HGVSp Short | SWISSPROT | BIOTYPE | SIFT | PolyPhen | Tumor Sample Barcode | Tissue | Histology | Sex | Age | Stage | Therapy Types | Drugs | Outcome |
| RXRA | SNV | Missense_Mutation | rs777558913 | c.692C>T | p.Pro231Leu | p.P231L | P19793 | protein_coding | deleterious(0) | probably_damaging(0.937) | TCGA-A2-A1G4-01 | Breast | breast invasive carcinoma | Female | >=65 | III/IV | Chemotherapy | adriamycin | SD |
| RXRA | SNV | Missense_Mutation | novel | c.1027G>T | p.Gly343Cys | p.G343C | P19793 | protein_coding | deleterious(0) | probably_damaging(1) | TCGA-C8-A26Y-01 | Breast | breast invasive carcinoma | Female | >=65 | I/II | Unknown | Unknown | SD |
| RXRA | SNV | Missense_Mutation | | c.635N>T | p.Gly212Val | p.G212V | P19793 | protein_coding | tolerated(0.15) | benign(0.036) | TCGA-OL-A66N-01 | Breast | breast invasive carcinoma | Female | <65 | III/IV | Unknown | Unknown | SD |
| RXRA | deletion | Frame_Shift_Del | novel | c.167delN | p.Ile58SerfsTer41 | p.I58Sfs*41 | P19793 | protein_coding | | | TCGA-D8-A27V-01 | Breast | breast invasive carcinoma | Female | <65 | I/II | Hormone Therapy | tamoxiphen | SD |
| RXRA | insertion | Frame_Shift_Ins | novel | c.1316_1317insA | p.Phe439LeufsTer10 | p.F439Lfs*10 | P19793 | protein_coding | | | TCGA-E2-A576-01 | Breast | breast invasive carcinoma | Female | >=65 | I/II | Chemotherapy | taxotere | SD |
| RXRA | deletion | Frame_Shift_Del | novel | c.154delA | p.Ser52AlafsTer3 | p.S52Afs*3 | P19793 | protein_coding | | | TCGA-EW-A2FV-01 | Breast | breast invasive carcinoma | Female | <65 | III/IV | Chemotherapy | docetaxel | SD |
| RXRA | SNV | Missense_Mutation | novel | c.1362N>A | p.Met454Ile | p.M454I | P19793 | protein_coding | deleterious(0.02) | possibly_damaging(0.502) | TCGA-2W-A8YY-01 | Cervix | cervical & endocervical cancer | Female | <65 | I/II | Chemotherapy | cisplatin | CR |
| RXRA | SNV | Missense_Mutation | | c.490N>T | p.Arg164Cys | p.R164C | P19793 | protein_coding | deleterious(0) | probably_damaging(1) | TCGA-EK-A2RA-01 | Cervix | cervical & endocervical cancer | Female | >=65 | I/II | Unknown | Unknown | SD |
| RXRA | SNV | Missense_Mutation | novel | c.600N>A | p.Met200Ile | p.M200I | P19793 | protein_coding | deleterious(0) | probably_damaging(1) | TCGA-VS-A8EL-01 | Cervix | cervical & endocervical cancer | Female | <65 | I/II | Chemotherapy | cisplatin | CR |
| RXRA | SNV | Missense_Mutation | novel | c.632N>A | p.Arg211His | p.R211H | P19793 | protein_coding | deleterious(0) | probably_damaging(0.932) | TCGA-5M-AAT6-01 | Colorectum | colon adenocarcinoma | Female | <65 | III/IV | Unknown | Unknown | PD |
| Entrez ID | Symbol | Category | Interaction Types | Drug Claim Name | Drug Name | PMIDs |
| 6256 | RXRA | NUCLEAR HORMONE RECEPTOR, TRANSCRIPTION FACTOR COMPLEX, DRUGGABLE GENOME, CLINICALLY ACTIONABLE, TRANSCRIPTION FACTOR | | ALITRETINOIN | ALITRETINOIN | |
| 6256 | RXRA | NUCLEAR HORMONE RECEPTOR, TRANSCRIPTION FACTOR COMPLEX, DRUGGABLE GENOME, CLINICALLY ACTIONABLE, TRANSCRIPTION FACTOR | | 2-PHENYLPHENOL | 2-PHENYLPHENOL | |
| 6256 | RXRA | NUCLEAR HORMONE RECEPTOR, TRANSCRIPTION FACTOR COMPLEX, DRUGGABLE GENOME, CLINICALLY ACTIONABLE, TRANSCRIPTION FACTOR | | DOCONEXENT | DOCONEXENT | 20695472 |
| 6256 | RXRA | NUCLEAR HORMONE RECEPTOR, TRANSCRIPTION FACTOR COMPLEX, DRUGGABLE GENOME, CLINICALLY ACTIONABLE, TRANSCRIPTION FACTOR | antagonist | 135650518 | | |
| 6256 | RXRA | NUCLEAR HORMONE RECEPTOR, TRANSCRIPTION FACTOR COMPLEX, DRUGGABLE GENOME, CLINICALLY ACTIONABLE, TRANSCRIPTION FACTOR | | DOXORUBICIN HYDROCHLORIDE | DOXORUBICIN HYDROCHLORIDE | |
| 6256 | RXRA | NUCLEAR HORMONE RECEPTOR, TRANSCRIPTION FACTOR COMPLEX, DRUGGABLE GENOME, CLINICALLY ACTIONABLE, TRANSCRIPTION FACTOR | | Alitretinoin | ALITRETINOIN | |
| 6256 | RXRA | NUCLEAR HORMONE RECEPTOR, TRANSCRIPTION FACTOR COMPLEX, DRUGGABLE GENOME, CLINICALLY ACTIONABLE, TRANSCRIPTION FACTOR | | MESOTRIONE | MESOTRIONE | |
| 6256 | RXRA | NUCLEAR HORMONE RECEPTOR, TRANSCRIPTION FACTOR COMPLEX, DRUGGABLE GENOME, CLINICALLY ACTIONABLE, TRANSCRIPTION FACTOR | | DIBUTYLDICHLOROSTANNANE | DIBUTYLDICHLOROSTANNANE | |
| 6256 | RXRA | NUCLEAR HORMONE RECEPTOR, TRANSCRIPTION FACTOR COMPLEX, DRUGGABLE GENOME, CLINICALLY ACTIONABLE, TRANSCRIPTION FACTOR | | DACTINOMYCIN | DACTINOMYCIN | |
| 6256 | RXRA | NUCLEAR HORMONE RECEPTOR, TRANSCRIPTION FACTOR COMPLEX, DRUGGABLE GENOME, CLINICALLY ACTIONABLE, TRANSCRIPTION FACTOR | | CHLORFENAPYR | CHLORFENAPYR | |


