
|
|||||
|
 | |
| |
| |
| |
| |
| |
|
Gene: RWDD3 |
Gene summary for RWDD3 |
| Gene information | Species | Human | Gene symbol | RWDD3 | Gene ID | 25950 |
| Gene name | RWD domain containing 3 | |
| Gene Alias | RSUME | |
| Cytomap | 1p21.3 | |
| Gene Type | protein-coding | GO ID | GO:0001666 | UniProtAcc | D3DT49 |
Top |
Malignant transformation analysis |
| Identification of the aberrant gene expression in precancerous and cancerous lesions by comparing the gene expression of stem-like cells in diseased tissues with normal stem cells |
| Entrez ID | Symbol | Replicates | Species | Organ | Tissue | Adj P-value | Log2FC | Malignancy |
| 25950 | RWDD3 | LZE4T | Human | Esophagus | ESCC | 2.34e-03 | 1.67e-01 | 0.0811 |
| 25950 | RWDD3 | LZE7T | Human | Esophagus | ESCC | 6.41e-13 | 5.15e-01 | 0.0667 |
| 25950 | RWDD3 | LZE8T | Human | Esophagus | ESCC | 3.64e-07 | 3.01e-01 | 0.067 |
| 25950 | RWDD3 | LZE20T | Human | Esophagus | ESCC | 2.10e-02 | 1.91e-01 | 0.0662 |
| 25950 | RWDD3 | LZE24T | Human | Esophagus | ESCC | 6.52e-09 | 2.99e-01 | 0.0596 |
| 25950 | RWDD3 | LZE21T | Human | Esophagus | ESCC | 4.95e-02 | 2.24e-01 | 0.0655 |
| 25950 | RWDD3 | P1T-E | Human | Esophagus | ESCC | 3.80e-07 | 2.90e-01 | 0.0875 |
| 25950 | RWDD3 | P2T-E | Human | Esophagus | ESCC | 1.17e-32 | 4.54e-01 | 0.1177 |
| 25950 | RWDD3 | P4T-E | Human | Esophagus | ESCC | 7.33e-17 | 3.92e-01 | 0.1323 |
| 25950 | RWDD3 | P5T-E | Human | Esophagus | ESCC | 3.49e-17 | 3.17e-01 | 0.1327 |
| 25950 | RWDD3 | P8T-E | Human | Esophagus | ESCC | 2.11e-21 | 4.62e-01 | 0.0889 |
| 25950 | RWDD3 | P9T-E | Human | Esophagus | ESCC | 1.62e-13 | 3.26e-01 | 0.1131 |
| 25950 | RWDD3 | P10T-E | Human | Esophagus | ESCC | 4.30e-29 | 4.59e-01 | 0.116 |
| 25950 | RWDD3 | P11T-E | Human | Esophagus | ESCC | 4.63e-08 | 3.83e-01 | 0.1426 |
| 25950 | RWDD3 | P12T-E | Human | Esophagus | ESCC | 9.78e-89 | 1.70e+00 | 0.1122 |
| 25950 | RWDD3 | P15T-E | Human | Esophagus | ESCC | 1.19e-10 | 2.89e-01 | 0.1149 |
| 25950 | RWDD3 | P16T-E | Human | Esophagus | ESCC | 1.51e-17 | 3.12e-01 | 0.1153 |
| 25950 | RWDD3 | P17T-E | Human | Esophagus | ESCC | 2.09e-05 | 2.32e-01 | 0.1278 |
| 25950 | RWDD3 | P19T-E | Human | Esophagus | ESCC | 2.42e-03 | 2.77e-01 | 0.1662 |
| 25950 | RWDD3 | P20T-E | Human | Esophagus | ESCC | 3.16e-24 | 5.12e-01 | 0.1124 |
| Page: 1 2 3 4 |
| Tissue | Expression Dynamics | Abbreviation |
| Esophagus | 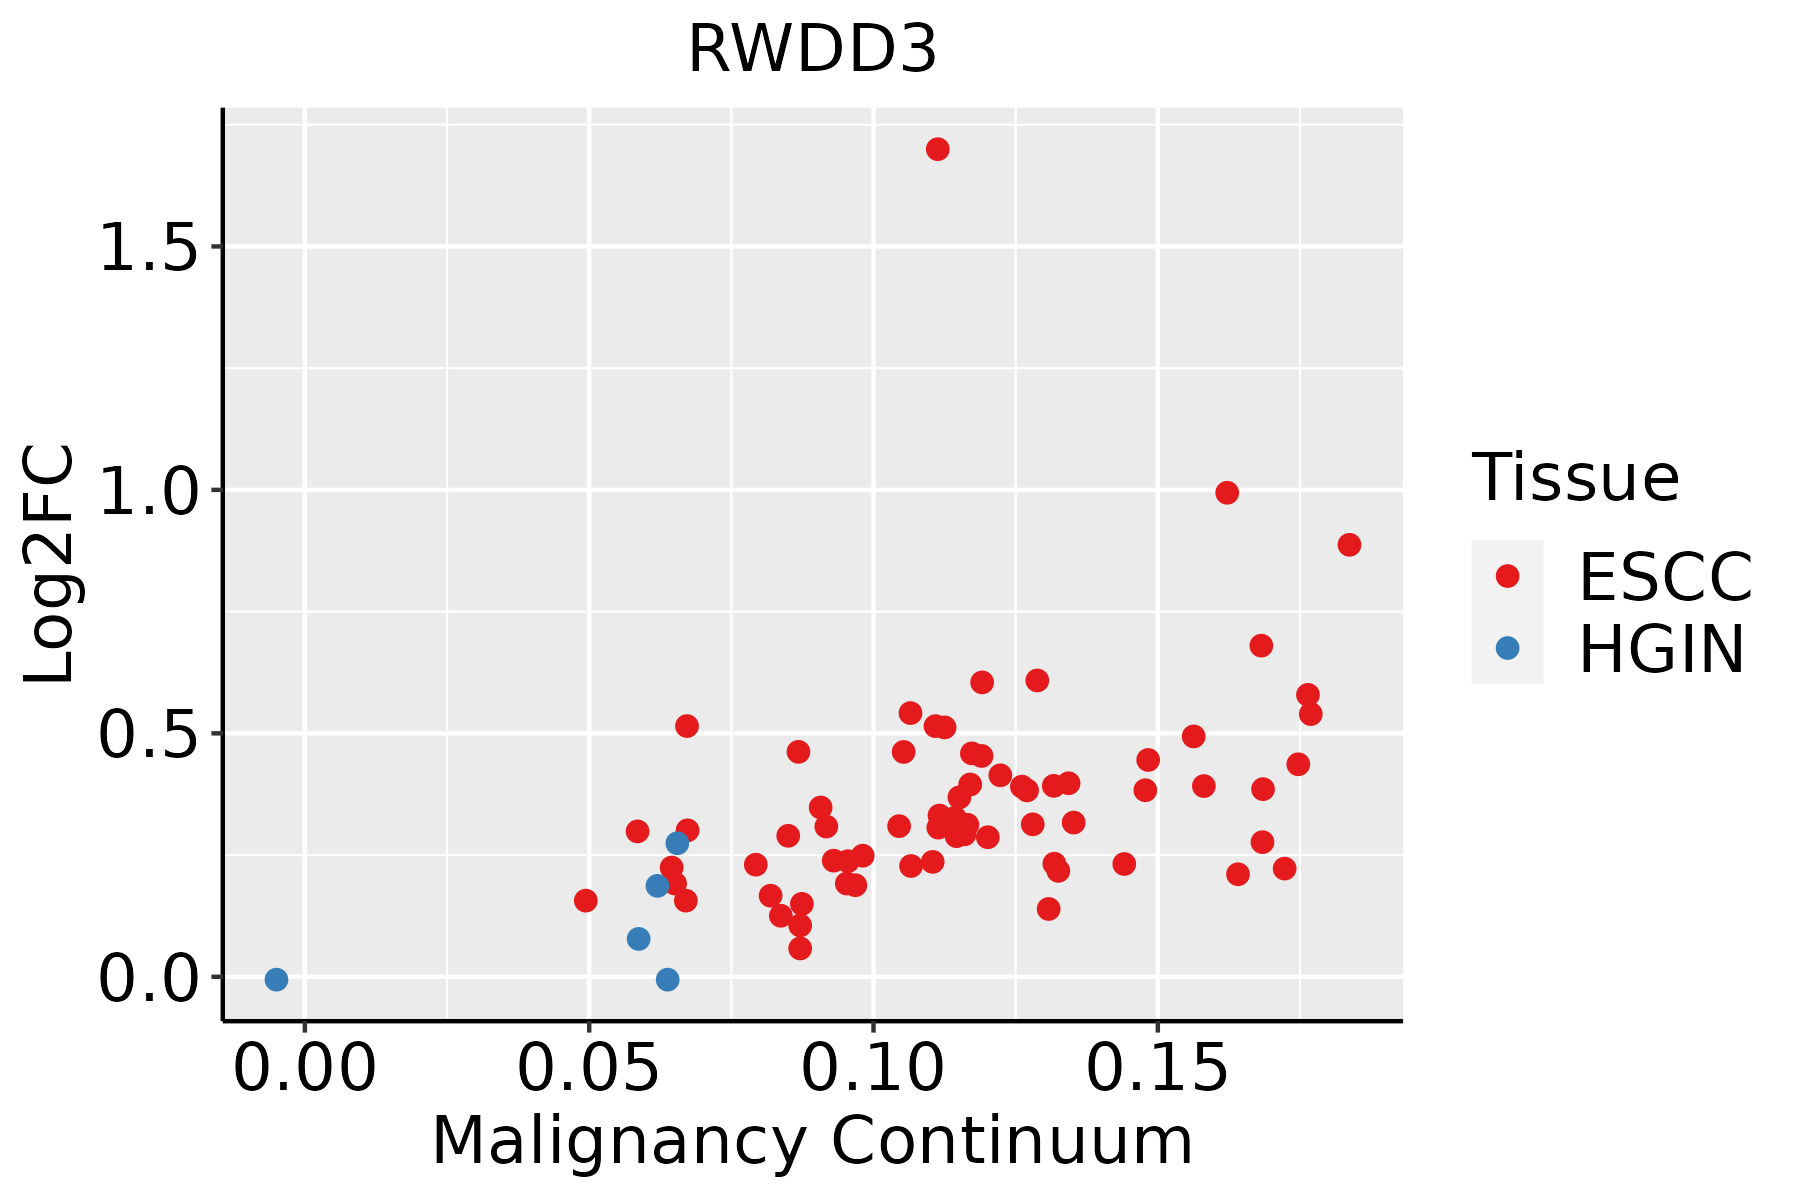 | ESCC: Esophageal squamous cell carcinoma |
| HGIN: High-grade intraepithelial neoplasias | ||
| LGIN: Low-grade intraepithelial neoplasias | ||
| Liver | 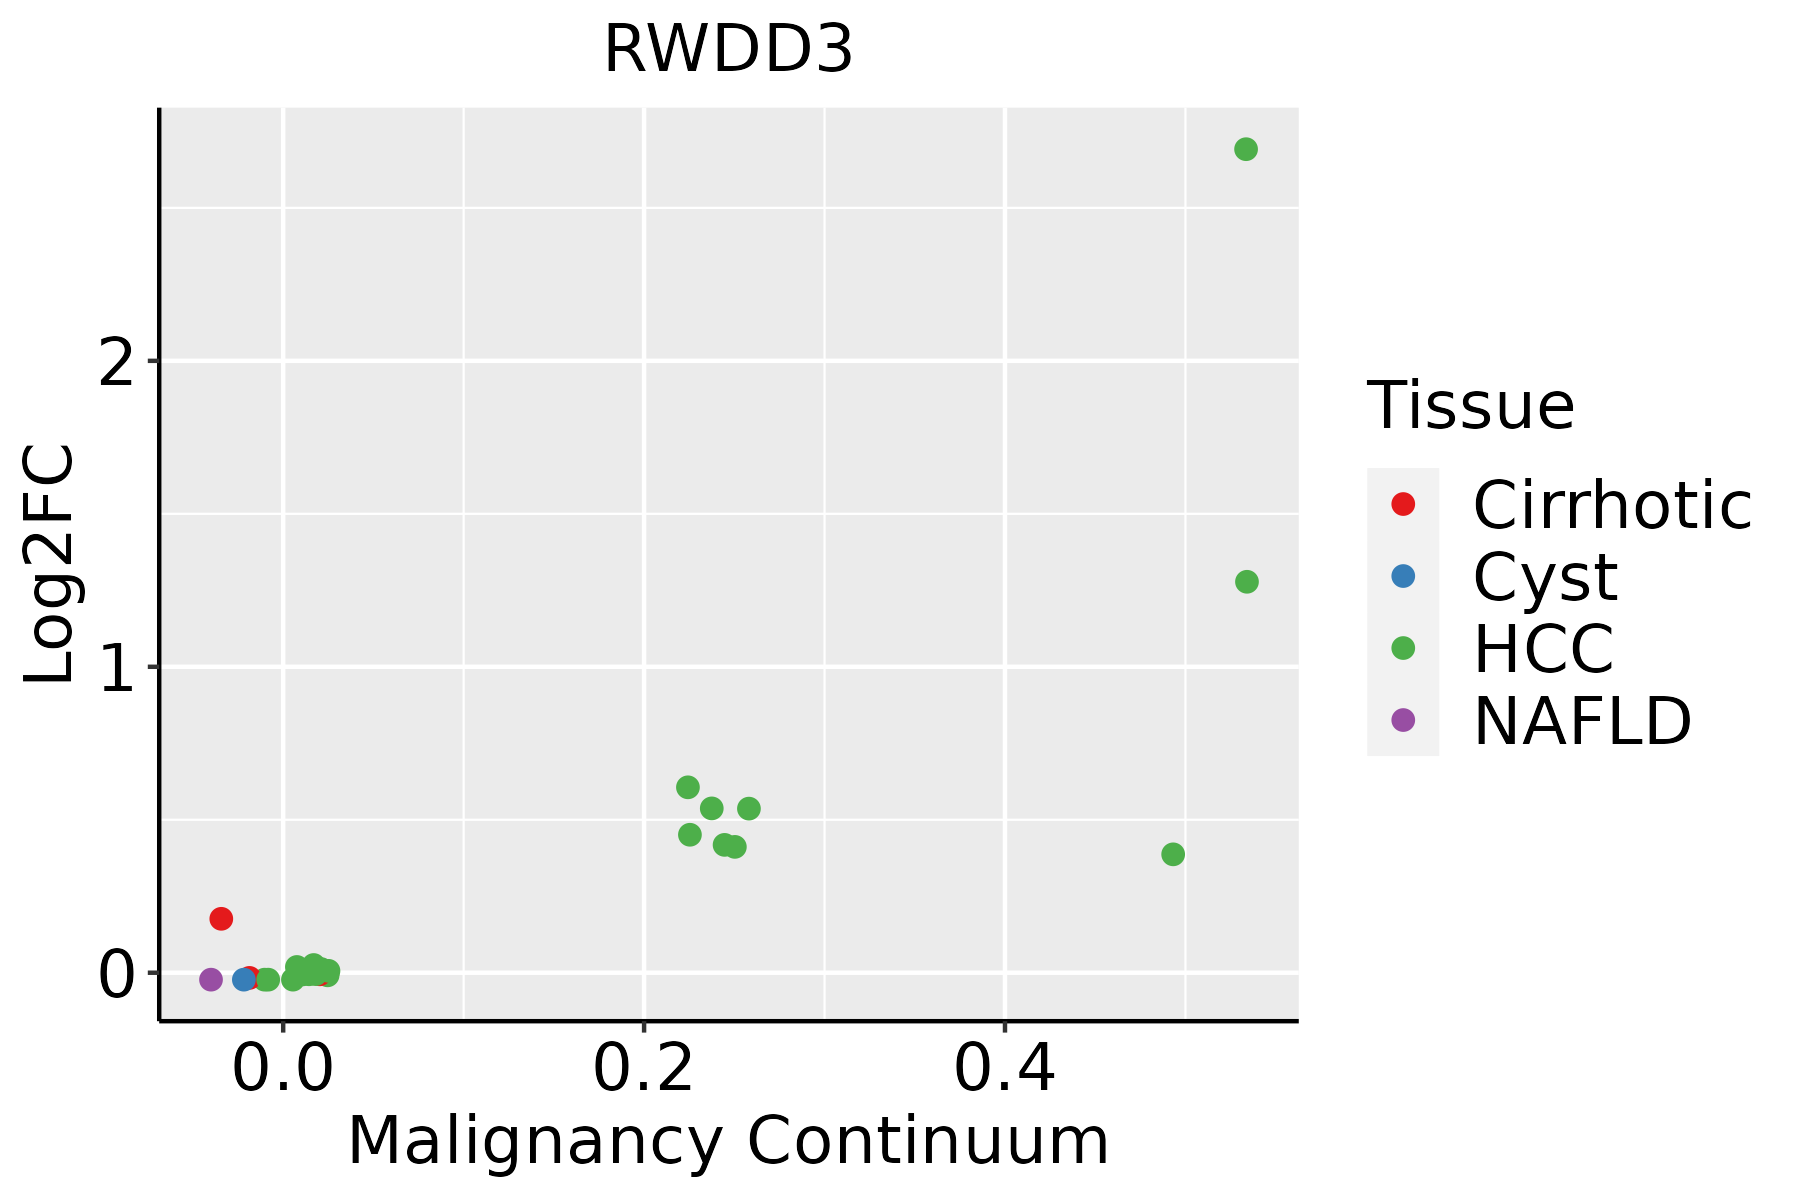 | HCC: Hepatocellular carcinoma |
| NAFLD: Non-alcoholic fatty liver disease |
| ∗log2FC in expression of this searched gene in stem-like cells from each diseased tissue sample relative to stem-like cells in normal samples in each tissue plotted against the malignancy continuum. Samples are colored based on if they are from different disease stage. |
Top |
Malignant transformation related pathway analysis |
| Find out the enriched GO biological processes and KEGG pathways involved in transition from healthy to precancer to cancer |
| Tissue | Disease Stage | Enriched GO biological Processes |
| Colorectum | AD |  |
| Colorectum | SER |  |
| Colorectum | MSS |  |
| Colorectum | MSI-H |  |
| Colorectum | FAP |  |
| ∗Top 15 enriched GO BP terms are showed in the bar plot of each disease state in each tissue. Each row represents a significant GO biological process which is colored according to the -log10(p.adjust). |
| Page: 1 2 3 4 5 6 7 8 9 |
| GO ID | Tissue | Disease Stage | Description | Gene Ratio | Bg Ratio | pvalue | p.adjust | Count |
| GO:1903320111 | Esophagus | ESCC | regulation of protein modification by small protein conjugation or removal | 181/8552 | 242/18723 | 1.80e-20 | 2.60e-18 | 181 |
| GO:001820514 | Esophagus | ESCC | peptidyl-lysine modification | 259/8552 | 376/18723 | 3.90e-20 | 5.26e-18 | 259 |
| GO:0070482111 | Esophagus | ESCC | response to oxygen levels | 218/8552 | 347/18723 | 6.91e-11 | 2.17e-09 | 218 |
| GO:190332216 | Esophagus | ESCC | positive regulation of protein modification by small protein conjugation or removal | 99/8552 | 138/18723 | 4.39e-10 | 1.16e-08 | 99 |
| GO:0036293111 | Esophagus | ESCC | response to decreased oxygen levels | 201/8552 | 322/18723 | 8.37e-10 | 2.04e-08 | 201 |
| GO:0001666111 | Esophagus | ESCC | response to hypoxia | 192/8552 | 307/18723 | 1.59e-09 | 3.69e-08 | 192 |
| GO:0071453110 | Esophagus | ESCC | cellular response to oxygen levels | 114/8552 | 177/18723 | 3.63e-07 | 5.06e-06 | 114 |
| GO:0036294110 | Esophagus | ESCC | cellular response to decreased oxygen levels | 105/8552 | 161/18723 | 4.20e-07 | 5.73e-06 | 105 |
| GO:00510908 | Esophagus | ESCC | regulation of DNA-binding transcription factor activity | 252/8552 | 440/18723 | 5.22e-07 | 6.97e-06 | 252 |
| GO:001692512 | Esophagus | ESCC | protein sumoylation | 41/8552 | 53/18723 | 2.49e-06 | 2.86e-05 | 41 |
| GO:007145616 | Esophagus | ESCC | cellular response to hypoxia | 97/8552 | 151/18723 | 3.12e-06 | 3.51e-05 | 97 |
| GO:00434332 | Esophagus | ESCC | negative regulation of DNA-binding transcription factor activity | 103/8552 | 185/18723 | 3.86e-03 | 1.57e-02 | 103 |
| GO:00332331 | Esophagus | ESCC | regulation of protein sumoylation | 18/8552 | 25/18723 | 7.04e-03 | 2.56e-02 | 18 |
| GO:0033235 | Esophagus | ESCC | positive regulation of protein sumoylation | 10/8552 | 12/18723 | 8.94e-03 | 3.12e-02 | 10 |
| GO:00320882 | Esophagus | ESCC | negative regulation of NF-kappaB transcription factor activity | 54/8552 | 93/18723 | 1.08e-02 | 3.67e-02 | 54 |
| GO:190332022 | Liver | HCC | regulation of protein modification by small protein conjugation or removal | 167/7958 | 242/18723 | 4.99e-17 | 4.72e-15 | 167 |
| GO:00182052 | Liver | HCC | peptidyl-lysine modification | 230/7958 | 376/18723 | 1.51e-13 | 8.32e-12 | 230 |
| GO:19033221 | Liver | HCC | positive regulation of protein modification by small protein conjugation or removal | 94/7958 | 138/18723 | 9.87e-10 | 3.01e-08 | 94 |
| GO:000166612 | Liver | HCC | response to hypoxia | 172/7958 | 307/18723 | 1.06e-06 | 1.59e-05 | 172 |
| GO:003629312 | Liver | HCC | response to decreased oxygen levels | 179/7958 | 322/18723 | 1.29e-06 | 1.87e-05 | 179 |
| Page: 1 2 |
| Pathway ID | Tissue | Disease Stage | Description | Gene Ratio | Bg Ratio | pvalue | p.adjust | qvalue | Count |
| Page: 1 |
Top |
Cell-cell communication analysis |
| Identification of potential cell-cell interactions between two cell types and their ligand-receptor pairs for different disease states |
| Ligand | Receptor | LRpair | Pathway | Tissue | Disease Stage |
| Page: 1 |
Top |
Single-cell gene regulatory network inference analysis |
| Find out the significant the regulons (TFs) and the target genes of each regulon across cell types for different disease states |
| TF | Cell Type | Tissue | Disease Stage | Target Gene | RSS | Regulon Activity |
| ∗The dot plots of a searched regulon are shown for all cell subpopulations in each disease state of each tissue based on the regulon specific score inferred using pySCENIC and by calculating the average expression. |
| Page: 1 |
Top |
Somatic mutation of malignant transformation related genes |
| Annotation of somatic variants for genes involved in malignant transformation |
| Hugo Symbol | Variant Class | Variant Classification | dbSNP RS | HGVSc | HGVSp | HGVSp Short | SWISSPROT | BIOTYPE | SIFT | PolyPhen | Tumor Sample Barcode | Tissue | Histology | Sex | Age | Stage | Therapy Types | Drugs | Outcome |
| RWDD3 | SNV | Missense_Mutation | c.353C>G | p.Pro118Arg | p.P118R | Q9Y3V2 | protein_coding | deleterious(0.02) | benign(0.28) | TCGA-B6-A0I6-01 | Breast | breast invasive carcinoma | Female | <65 | I/II | Unknown | Unknown | PD | |
| RWDD3 | SNV | Missense_Mutation | novel | c.251A>G | p.Lys84Arg | p.K84R | Q9Y3V2 | protein_coding | tolerated(0.53) | benign(0.005) | TCGA-VS-A9V4-01 | Cervix | cervical & endocervical cancer | Female | <65 | I/II | Chemotherapy | cisplatin | PD |
| RWDD3 | SNV | Missense_Mutation | c.497N>C | p.Leu166Ser | p.L166S | Q9Y3V2 | protein_coding | deleterious(0) | probably_damaging(0.998) | TCGA-AA-3663-01 | Colorectum | colon adenocarcinoma | Male | <65 | I/II | Unknown | Unknown | SD | |
| RWDD3 | SNV | Missense_Mutation | c.85G>A | p.Glu29Lys | p.E29K | Q9Y3V2 | protein_coding | tolerated(0.14) | benign(0.003) | TCGA-CM-5861-01 | Colorectum | colon adenocarcinoma | Female | <65 | I/II | Unknown | Unknown | PD | |
| RWDD3 | SNV | Missense_Mutation | c.370A>C | p.Ser124Arg | p.S124R | Q9Y3V2 | protein_coding | tolerated(0.18) | benign(0) | TCGA-AG-A002-01 | Colorectum | rectum adenocarcinoma | Male | <65 | I/II | Unknown | Unknown | SD | |
| RWDD3 | SNV | Missense_Mutation | novel | c.669N>C | p.Lys223Asn | p.K223N | Q9Y3V2 | protein_coding | deleterious(0.03) | benign(0.397) | TCGA-A5-A0G2-01 | Endometrium | uterine corpus endometrioid carcinoma | Female | <65 | III/IV | Unknown | Unknown | SD |
| RWDD3 | SNV | Missense_Mutation | c.332N>G | p.Leu111Arg | p.L111R | Q9Y3V2 | protein_coding | deleterious(0) | probably_damaging(1) | TCGA-A5-A0VP-01 | Endometrium | uterine corpus endometrioid carcinoma | Female | >=65 | I/II | Unknown | Unknown | SD | |
| RWDD3 | SNV | Missense_Mutation | novel | c.290A>G | p.Glu97Gly | p.E97G | Q9Y3V2 | protein_coding | deleterious(0.01) | probably_damaging(0.942) | TCGA-A5-A1OF-01 | Endometrium | uterine corpus endometrioid carcinoma | Female | <65 | I/II | Unknown | Unknown | SD |
| RWDD3 | SNV | Missense_Mutation | novel | c.464N>G | p.Tyr155Cys | p.Y155C | Q9Y3V2 | protein_coding | deleterious(0) | probably_damaging(0.999) | TCGA-AJ-A3EL-01 | Endometrium | uterine corpus endometrioid carcinoma | Female | <65 | I/II | Unknown | Unknown | SD |
| RWDD3 | SNV | Missense_Mutation | novel | c.627N>T | p.Lys209Asn | p.K209N | Q9Y3V2 | protein_coding | deleterious(0) | probably_damaging(0.997) | TCGA-AP-A1DV-01 | Endometrium | uterine corpus endometrioid carcinoma | Female | <65 | I/II | Unknown | Unknown | SD |
| Page: 1 2 3 4 |
Top |
Related drugs of malignant transformation related genes |
| Identification of chemicals and drugs interact with genes involved in malignant transfromation |
| (DGIdb 4.0) |
| Entrez ID | Symbol | Category | Interaction Types | Drug Claim Name | Drug Name | PMIDs |
| Page: 1 |

Copyright 2023-Present -The University of Texas Health Science Center at Houston |