
|
|||||
|
 | |
| |
| |
| |
| |
| |
|
Gene: RWDD2B |
Gene summary for RWDD2B |
| Gene information | Species | Human | Gene symbol | RWDD2B | Gene ID | 10069 |
| Gene name | RWD domain containing 2B | |
| Gene Alias | C21orf6 | |
| Cytomap | 21q21.3 | |
| Gene Type | protein-coding | GO ID | GO:0008150 | UniProtAcc | P57060 |
Top |
Malignant transformation analysis |
| Identification of the aberrant gene expression in precancerous and cancerous lesions by comparing the gene expression of stem-like cells in diseased tissues with normal stem cells |
| Entrez ID | Symbol | Replicates | Species | Organ | Tissue | Adj P-value | Log2FC | Malignancy |
| 10069 | RWDD2B | LZE24T | Human | Esophagus | ESCC | 9.55e-03 | 6.67e-02 | 0.0596 |
| 10069 | RWDD2B | P2T-E | Human | Esophagus | ESCC | 1.18e-02 | 8.63e-02 | 0.1177 |
| 10069 | RWDD2B | P4T-E | Human | Esophagus | ESCC | 2.35e-12 | 2.16e-01 | 0.1323 |
| 10069 | RWDD2B | P8T-E | Human | Esophagus | ESCC | 1.10e-06 | 8.05e-02 | 0.0889 |
| 10069 | RWDD2B | P9T-E | Human | Esophagus | ESCC | 7.06e-03 | 1.23e-01 | 0.1131 |
| 10069 | RWDD2B | P10T-E | Human | Esophagus | ESCC | 3.28e-07 | 1.85e-01 | 0.116 |
| 10069 | RWDD2B | P12T-E | Human | Esophagus | ESCC | 1.37e-05 | 1.34e-01 | 0.1122 |
| 10069 | RWDD2B | P16T-E | Human | Esophagus | ESCC | 3.16e-12 | 1.43e-01 | 0.1153 |
| 10069 | RWDD2B | P19T-E | Human | Esophagus | ESCC | 3.15e-03 | 2.50e-01 | 0.1662 |
| 10069 | RWDD2B | P21T-E | Human | Esophagus | ESCC | 4.39e-02 | 9.89e-02 | 0.1617 |
| 10069 | RWDD2B | P22T-E | Human | Esophagus | ESCC | 2.00e-03 | 9.55e-02 | 0.1236 |
| 10069 | RWDD2B | P23T-E | Human | Esophagus | ESCC | 1.89e-04 | 1.53e-01 | 0.108 |
| 10069 | RWDD2B | P24T-E | Human | Esophagus | ESCC | 9.22e-07 | 8.03e-02 | 0.1287 |
| 10069 | RWDD2B | P26T-E | Human | Esophagus | ESCC | 1.74e-05 | 8.52e-02 | 0.1276 |
| 10069 | RWDD2B | P27T-E | Human | Esophagus | ESCC | 2.65e-04 | 1.20e-01 | 0.1055 |
| 10069 | RWDD2B | P28T-E | Human | Esophagus | ESCC | 1.19e-07 | 1.61e-01 | 0.1149 |
| 10069 | RWDD2B | P30T-E | Human | Esophagus | ESCC | 1.56e-10 | 4.06e-01 | 0.137 |
| 10069 | RWDD2B | P31T-E | Human | Esophagus | ESCC | 1.48e-11 | 1.82e-01 | 0.1251 |
| 10069 | RWDD2B | P32T-E | Human | Esophagus | ESCC | 2.41e-08 | 1.64e-01 | 0.1666 |
| 10069 | RWDD2B | P37T-E | Human | Esophagus | ESCC | 3.52e-07 | 2.10e-01 | 0.1371 |
| Page: 1 2 3 |
| Tissue | Expression Dynamics | Abbreviation |
| Esophagus | 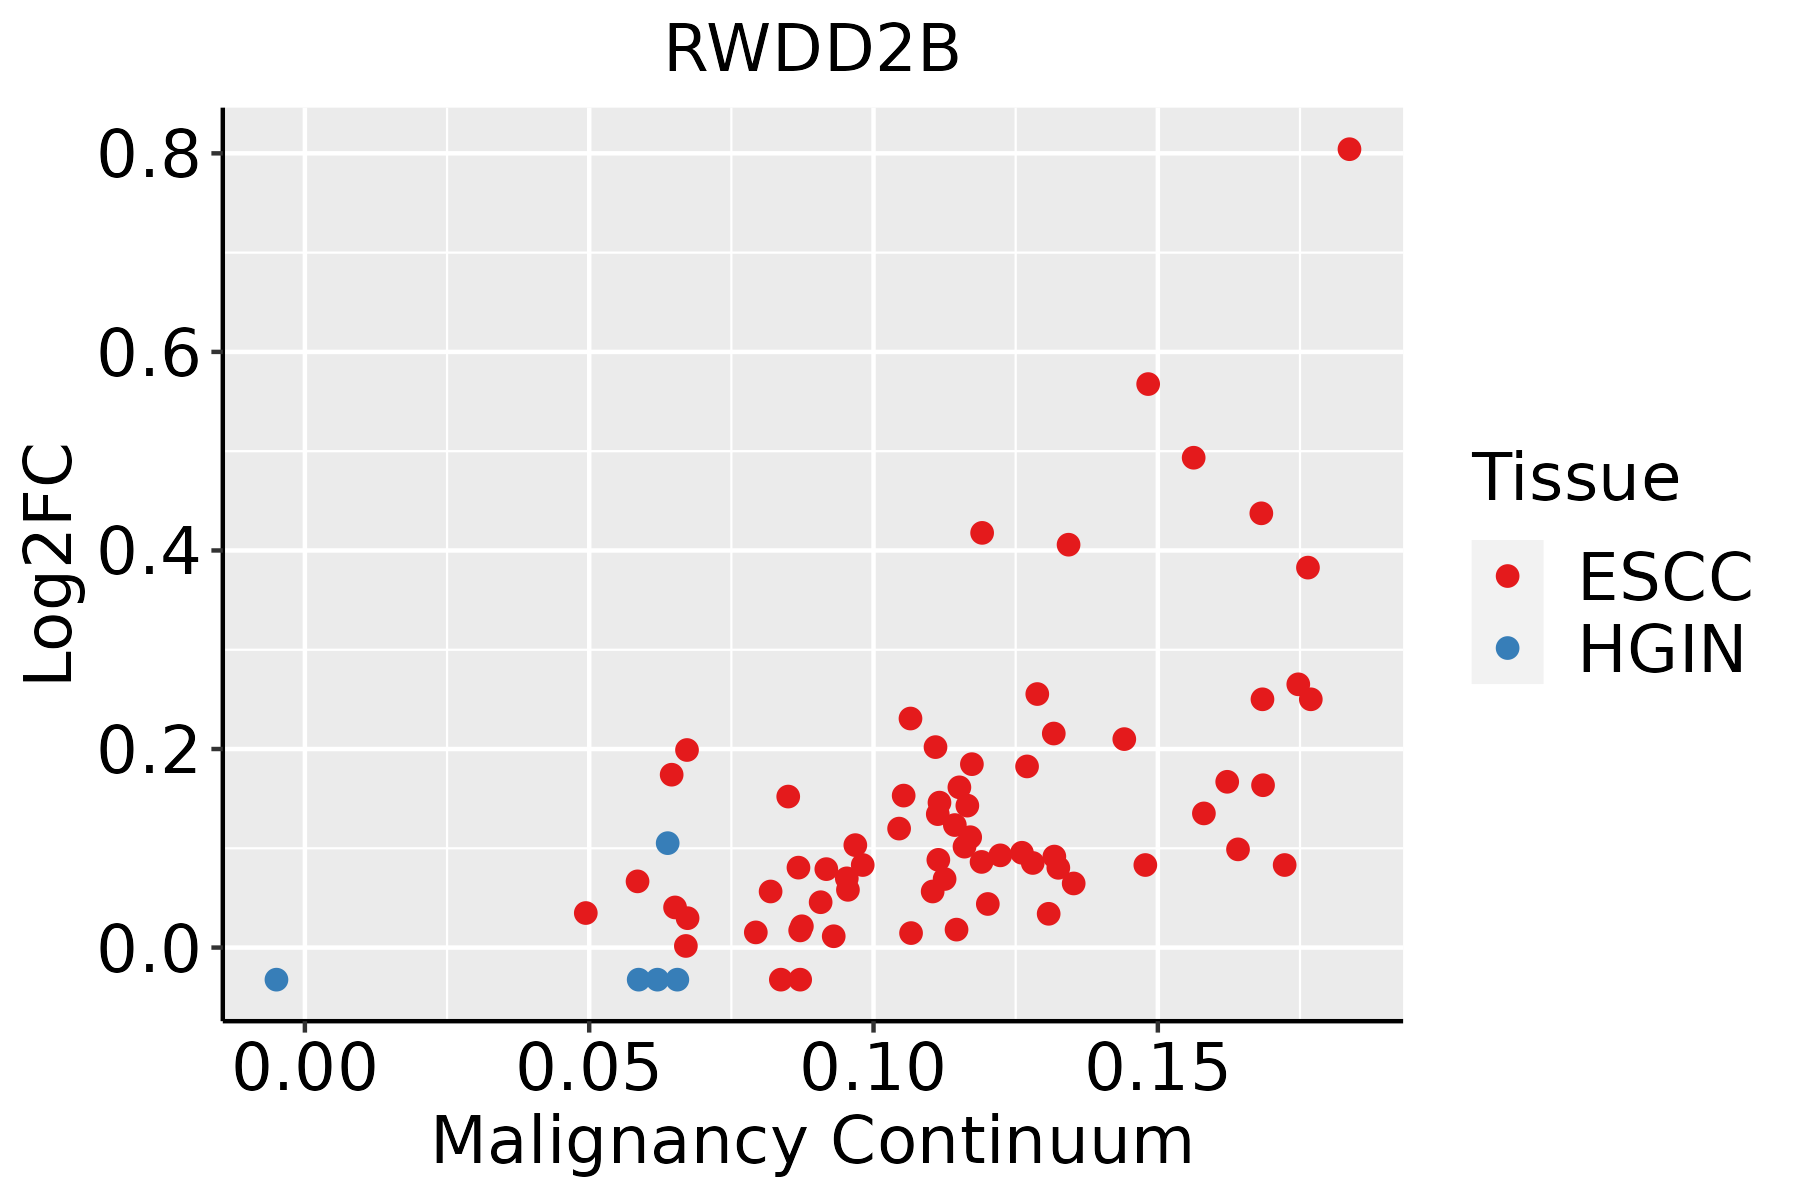 | ESCC: Esophageal squamous cell carcinoma |
| HGIN: High-grade intraepithelial neoplasias | ||
| LGIN: Low-grade intraepithelial neoplasias | ||
| Liver | 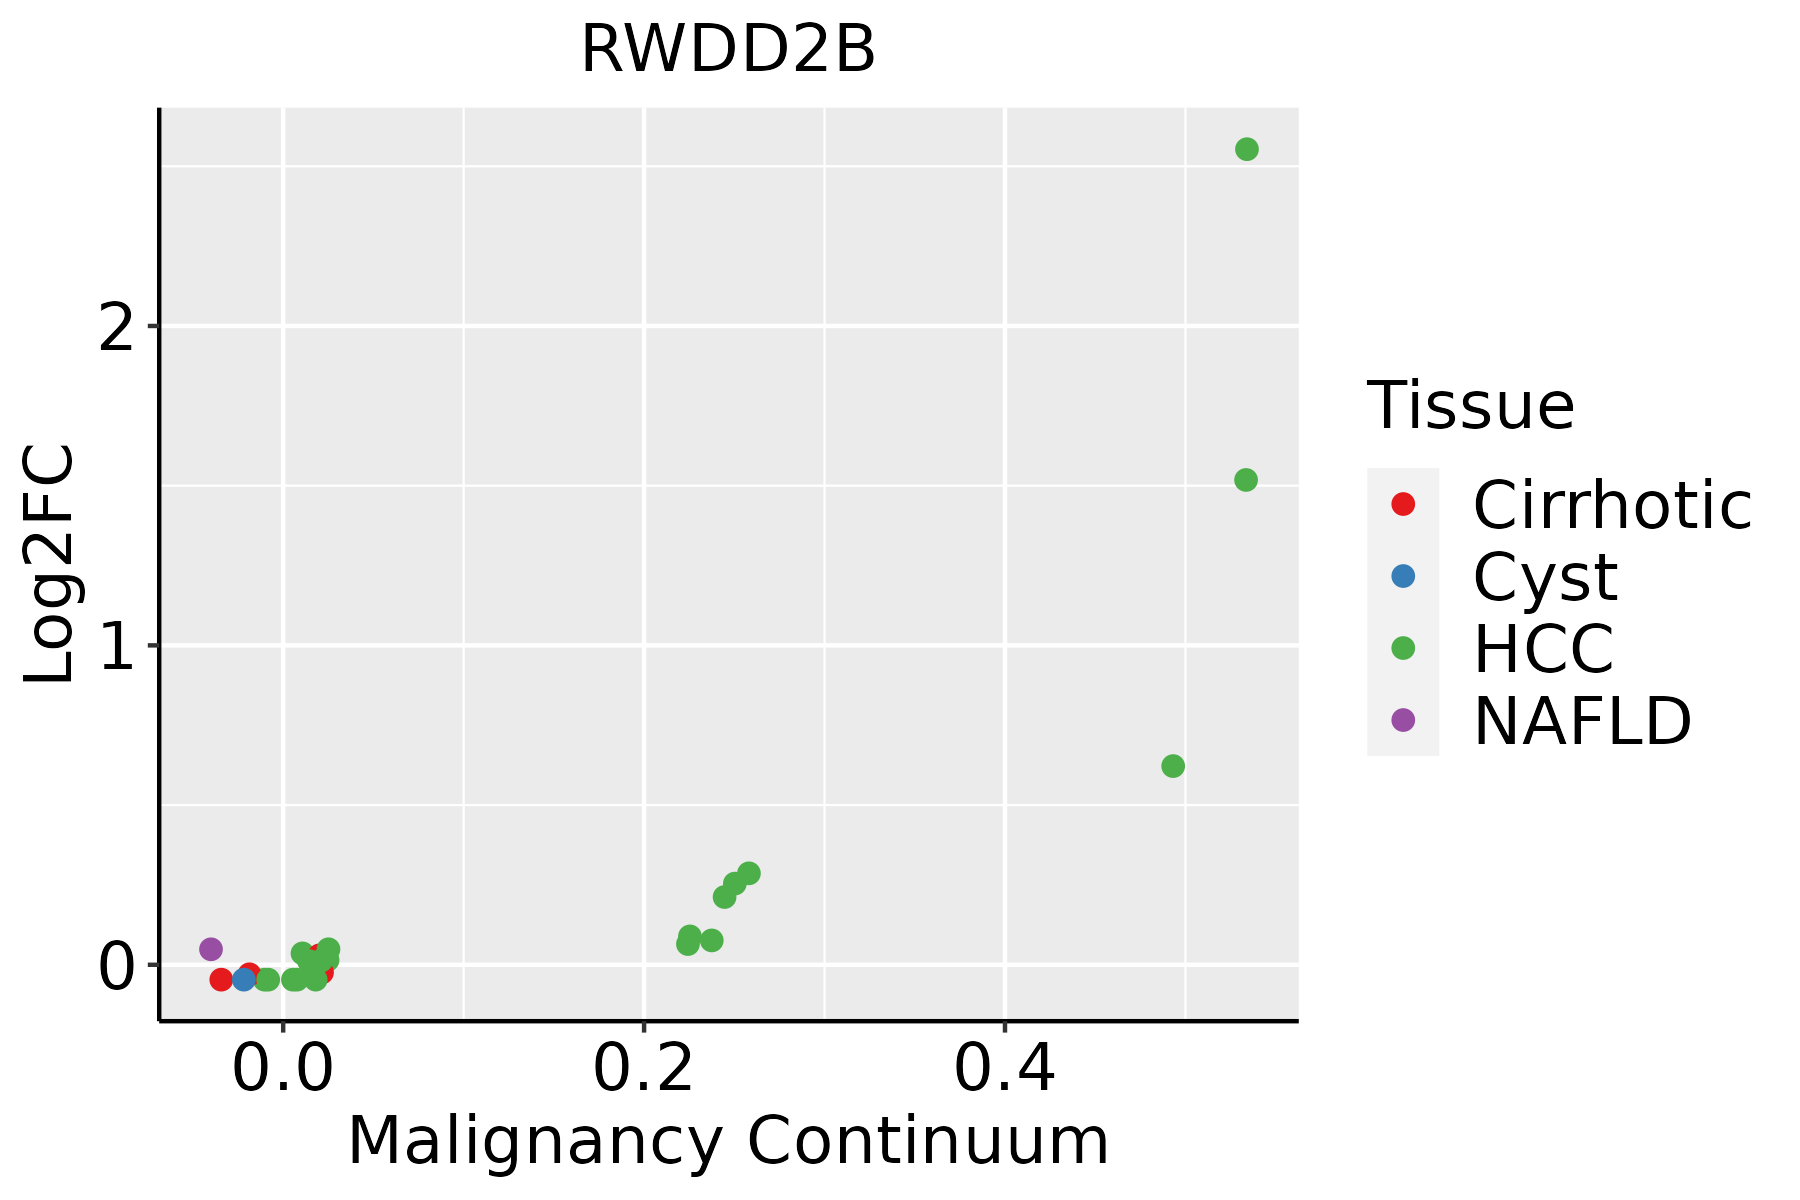 | HCC: Hepatocellular carcinoma |
| NAFLD: Non-alcoholic fatty liver disease |
| ∗log2FC in expression of this searched gene in stem-like cells from each diseased tissue sample relative to stem-like cells in normal samples in each tissue plotted against the malignancy continuum. Samples are colored based on if they are from different disease stage. |
Top |
Malignant transformation related pathway analysis |
| Find out the enriched GO biological processes and KEGG pathways involved in transition from healthy to precancer to cancer |
| Tissue | Disease Stage | Enriched GO biological Processes |
| Colorectum | AD |  |
| Colorectum | SER |  |
| Colorectum | MSS |  |
| Colorectum | MSI-H |  |
| Colorectum | FAP |  |
| ∗Top 15 enriched GO BP terms are showed in the bar plot of each disease state in each tissue. Each row represents a significant GO biological process which is colored according to the -log10(p.adjust). |
| Page: 1 2 3 4 5 6 7 8 9 |
| GO ID | Tissue | Disease Stage | Description | Gene Ratio | Bg Ratio | pvalue | p.adjust | Count |
| Page: 1 |
| Pathway ID | Tissue | Disease Stage | Description | Gene Ratio | Bg Ratio | pvalue | p.adjust | qvalue | Count |
| Page: 1 |
Top |
Cell-cell communication analysis |
| Identification of potential cell-cell interactions between two cell types and their ligand-receptor pairs for different disease states |
| Ligand | Receptor | LRpair | Pathway | Tissue | Disease Stage |
| Page: 1 |
Top |
Single-cell gene regulatory network inference analysis |
| Find out the significant the regulons (TFs) and the target genes of each regulon across cell types for different disease states |
| TF | Cell Type | Tissue | Disease Stage | Target Gene | RSS | Regulon Activity |
| ∗The dot plots of a searched regulon are shown for all cell subpopulations in each disease state of each tissue based on the regulon specific score inferred using pySCENIC and by calculating the average expression. |
| Page: 1 |
Top |
Somatic mutation of malignant transformation related genes |
| Annotation of somatic variants for genes involved in malignant transformation |
| Hugo Symbol | Variant Class | Variant Classification | dbSNP RS | HGVSc | HGVSp | HGVSp Short | SWISSPROT | BIOTYPE | SIFT | PolyPhen | Tumor Sample Barcode | Tissue | Histology | Sex | Age | Stage | Therapy Types | Drugs | Outcome |
| RWDD2B | SNV | Missense_Mutation | rs759008140 | c.581G>T | p.Ser194Ile | p.S194I | P57060 | protein_coding | deleterious(0) | probably_damaging(1) | TCGA-BH-A18G-01 | Breast | breast invasive carcinoma | Female | >=65 | I/II | Unknown | Unknown | SD |
| RWDD2B | insertion | Frame_Shift_Ins | novel | c.768_769insCACAGGGTGCTGATTGGTGTGTTTACAAACCTTGAGCTAGATAC | p.Glu257HisfsTer60 | p.E257Hfs*60 | P57060 | protein_coding | TCGA-A8-A0A4-01 | Breast | breast invasive carcinoma | Female | >=65 | I/II | Hormone Therapy | tamoxiphen | CR | ||
| RWDD2B | insertion | Frame_Shift_Ins | novel | c.804_805insACCTCAGGTAATCCGCCCGCCTCGGCCTCCCAAAGTGCTATTTATT | p.Glu269ThrfsTer16 | p.E269Tfs*16 | P57060 | protein_coding | TCGA-AN-A041-01 | Breast | breast invasive carcinoma | Female | <65 | I/II | Unknown | Unknown | SD | ||
| RWDD2B | SNV | Missense_Mutation | novel | c.30N>C | p.Trp10Cys | p.W10C | P57060 | protein_coding | tolerated_low_confidence(0.06) | benign(0.053) | TCGA-EA-A3HU-01 | Cervix | cervical & endocervical cancer | Female | <65 | I/II | Unknown | Unknown | SD |
| RWDD2B | SNV | Missense_Mutation | c.554N>A | p.Leu185His | p.L185H | P57060 | protein_coding | tolerated(0.32) | benign(0.007) | TCGA-A6-6780-01 | Colorectum | colon adenocarcinoma | Male | >=65 | I/II | Unknown | Unknown | SD | |
| RWDD2B | SNV | Missense_Mutation | c.865N>A | p.Gly289Arg | p.G289R | P57060 | protein_coding | deleterious(0.04) | probably_damaging(0.988) | TCGA-AA-3715-01 | Colorectum | colon adenocarcinoma | Male | >=65 | I/II | Unknown | Unknown | PD | |
| RWDD2B | SNV | Missense_Mutation | c.761G>A | p.Arg254His | p.R254H | P57060 | protein_coding | deleterious(0) | benign(0.077) | TCGA-AA-3977-01 | Colorectum | colon adenocarcinoma | Male | >=65 | I/II | Unknown | Unknown | SD | |
| RWDD2B | SNV | Missense_Mutation | rs146828876 | c.236N>A | p.Arg79Gln | p.R79Q | P57060 | protein_coding | tolerated(0.27) | benign(0.055) | TCGA-AA-3984-01 | Colorectum | colon adenocarcinoma | Female | <65 | I/II | Unknown | Unknown | SD |
| RWDD2B | SNV | Missense_Mutation | c.205N>T | p.Asp69Tyr | p.D69Y | P57060 | protein_coding | deleterious(0.01) | benign(0.027) | TCGA-AA-A010-01 | Colorectum | colon adenocarcinoma | Female | <65 | I/II | Chemotherapy | folinic | CR | |
| RWDD2B | SNV | Missense_Mutation | c.761N>A | p.Arg254His | p.R254H | P57060 | protein_coding | deleterious(0) | benign(0.077) | TCGA-CM-4746-01 | Colorectum | colon adenocarcinoma | Male | <65 | I/II | Unknown | Unknown | SD |
| Page: 1 2 3 4 5 |
Top |
Related drugs of malignant transformation related genes |
| Identification of chemicals and drugs interact with genes involved in malignant transfromation |
| (DGIdb 4.0) |
| Entrez ID | Symbol | Category | Interaction Types | Drug Claim Name | Drug Name | PMIDs |
| Page: 1 |

Copyright 2023-Present -The University of Texas Health Science Center at Houston |